Healthcare costs have been exploding even in Germany. The revisions in healthcare of about two years ago did expand the coverage, but the expanded costs were completely unexpected. That means Germany is also looking to now raise taxes to cover the higher costs due to their legislative reforms. The reforms have brought in more people in need of care and relatives than expected.
Currently, the tax contribution rate for healthcare in Germany is 2.55% of the gross wage and those who are childless pay even more since they lack a family to burden part of the costs. Their rate stands at 2.8% of their gross wage. In the United States, the Medicare tax is a fixed percentage of your gross pay as well with the percentage rate of 1.45%. There is no income cap for Medicare tax, so all of your gross pay is subject to this tax. Your employer pays another 1.45%.
The statutory long-term care insurance deficit in Germany came in at about three billion euros, which was much higher than expected. In fact, it was about 300% higher than the government’s forecasts. The Central Association of Statutory Health Insurance (GKV) has come out and stated that the sharp rise in the deficit was triggered by the reforms of the past two years. The move is to raise taxes even further since once benefits are given, they cannot just take them back. But what is absent from the discussion is the deficit has risen not simply because of the reforms. This sharp increase is due to the refugees who must be taken care of even though they do not work or pay the tax
Just to Clarify, we are also picking up Capital Inflows from the EU moving into Scandinavia – Denmark, Sweeden & Norway. We also see money moving into Poland and Hungary which appears to be some diversification movement. What has become increasingly apparent is the mere fact that confidence among SERIOUS money is starting to realize the EU is a failure.
As I have stated previously, the failure to consolidate the debts (see our original reports on the Euro) reflects the failure to really respect the different cultures within the EU no less trust them. This is why the debt was never consolidated and they adopted bail-ins so that one country would NOT be bailing out banks in another. This has all reflected at its core a refusal to accept the principle of a federalize Europe that MUST include transfer payments among states without prejudice.
You cannot have a system that dictates from the center but then refuses to actually respect the member states are one political body. This European Experiment has been a complete failure because it is trying to create some sort of half-baked-country in name only.
The EU should have remained as simply a trade union. Leave it at that. Centralized control was the downfall of Russia and China under a communist state system. People know best how to expand and respond to economic conditions. Germany depends on an export model and Greece depends on a tourist model. These are starkly different economics models.
Moreover, the EU should respect the individual member states that one-size does not fit all. Furthermore, the average family is better equipped to save for their future than pretend social programs that if operated by a private individual would be a criminal charge of frau
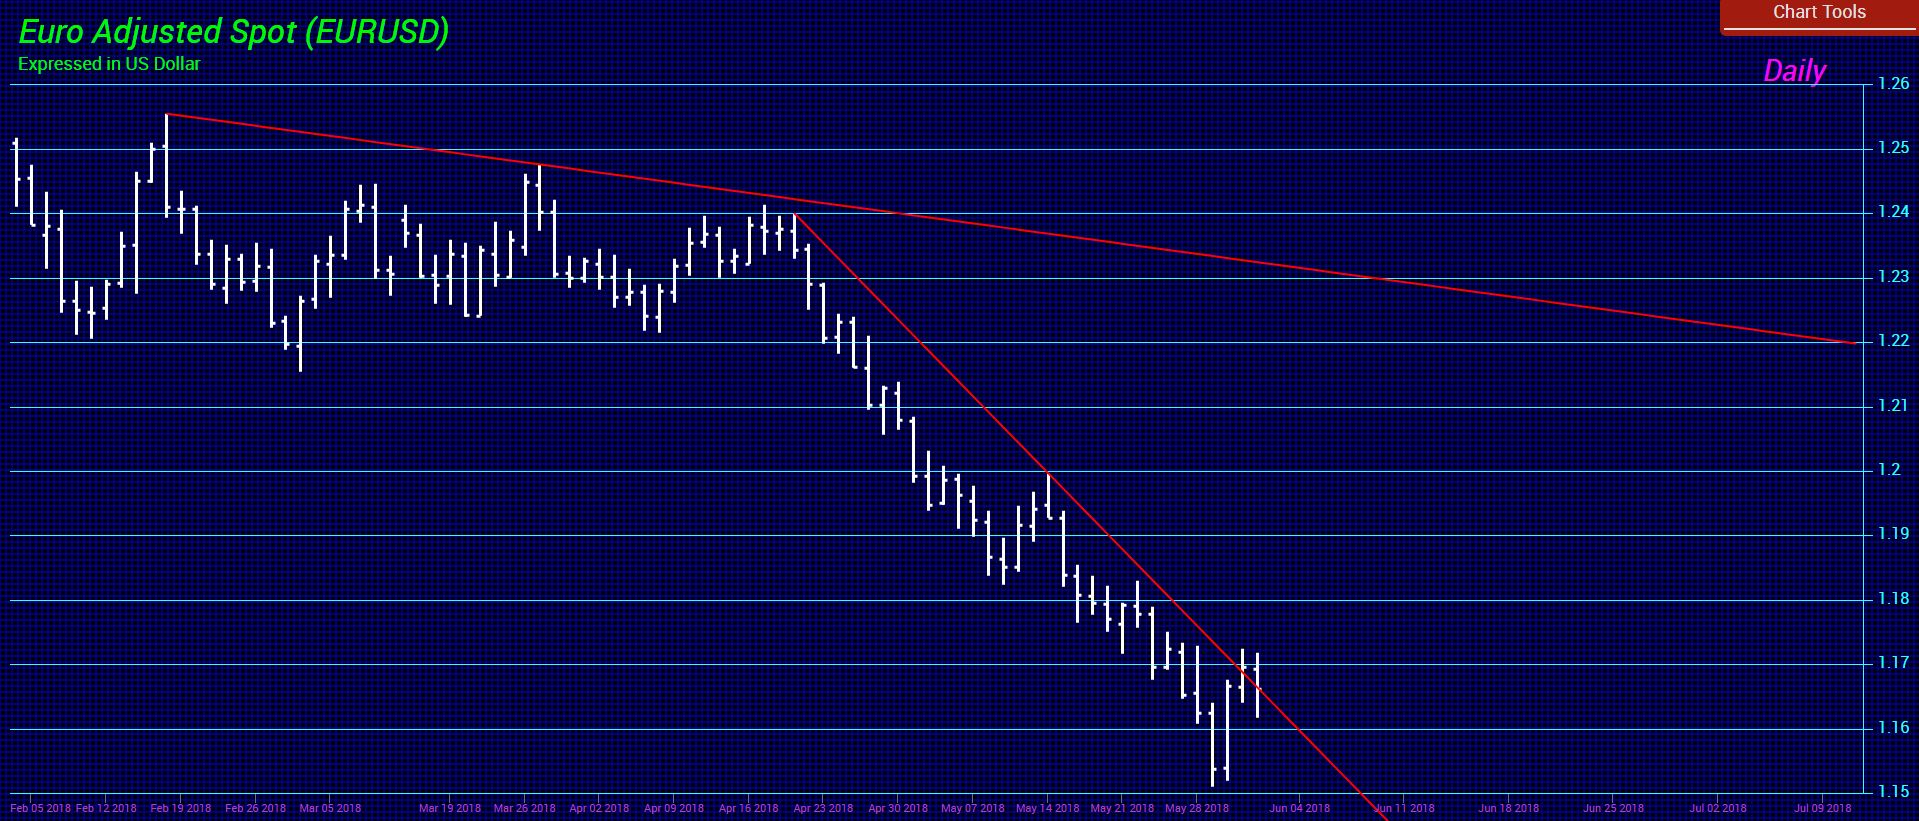
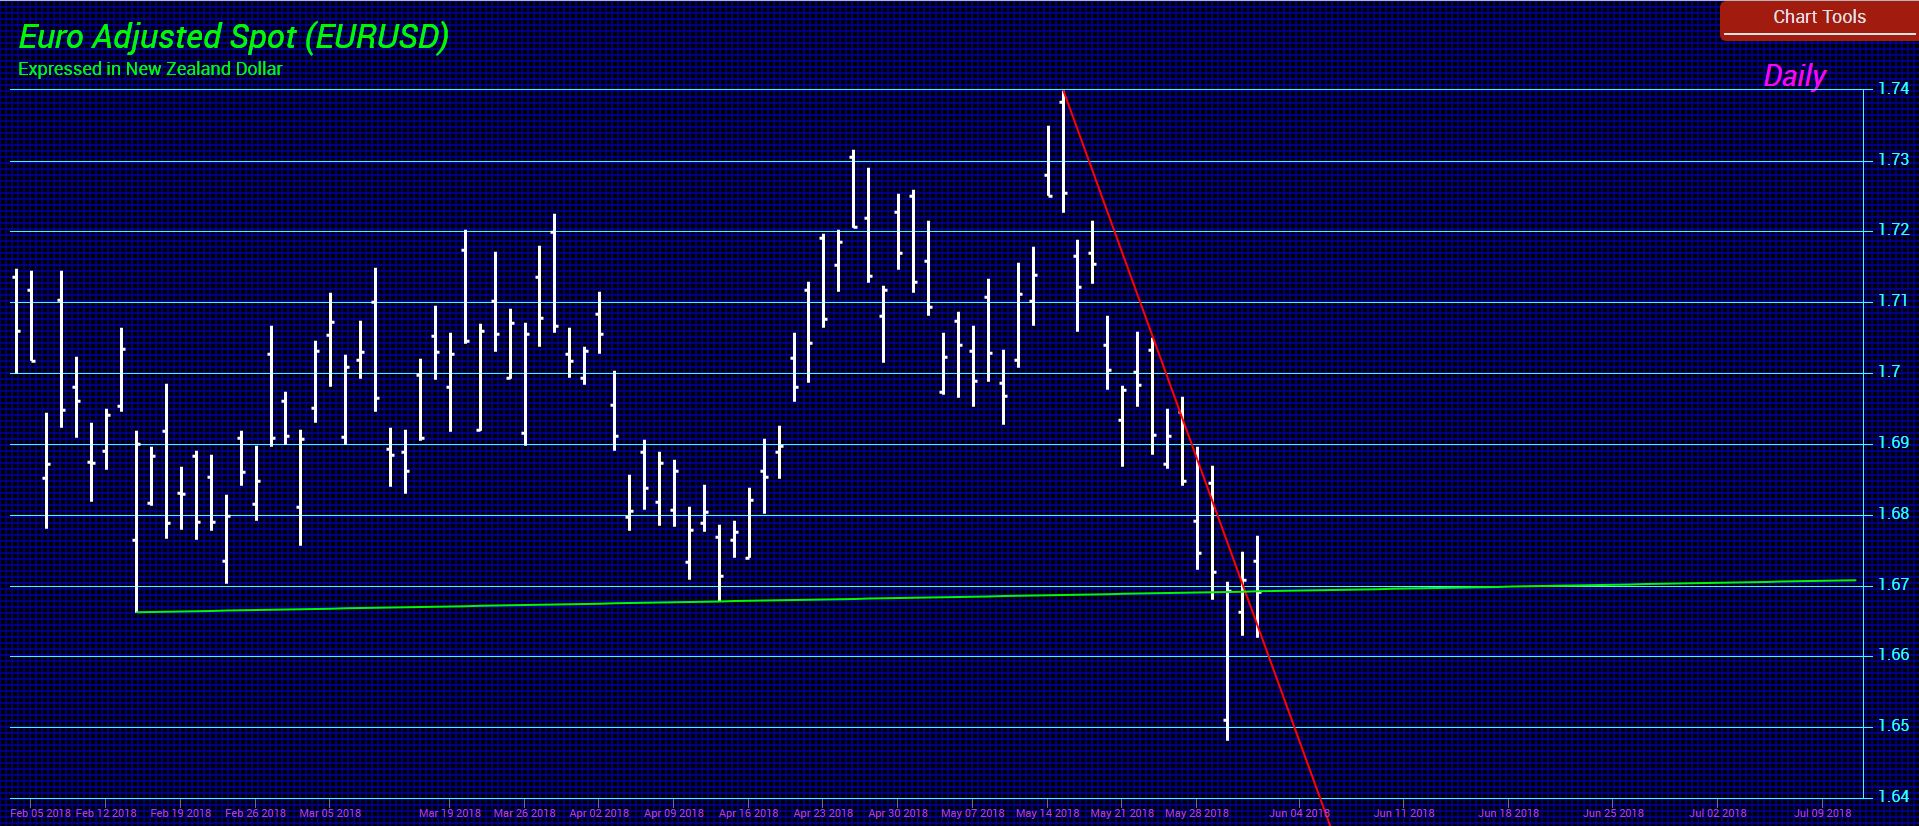
QUESTION: Hello Mr. Martin Armstrong. Why is it that if EURUSD goes down 20 – 30 pips other pairs with the EUR – such as the EURAUD or EURNZD go down 50 – 150 pips? Why such difference and volatility with these pairs?
JMF
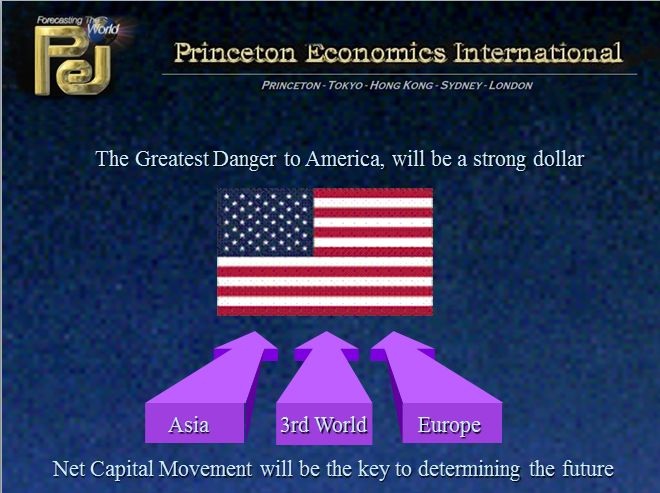
ANSWER: The reason for this is simply that the US dollar is in a broader bull market. This is how the world monetary system collapses. A lower dollar devalues debt and everyone is fat and happy. You determine a trend by monitoring the performance of any market and observing it from a host of different perspectives. Each market is reflecting the differences in trends that are influenced by both domestic political trends and the local business cycle, as well as by the external influences from capital flows moving in or out of a country. Keep in mind that we have some countries that are PUNISHING foreign investors for daring to invest in their country. They are deliberating trying to prevent a rise in real estate and that sets in motion an economic decline domestically since it tends to reverse the capital flows altogether.
QUESTION: Hi Martin
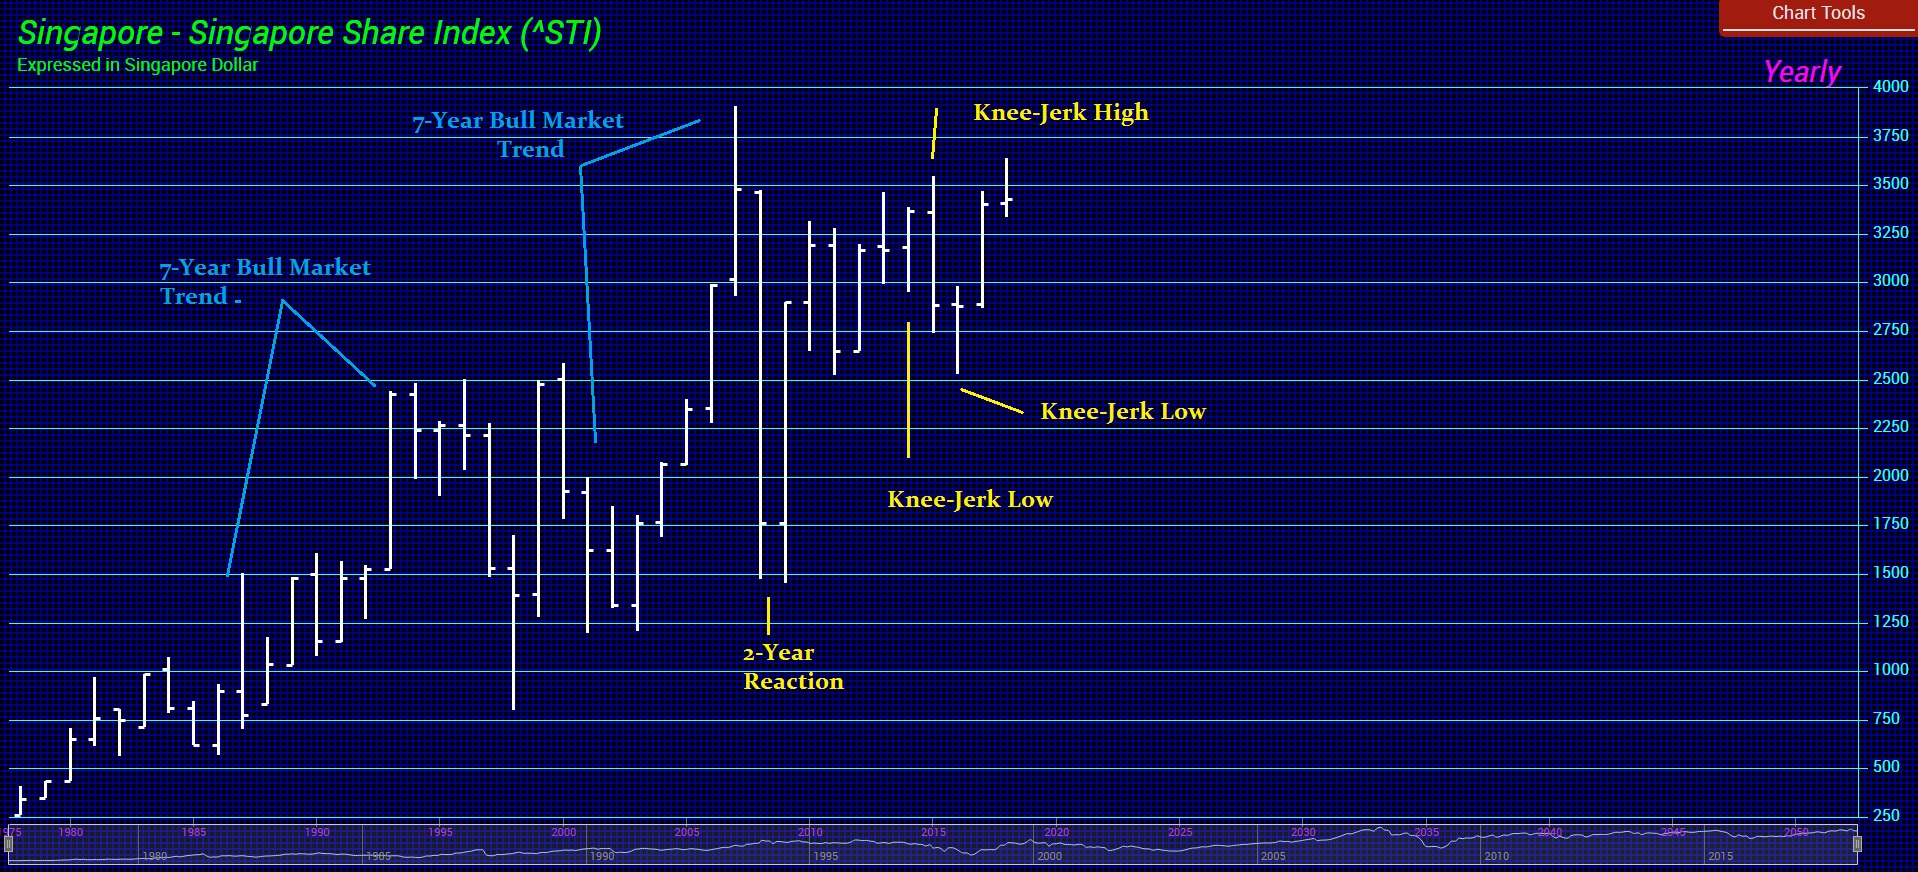
Was curious if you could address what Socrates has popped up on the last report….of a “Knee Jerk Low” this quarter. Is this a possibility that we should be on guard for?
A very thankful follower of your work!!
C
ANSWER: The terminology I have developed is unique and it comes from actually studying market behavior. I have explained that a “reaction” is limited to the time period of three or less be it a day, week, month, quarter, or year. Move beyond 3 years and you are changing trend. Keep in mind that when we are dealing with the higher level such as yearly, the percentage movement can be dramatic. But also the more dramatic the higher the probability that it will remain as a reaction. For example, the Dow Jones Industrial Index peaked in September 1929 at 386.10 and crashed going into July 1932 bottom at 40.56. That still qualified as a “reaction” being 3 years compared to the Nikkei which crashed but progressively moved lower into a bear market trend that bottomed in 19 years falling from 38957.44 to 6994.90.
The Knee-Jerk events can be highs or lows but are confined to one unit of time. They refect choppy markets. Here is Singapore share index. Note that there were three back-to-back Knee-Jerk events. This is what the Global Market Watch is forecasting. Not necessarily a change in trend, just a choppy move normally in the opposite direction.
Guatemala’s Fuego volcano erupted with the most violent volcanic eruption in more than a century. People have been buried alive in the ash like Pompey. The eruption so far took place on Sunday and lasted for 16 and a half hours. The eruption reached 14,763 feet of ash thrown into the air. This is one of the more spectacular photos taken with lightning posted by Gloria Garces. You can see a brief video of the eruption captured by satellites at the NOAA.
So far, we have three volcanoes now all erupting here in 2018 around the Pacific Rim of Fire. As previously warned, the more volcanos that erupt now contribute to the decline in temperature and this will help set the stage for the commodity rally coming in the years ahead. Nature is incredibly linked to cyclical behavior.
If everyone on the planet were to step on one side of a giant balance scale, and all the bacteria on Earth were to be placed on the other side, we’d shoot violently upward. That’s because all the bacteria on Earth combined are about 1,166 times more massive than all the humans.
Comparisons to other categories of life similarly demonstrate how very, very small we are. As a sweeping new study in the Proceedings of the National Academy of Sciences finds, in a census sorting all the life on Earth by weight (measured in gigatons of carbon, the signature element of life on Earth), we make up less than 1 percent of life.
There are an estimated 550 gigatons of carbon of life in the world. A gigaton is equal to a billion metric tons. A metric ton is 1,000 kilograms, or about 2,200 pounds.
We’re talking in huge, huge, mind-boggling terms here.
So, using the new data in PNAS, we tried to visualize the weight of all life on Earth to get a sense of the scale of it all.
All life on Earth, in one chart
What you’ll see below is a kind of tower of life. Each large block of this tower represents a gigaton of life, and the blocks are grouped into broad kingdoms. There are the protists (think microscopic life like amoebae), archaea (single-celled organisms somewhat similar to bacteria), fungi (mushrooms and other types of fungus), bacteria (you’re familiar with these, right?), plants, and animals.
As you can see, plants dominate our world. If the tower of life were an office building, plants would be the main tenants, taking up dozens of floors. Comparatively, all the animals in the world — seen in gray in the tower — are like a single retail shop (a trendy one, to be sure) on the ground floor.
And if we zoom in on all animal life, we again see how insignificant humans are compared to everyone else in the kingdom. Arthropods (insects) outweigh us by a factor of 17. Even the mollusks (think clams) weigh more.
What’s missing from this chart is just as important
Yet despite our small biomass among animals, we’ve had an overwhelmingly huge impact on the planet. The chart above represents a massive amount of life. But it doesn’t show what’s gone missing since the human population took off.
The authors of the PNAS article estimate that the mass of wild land mammals is seven times lower than it was before humans arrived (keep in mind it’s difficult to estimate the exact history of the number of animals on Earth). Similarly, marine mammals, including whales, are a fifth of the weight they used to be because we’ve hunted so many to near extinction.
And though plants are still the dominant form of life on Earth, the scientists suspect there used to be approximately twice as many of them — before humanity started clearing forests to make way for agriculture and our civilization.
The census in the PNAS paper isn’t perfect. Though remote sensing, satellites, and huge efforts to study the distribution of life in the ocean make it easier than ever to come up with estimates, the authors admit there’s still a lot of uncertainty. But we do need a baseline understanding of the distribution of life on Earth. Millions of acres of forests are still lost every year. Animals are going extinct 1,000 to 10,000 faster than you’d expect if no humans lived on Earth. Sixty percent of primate species, our closest relatives on the tree of life, are threatened with extinction.
I was given a lecture in Toronto to our institutional clients years ago and the central bank of Canada came with ten people. It was an interesting session because the audience began to ask me questions about what the central banks were looking at to make their decisions. I would answer and then the audience would immediately turn to see their response. It was a really fascinating session that turned me into this quasi-spokesperson for the central banks. I would respond and usually swat down these absurd theories one after another. The head of the Bank of Canada I knew well and the whole table was unbelievable poker-players. They never flinched nor did you get any read from any body language. When it was over, I went up to them and apologized saying I hoped I did not insult them in any way. They reply was astounding: “Marty, I only wish I could tell these fools we do not look at this stuff!”
People attribute the central banks will also sort of theories you would think they were the all-powerful demigods of finance. Decoding what a central bank says is very important. Yet I find all the commentary to be so off the mark it is laughable. The new word the Fed likes to use is its increasing reliance on “transitory” factors to explain the past six-year problem of being unable to reach the Fed’s 2% inflation target. They explain the failure with “transitory price changes” in some components such as health care and financial services. That was in their minutes from the May 1-2, 2018 meeting. When you look closely, price changes become “transitory” on the downside as well as “transitory” when they move on the upside. Indeed, they love to explain trends as “transitory” for that avoids any permanent trend forecast.
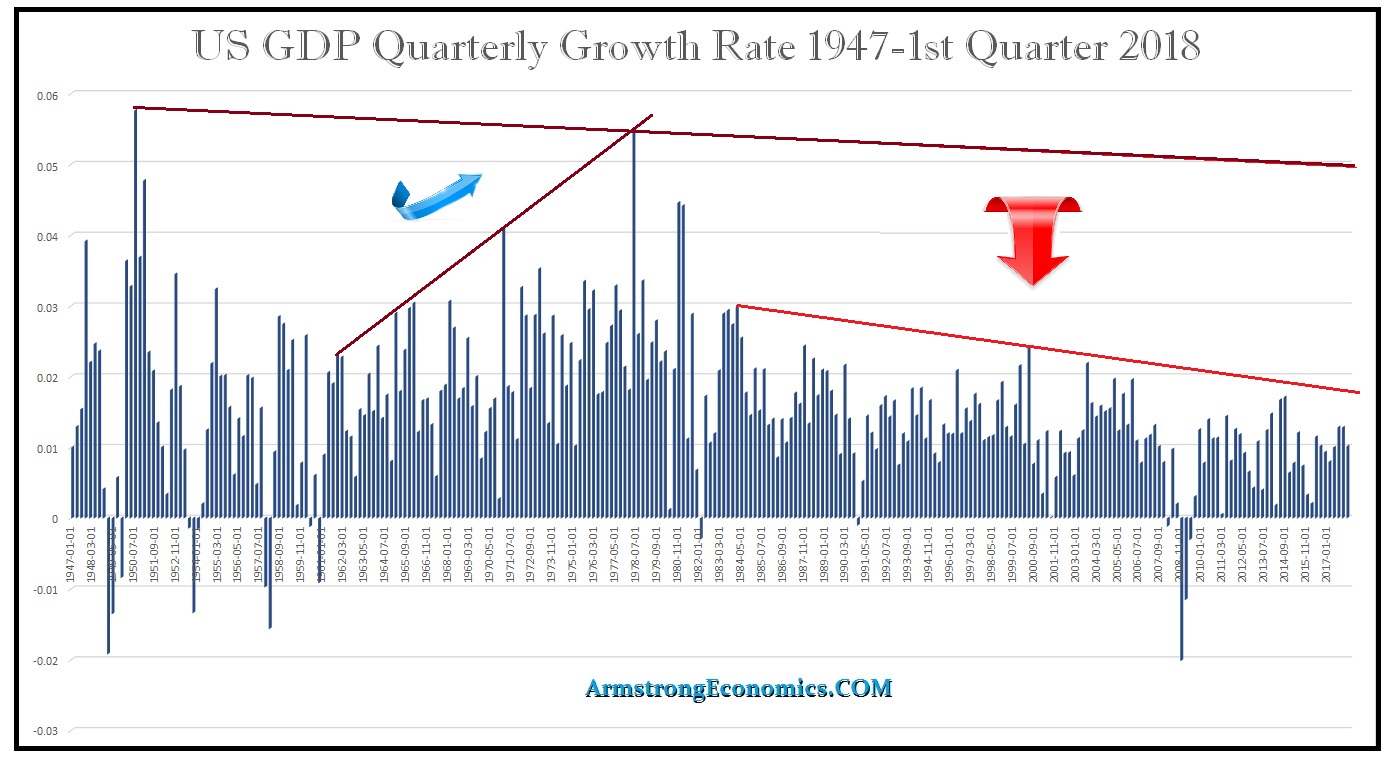
All of this is really just designed to be a distraction. It is the code word they love to explain the “IDK” factor (I don’t Know) because of the weakening business cycle. Step back and plot the growth rate using the Fed’s data since 1947. There was an economic boom between 1960 onward with the “feel good” election of JFK. That peaked in 1978 in nominal dollar terms because we moved to a floating exchange rate system in 1971. Then the dollar soared from 1980 when gold peaked into 1985 creating a massive wave of deflation. As two factors combined, the rise in the dollar and the rise in taxation under the Clintons/Obama, the growth rate has been progressively declining.
Trump sees the trend. His tariff policy is correct insofar as he is trying to address the decline in those areas. However, tariffs are one-sided. He looks at the loss of jobs yet ignores the rise in the standard of living by allowing the consumer to get the best price. If the workers in those areas cannot compete, then lower the taxes for the workers in those industries to enable competition. DO NOT force consumers to pay more for something to subsidize expensive labor. Nobody ever looks at that solution.
The Fed is clearly using code words like “normalize” interest rates BECAUSE they see the crisis brewing in pensions. They are BY NO MEANS raising interest rates because of inflation or expansion in the economy that risks a bubble. The Fed understands the crisis that has resulted from the manipulated low-interest rate policies. They cannot come out and explain the reason rates are rising because we have a pension crisis. So they have used the term “transitory” to explain both ups and downs and “normalize” to warn the marketplace it will continue to raise interest rates and pretend it is about some “transitory” factor you cannot nail down to a hardline explanation.
Re: Non-Farm Payrolls Blowout All Analysts Show USA is Still Holding Up the World
I am been following you for a number of years and believe you to be one of the best-informed analysts in the world.
However, your latest email concerning the gobbledygook reported by the BLS for May’s unemployment figures really has me concerned.
Surely you don’t believe these feel-good statistics which are nothing more than manipulation of the “officially employed” versus “those not in the workforce.”
I believe you are sincere in your analysis but this information is highly suspect.
Would very much like to hear your comments on the subject.
Respectfully,
JLS
P.S. By the way I think you would agree that it is the coordination by the Central Banks which is holding up the World not the USA !
ANSWER: There is job creation taking place, however, the index has been manipulated as has just about everything else. The economic growth is half that of a decade ago and from that perspective, we are in a declining mode overall into 2020. That said, the US economy is holding up the world right now, not the central banks. The ECB is keeping not the European economy up, but it has been keeping the governments on life-support.
The Fed has been fighting to even reach its 2% goal for inflation. The problem with deflation is that people will NOT spend wildly when their homes are still below what they paid or at break-even throughout most of the country. The money centers have risen for the high-end because of the foreign money pouring in. The IRS demanded that the real owner of real estate be revealed by the Title Company at closing but this has been limited to New York City and Miami.
The USA is holding up the world BECAUSE the capital flight has been to the USA both from China and from Europe. The central banks are in serious trouble outside the USA. The ECB can actually go bankrupt. Don’t forget, the EU does not issue its own debt. It depends on revenue from the member states. They have already demanded more money from everyone to make up the shortfall from BREXIT.
With respect to the unemployment numbers, of course, they have been manipulated so that if you give up looking, you are not unemployed. Nevertheless, the market responds to that number REGARDLESS of the change in the formula. I can say the top multinational corporate clients we have are all bringing the money home under Trump. Trump’s tax reform is putting pressure on states who have abused their citizens the most like California, New York, New Jersey, Connecticut, and Illinois in particular. There is a net migration out of these states all because of taxes.
So it is all relative. Jobs are being created because of the capital flow and lower taxes. This is putting pressure on the rest of the world as well
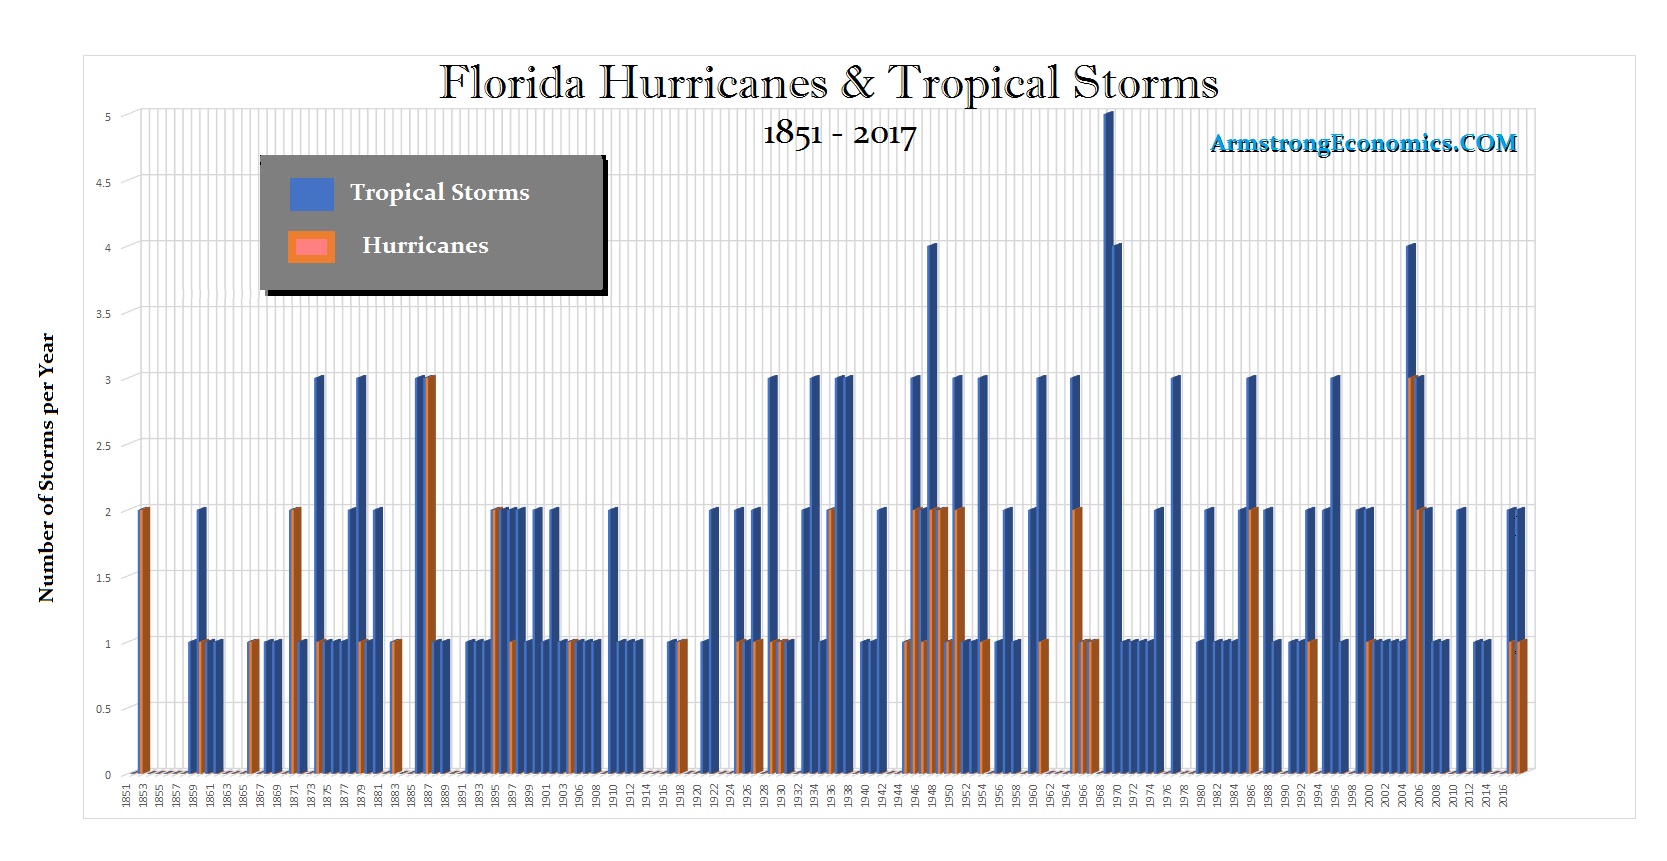
QUESTION: Mr. Armstrong; Did you run a model on Florida hurricanes before you moved there?
KE
ANSWER: Of course. First of all, I chose Tampa area because it is the least impacted area. The local joke here is that the people say the Indian gods protect the area. This is where the Seminole Indians set up. They apparently also figured out this was the least impacted area. Nevertheless, I also ran models on tropical storms and hurricanes for Florida as a whole. The data I found went back to 1851. There have been 53 hurricanes since then into 2017. Divide that out to see what the average is and you get 3.132. Pretty close to Pi. This is just hurricanes excluding the lesser tropical storms.
If I include the 200 tropical storms since 1851 into 2017, the average comes out to about half Pi – 1.524. Then you filer it all out with volatility and intensity, as we should be going into a period of more storms per year into 2020.
There will always be earthquakes, volcanoes, storms and all sorts of disasters around the world. Most of us will not be personally injured by such events. However, knowing where they take place more commonly allows you to avoid higher probabilities. So Tampa was simply far better than Miami, which is sinking gradually anyway and the traffic is way too much. I figured I would spend 20% of the balance of my life in traffic jams. No thanks! So disclosing the risks enables us to prepare wisely. It also interesting to see nature at its cyclical bes
I have created this site to help people have fun in the kitchen. I write about enjoying life both in and out of my kitchen. Life is short! Make the most of it and enjoy!
This is a library of News Events not reported by the Main Stream Media documenting & connecting the dots on How the Obama Marxist Liberal agenda is destroying America


/cdn.vox-cdn.com/uploads/chorus_asset/file/11418989/slice1.jpg)
/cdn.vox-cdn.com/uploads/chorus_asset/file/11418993/slice2.jpg)
/cdn.vox-cdn.com/uploads/chorus_asset/file/11442561/slice3.jpg)
/cdn.vox-cdn.com/uploads/chorus_asset/file/11442563/slice4.jpg)