Fertilizer Inflation Contributing to Higher Food Prices


Armstrong Economics Blog/Inflation Re-Posted Dec 31, 2021 by Martin Armstrong

Food prices are expected to rise going into 2022, and one major contributing factor is the rising price of fertilizer. The American Farm Bureau Federation stated that all nutrients had risen dramatically in cost over the last year:  ammonia has increased over 210%; liquid nitrogen has increased over 159%; urea is up 155%; MAP has increased 125%; DAP is up over 100%, and potash has risen above 134%. This does not include the growing cost of transportation.

Due to growing global demand, the US exports 44% of all fertilizer materials made domestically. Six specific crops generate two-thirds of fertilizer demand: corn (16%), wheat (15%), rice (14%), vegetables (9%), fruits (7%), and soybeans (5%). In the US, corn requires 49% of all fertilizer, with wheat accounting for 11% and soybeans 10%.

The American Farm Bureau Federation expects demand and prices to remain high into the spring season. As a result, farmers are increasingly shifting to crops that require less fertilization. The prices for these nutrients are so high that many farmers will be lucky to break even on costs. As always, these costs will be passed on to the consumer. Expect foods, especially those requiring a higher level of fertilization, to go up in the new year.

An Example of Field to Fork Inflation


Posted originally on the conservative tree house on December 30, 2021 | Sundance | 299 Comments

Here’s a solid example of what “field to fork” inflation is all about.   Two images shared today point out how the farmland inflation originates, and how the farmland inflation surfaces in your life.

The first image (pictured right) is a current price reference point for crop fertilizer [Source] from the perspective of the farmer preparing.

To go into the deep weeds behind what is causing this massive jump in price, you can review THIS ARTICLE.

[…] “Compared to September 2020 prices, ammonia has increased over 210%, liquid nitrogen has increased over 159%, urea is up 155%, and MAP has increased 125%, while DAP is up over 100% and potash has risen above 134%.”

Those fertilizer component products are used for corn, wheat and soybeans crops.

[…] “Corn represents about 49% of the share of U.S. nutrient use, while wheat accounts for about 11% and soybeans account for 10%. Cumulatively, those three crops account for about 70% of U.S. fertilizer consumption.” {link}

Now, you might say those crops do not seem like they are that important.  However, keep in mind that Corn, Wheat and Soybeans represent the baseline for not only grain production in the U.S, but they are also the primary feed products for proteins: chicken, pork and beef.

Worse yet, both grain and protein are the primary ingredients in pet foods; so pet food producers end up collecting even more price increases in their manufacturing. Have you noticed a shortage of pet food on your shopping trips?

When fertilizer goes up that high in price, the end cost of that harvest goes up in price, along with the end price of everything the harvest is used for.

So now we get to the point in the supply chain where these protein price increases show up to the average consumer.

This restaurant menu was shared with CTH today and reflects how the owners of this specific dining establishment are having to cope with the price of chicken from their wholesale supplier.  This example shows just how rapidly -and unpredictably- the price increases are hitting the restaurant industry.

Yes, chicken wings are now CURRENTLY falling under “market price.”

This is the fork side of “field to fork” inflation, and the chicken wing price represents the outcome of a total supply chain under extreme inflationary pressure.

Keep in mind, what the farmer was sharing on Facebook, about the price of fertilizer and weed killer, are prices for the ‘next’ harvest, not the one he/she has already completed.   The origin of the next harvest starts with components at prices 100 to 150 percent higher than the previous harvest.

Grain silos already loaded are carrying higher prices for the next several months, as the product flows through the supply chain and is used in the food production and feed of current ancillary users (manufacturers and protein providers).  However, those prices are on the previous cost of production.  When those grain silos need to be refilled, the next inbound harvest will have even higher costs.

When the current field inflation cumulates through the supply chain, the outcome will carry a price increase even higher than current.

I’ll bet there are a lot of restaurants visiting print shops to order new menus right now.  By the time we get to Superbowl Sunday, the price of ¹chicken wings is going to bring sticker shock to those who have not prepared.

Last point….  If you’ve been wondering why there’s such a massive push from the communists toward “plant-based proteins“, and even meat grown in laboratories, this outcome is part of the reason.  The climate change agenda -writ large- makes the traditional food supply skyrocket in price to unsustainable levels.  The professional leftists have been using the Overton window to nudge people into accepting an entirely new diet.

[Same group pushing ‘tiny houses‘]

#Let’s Go Brandon.

.

[NOTE: ¹More chicken wings are purchased in the days leading up to the Superbowl than any other time of year.]

India into 2022


Armstrong Economics Blog/India Re-Posted Dec 30, 2021 by Martin Armstrong

India’s Home Minister Amit Shah believes that his nation is on track to become the fastest-growing economy in 2022. India just experienced an 8.4% rise in GDP during Q3 compared with the year prior. Asia’s third-largest economy seems to be growing faster than many other nations; however, inflation and labor woes are hurting growth.

Inflation soared 14.3% in November after months of double-digit increases. Urban unemployment is around 9%, according to the Centre for Monitoring Indian Economy, which noted that the poor are experiencing the effects of inflation most significantly.

Private consumption in India in Q2 was 7.7% less than the same timeframe in 2019 and 2020. Demand has waned from the lowest earners as they are simply struggling to survive. Aljazeera noted that India’s micro, small, and medium enterprises (MSMEs) compose 30% of GDP, represent 50% of exports, and 95% of manufacturing. Due to COVID, 9% of MSMEs have shut down. That number is likely to rise as thousands reported earlier in the year that they would need to scale down or shut down before 2022.

The government supported a rural job program as highly desired employment in the larger cities is scarce. The program developed was designed to guarantee workers 100 days of paid work, but the annual budget ran out of funds only seven months into India’s fiscal year. Sabyasachi Kar, RBI Chair at the Institute of Economic Growth, has stated that this problem is not novel as India has failed to create enough manufacturing jobs. Instead, MSMEs remain the staple of India’s workforce, employing nearly 110 million people.

Other countries are keen to trade with India, and they certainly have promise for advancement. India successfully moved away from its agriculture-based economy over the last two decades and earned its place as the sixth-largest economy in the world.

Economic Confidence on the Decline


Armstron Economics Blog/Economics Re-Posted Dec 30, 2021 by Martin Armstrong

Americans have lost faith in the economy after a year of runaway inflation and incompetent leadership. The Economic Confidence Index (ECI) fell to -33 last week, similar to levels seen during April 2020 when the world economy went on a hiatus. With inflation running at its highest level since 1982, it is no wonder that the public has lost confidence in the government’s ability to handle the economy. Even President Biden recently told the public that there is no solution at a federal level to combat the effects of covid.

About 67% of respondents said that the economy is worsening. Around 29% said that the economy was their greatest concern, and among them, 11% cited general concerns, 6% cited employment constraints, and 2% cited class differences. Around 21% said poor government leadership was of utmost concern and 13% noted the ongoing coronavirus. Gallup stated that 40% of Americans would rate the economy as “fair,” while 42% feel it is “poor.”

“As 2021 comes to a close, morale is low in the U.S. COVID-19 continues to rage on, perceptions of the U.S. economy have worsened, Biden’s job approval rating is slumping, and Americans’ overall satisfaction with the direction of the country is low,” the report concluded. “Six months ago, the public was much more optimistic, but the delta and omicron variants of COVID-19, supply chain problems and rising inflation have dampened spirits.”

This is how the pendulum swings from public to private waves.

On Economic Consequences, No One Really Knows What Is About to Happen…


Posted originally on the conservative tree house on December 29, 2021 | Sundance | 219 Comments

On economic matters, no one really knows what is about to happen, with one possible exception.  It is demonstrably certain inflation into 2022 will continue increasing.  Beyond that, after pumping $9+ trillion into the U.S. economic system under the guise of COVID relief, we are entering some very uncharted waters.

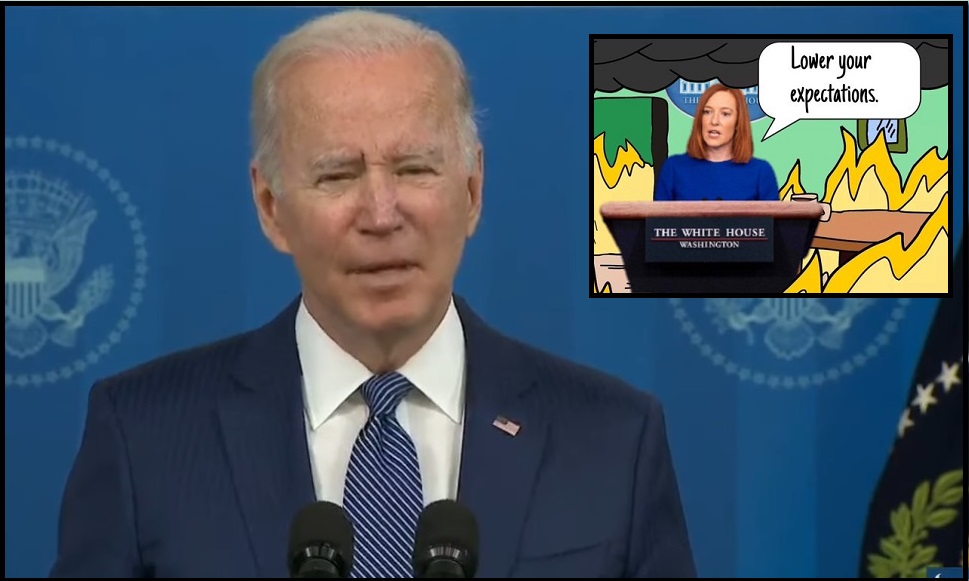
On a macro level, CTH has an idea what is likely to take place in the next three years; however, before getting to that, allow me to present evidence for the underlying supposition.   As you can see from this Biden message, shaped entirely by politics, on an economic basis the people around him have no idea what the downstream consequences of 2020 and 2021 will present in 2022:

The team behind Joe Biden brag about the U.S. economy being the only economy to continue growing during the COVID-19 pandemic period.  Their top line reference point is the Gross Domestic Product, or GDP.  Their brag is the U.S. GDP did not shrink during 2021 and the COVID pandemic.

However, what they omit (for political reasons) is that massive U.S. spending and bailouts covered the GDP hole.  More than $9 trillion was injected for stimulus payments, blue state bailouts, payroll protection programs, rent moratoriums, school subsidies, medical payments to hospitals, student loan payment pauses, vaccination purchases, covid sick pay and years of continually extended and enhanced unemployment benefits.

They also omit that none of this domestic spending would be possible if the global trade currency did not take place in dollars.  Our value is propped up by the fact that almost all trade takes place in U.S. currency.   If that system was not in place, congress could not spend this much money without collapsing the U.S. into a devaluation position resembling what happened previously in Greece.

The only way for Biden to avoid the direct economic consequence of this massive injection of $9+ trillion, which has created the illusion of a strong GDP by subsidizing consumer spending, is to keep injecting more money to keep the artificial GDP inflated.

Biden really needs congress to keep spending.  However, it now looks like congress does not have an appetite to do this….. so, the consequences are coming.

The prior spending covered a hole created by a drop in total economic activity.  Outputs dropped, payrolls dropped, consumer spending would have dropped, etc.  In essence, the void in economic activity was subsidized on a massive scale by government.

The U.S. economy was essentially a $20 trillion GDP going into the pandemic period.   Think of the GDP as total value.  We do not know what the total contraction on the economy was due to the first subsidy; but we do know the aggregate response over the past two years has been to subsidize -or cover- the contraction with a $9 trillion blanket.

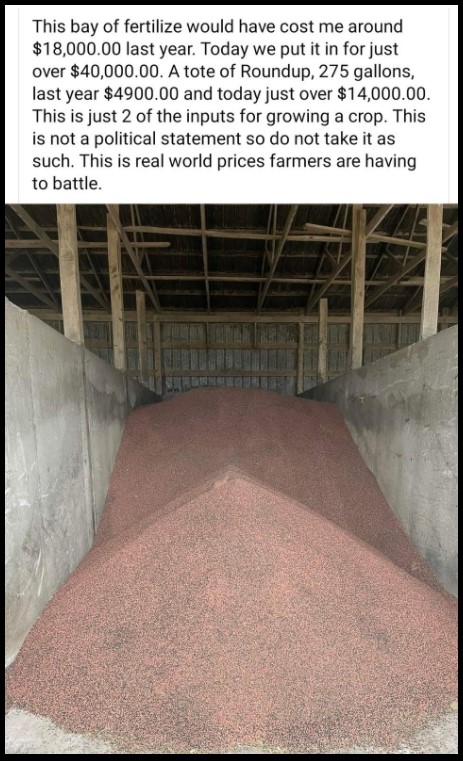
That $9 trillion in artificial GDP value is the most direct cause of inflation.  There are other aspects related to energy policy making products more expensive (energy, gas, fuel, transportation, heating, cooling, etc), but the $9 trillion artificial spend is the largest factor of current inflation.

These two figures will become important moving forward.  A $20 trillion natural economy, and $9 trillion in unnatural spending to maintain it.

In our economic studies, CTH has assembled a reference library from which we can draw guidance.  The 2008 and 2009 bailout phase [TARP, auto-bailouts, American Recovery and Reinvestment Act (ARRA), QE1 and QE2 as well as the porkulous bill] provide some reference points for long term outlooks.

There is a general investing guideline consisting of a factor of seven.  Seven years to double money, seven years to recover investment, seven years of depreciation etc.  The number seven shows up in multiple macro-economic reference points.  Seven is also represented by an approximate of 13%.

Spending at the level of 25% of our GDP (over two years) creates an inflationary pressure point of a similar size.  Two years at 13% is 26% inflation.  In real terms, that’s roughly where we are right now – we are somewhere in the 25% range in higher prices on goods overall.  That aligns with the spending subsidy inside the U.S. economy.

If my review of the ’08/’09 spending impact is accurate as an overlay, it means our natural economic cycle will take roughly four years to make parity between real wage incomes and the inflation rate.  It will take us four years to grow wages enough to cover for all this spending. Meaning, in four years the level of overall wages will be enough to finally catch the inflation currently recorded in the price of goods.

However, the problem arises in the near future.  Without that $9 trillion spent, our GDP would have contracted.  We now need to work through the value of that contraction in the economy.  We need wages to rise to compensate for inflation; but unfortunately, we are about to enter a phase where employment is likely to contract.

Two-thirds of the U.S. GDP is created by consumer spending.  Inflation, created by prior spending, is chewing up current wages and incomes.  As a consequence, disposable income is wiped out.  Consumer spending on non-essential products and services (luxury stuff) is essentially gone.  That reality is going to lead to a natural drop in employment as non-essential goods and services are no longer in demand.

We covered the prior point where the drop in demand for less essential products would have happened with government spending.  That subsidy is now drying up, and the hole we avoided is now in front of us.  All of the people who work in the economic process of providing ‘less-essential‘ goods and services will now likely see lay-offs.

This could potentially set us on a collision course.  If the employment condition worsens, there will be no need for upward pressure on wages.  At the same time, wage pressure decreases the inflation pressure remains high.  This dynamic means it takes even longer than four years to cover the hole of the previous spending.

We have talked about the predictable consequences of this dynamic for approximately eight months.  Some of the data is now beginning to surface to support exactly what we were discussing last year.   All of the artificial spending is drying up, and now the inflationary bills (chickens) are coming home to roost.

Each spike on the WolfStreet graphic below is government COVID spending.  Massive influxes of artificial payments into the economy.  The first spike is the Paycheck Protection Plan and initial economic bailout.  The second spike was the second covid relief bill, and the third spike (the tallest) was the soon followed even larger covid relief bill.

The WolfStreet analysis shows how inflation is much higher than wage growth {DATA HERE}.   Those spikes represent approximately $4.5 trillion in spending – subsidy infusions into the U.S. employer and employee workforce.

Inflation will continue chewing up wages through next year.  However, it can readily be expected that total employment will start getting a lot more tenuous as consumers/workers hunker down and prioritize spending on higher priced housing, food, energy and fuel.

Auto Manufacturers Compete to Create EVs


Armstrong Economics Blog/Technology Re-Posted Dec 27, 2021 by Martin Armstrong

As gas prices soar, the plan to switch to electric vehicles (EVs) seems more appealing to the average consumer. The US will now require auto manufacturers to meet a fleetwide average of 55 miles per gallon (mpg) by 2026, which is up from the 43 mpg standard set by Trump. The current standard for 2021 models is 40 mpg.

The Environmental Protection Agency is saying that moving to EVs can save owners between $210 and $420 billion through 2050, and owners will save an average of $1,000 per year.

A lobbying group is calling the Alliance for Automotive Innovation is calling for federal support to meet the new requirement, stating that the industry will not be able to meet the criteria without government funds. The infrastructure bill passed earlier in the year will allow more funding for public charging stations.

Others in the industry are claiming that automakers must conform to EVs to stay competitive. Tesla’s growth has been widely praised. GM is releasing two new electric cars and will begin producing the GMC Hummer EV next fall. BMW plans to unveil an all-electric M badge car. Jaguar Land Rover noted it would test a hydrogen fuel-cell prototype. Mercedes plans to manufacture ten new models of EVs by the end of next year. Ford, Nissan, and Mazda will join in on the action too. The list goes on and on.

Electric vehicles only account for 3% to 4% of cars on the road in the US. Still, that percentage will rise in the coming years as EVs become more affordable to the average consumer and companies continue to develop the technology.

Canada Looks to Ban Foreign Home Ownership


Armstrong Economics Blog/Real Estate Re-Posted Dec 27, 2021 by Martin Armstrong

Canadian Federal Housing Minister Ahmed Hussen addressed the housing shortage in many of Canada’s provinces by stating that he would like to limit passive foreign investment. Furthermore, Hussen stated that he would support implementing density measures, as New Zealand did, to allow builders to create up to three homes on a single-family lot. “Any measure that increases the housing supply, that intensifies the use of land, that builds more housing and that frees up more housing on the same amount of land, is a good thing,” Hussen added.

Hussen did not provide details on what his foreign buyer ban would entail, but Trudeau did make similar promises after winning his third term in September. The 1% tax on vacant foreign-owned land and housing begins on January 1. The Liberal Party is touting a tax-free down-payment savings program for first-time homebuyers as well as rent-to-own programs. Both measures would cost Canadian taxpayers C$4.2 billion in the next four years.

Canada is also considering placing a ban on house flipping in what they believe is an effort to cool housing prices. The problem comes when they put in punitive laws that become permanent because of a trend based entirely upon currency. Foreign, mainly Chinese, buyers see Canadian real estate as a safe place to park assets. Their profits seem amplified when converting the currency. The measures the Liberal government plan to take could cause capital flows to diminish once investors no longer see real estate as a safe haven. Once the government imposes the tax, you can bet it will rise rapidly from 1% because there is a complete misunderstanding of what is driving the real estate markets.

US Inflation Soars to 39-Year High


Armstrong Economics Blog/Inflation Re-Posted Dec 27, 2021 by Martin Armstrong

Powell’s decision to retire the word “transitory” when discussing inflation was too little, too late. The Bureau of Economic Analysis (BEA) reported that US inflation soared 5.7% in November on an annual basis, marking a 0.5% rise from October. The gauge has not reached this level since 1982. Eliminating food and energy from the equation, prices rose 4.7%, which still marks the most significant increase since September 1983.

The BEA noted that consumers are spending more on essentials. The Biden Administration touts rising wages without understanding that this is contributing to the wage-price spiral. Employers are paying their employees more to keep up with the cost of living. Costs go up for businesses and therefore go up for the consumer.

Expect the Fed to finally take a hawkish approach in 2022.

The Sovereign Debt Crisis Arrives


Armstrong Economics Blog/Sovereign Debt Crisis Re-Posted Dec 26, 2021 by Martin Armstrong

While the world is turning, the economic crisis emanating from the SovereignDebt Crisis in Europe is propelling a very serious outlook as we head into 2022. I have been warning for the past 10 years that the situation would become critical. I have attended meetings with many central banks over this period warning that governments cannot continue to borrow perpetually with no intention of repaying what they borrow.

The Day of reckoning is arriving. They have been using this COVID-19 whipping it up into a panic for the shear purpose to bring us to the point where their solution will be to default disguised as a solution for the poeple. I will report on the real state of the world financial system and it may be shocking for most. This is not a question of simple hyperinflation for that even implies that the currency survives, The real outlook is far from the claims of the pundits that keep pitching the same story for decades since the collapse of Bretton Woods. Those in power are already running stories that there will be an armed revolution if Trump does not win in 2024, It would be nice if we even have that long before political chaos upsets the financial system.

There will NEVER be a return to normal. These people have divided the people on race and politics and the key to civilization has always been that people come together when they ALL benefit. Civilization collapses when you divide the people, and turn one group against the other.

Rental Costs on the Rise Amid Diminished Supply


Armstrong Economics Blog/Real Estate Re-Posted Dec 23, 2021 by Martin Armstrong

Demand for rentals in the US is increasing at an alarming pace. Single-family rentals rose 10.9% in October year-over-year, according to a report by CoreLogic. There are simply not enough rental properties available to meet demand. Vacancy rates are at a 25-year low as those priced out of the buyer’s market search for housing.

Rentals in every price range are on the rise. The lower-priced homes that represent 75% or less the regional median rose 9.5%. Lower-middle priced homes that represent 75% to 100% of the regional median are up 10.1%. Higher-middle priced homes representing 100% to 125% of the regional median are up 11.3%, while the highest-priced homes (125%+) advanced 11.4%.

On a regional basis, Miami saw the largest spike with rentals increasing 29.7% in the past year. Phoenix (19.3%) and Las Vegas (16.5%) also experienced notable increases. Thanks to Lori Lightfoot, Chicago experienced the lowest annual growth among larger cities at 4.2%.

The National Association of Home Builders stated that housing starts specifically for rental units reached a high in Q3. However, there is simply not enough available housing to meet the growing demand. Additionally, numerous landlords are also now converting their spaces in desirable areas to Air BnBs and vacation rentals, further diminishing the supply. As remote work becomes prominent in American culture, people are flocking to the suburbs and areas that were not designed to host a growing population.