Things to Look For…


Posted originally on the conservative tree house on January 8, 2022 | Sundance | 524 Comments

Things that seem disconnected, but ain’t.

(1) A shortage of processed potatoes (frozen specifically).

And/Or a shortage of the ancillary products that are derivates of, or normally include, potatoes.

(2) A larger than usual footprint of turkey in the supermarket (last line of protein).

(3) A noticeable increase in the price of citrus products.

(4) A sparse distribution of foodstuffs that rely on flavorings.

(5) The absence of non-seasonal products.

(6) Small to little price difference on the organic comparable (diff supply chain)

(7) Unusual country of origin for fresh product type.

(8) Absence of large container products

(9) Shortage of any ordinary but specific grain derivative item (ex. wheat crackers)

(10) Big brand shortage.

(11) Shortage of wet pet foods

(12) Shortage of complex blended products with multiple ingredients (soups etc)

(13) A consistent shortage of milk products and/or ancillaries.

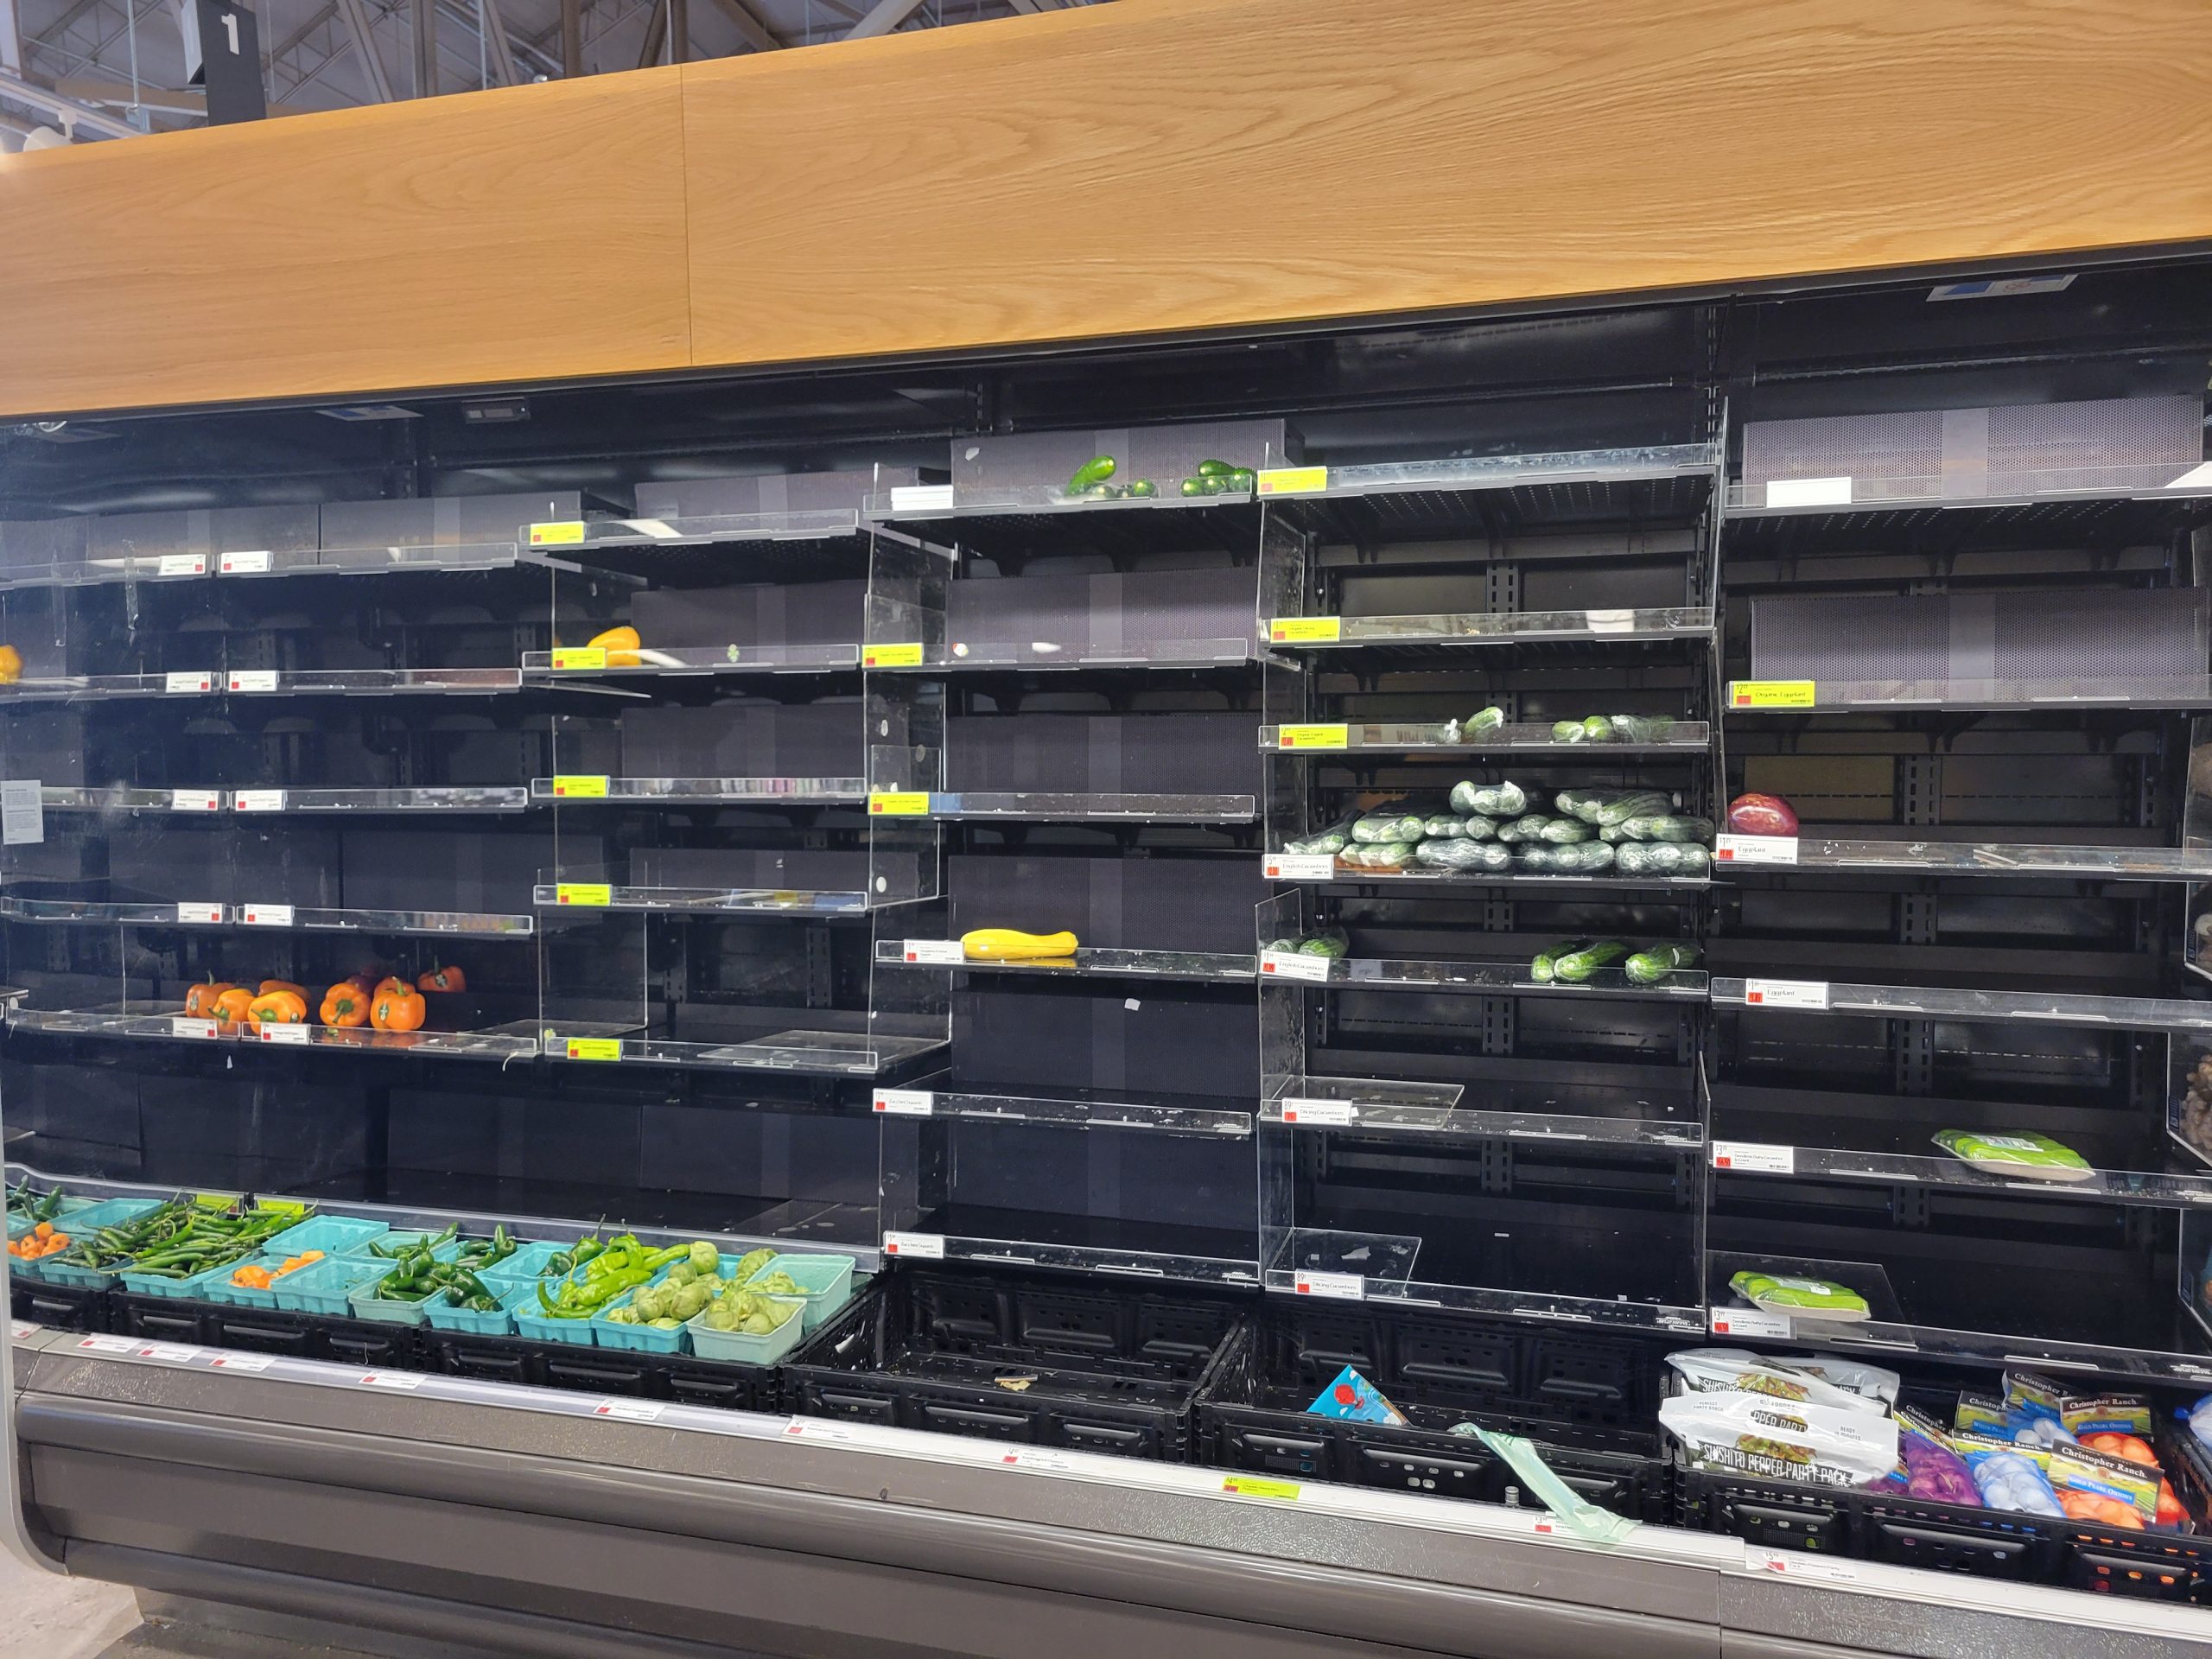
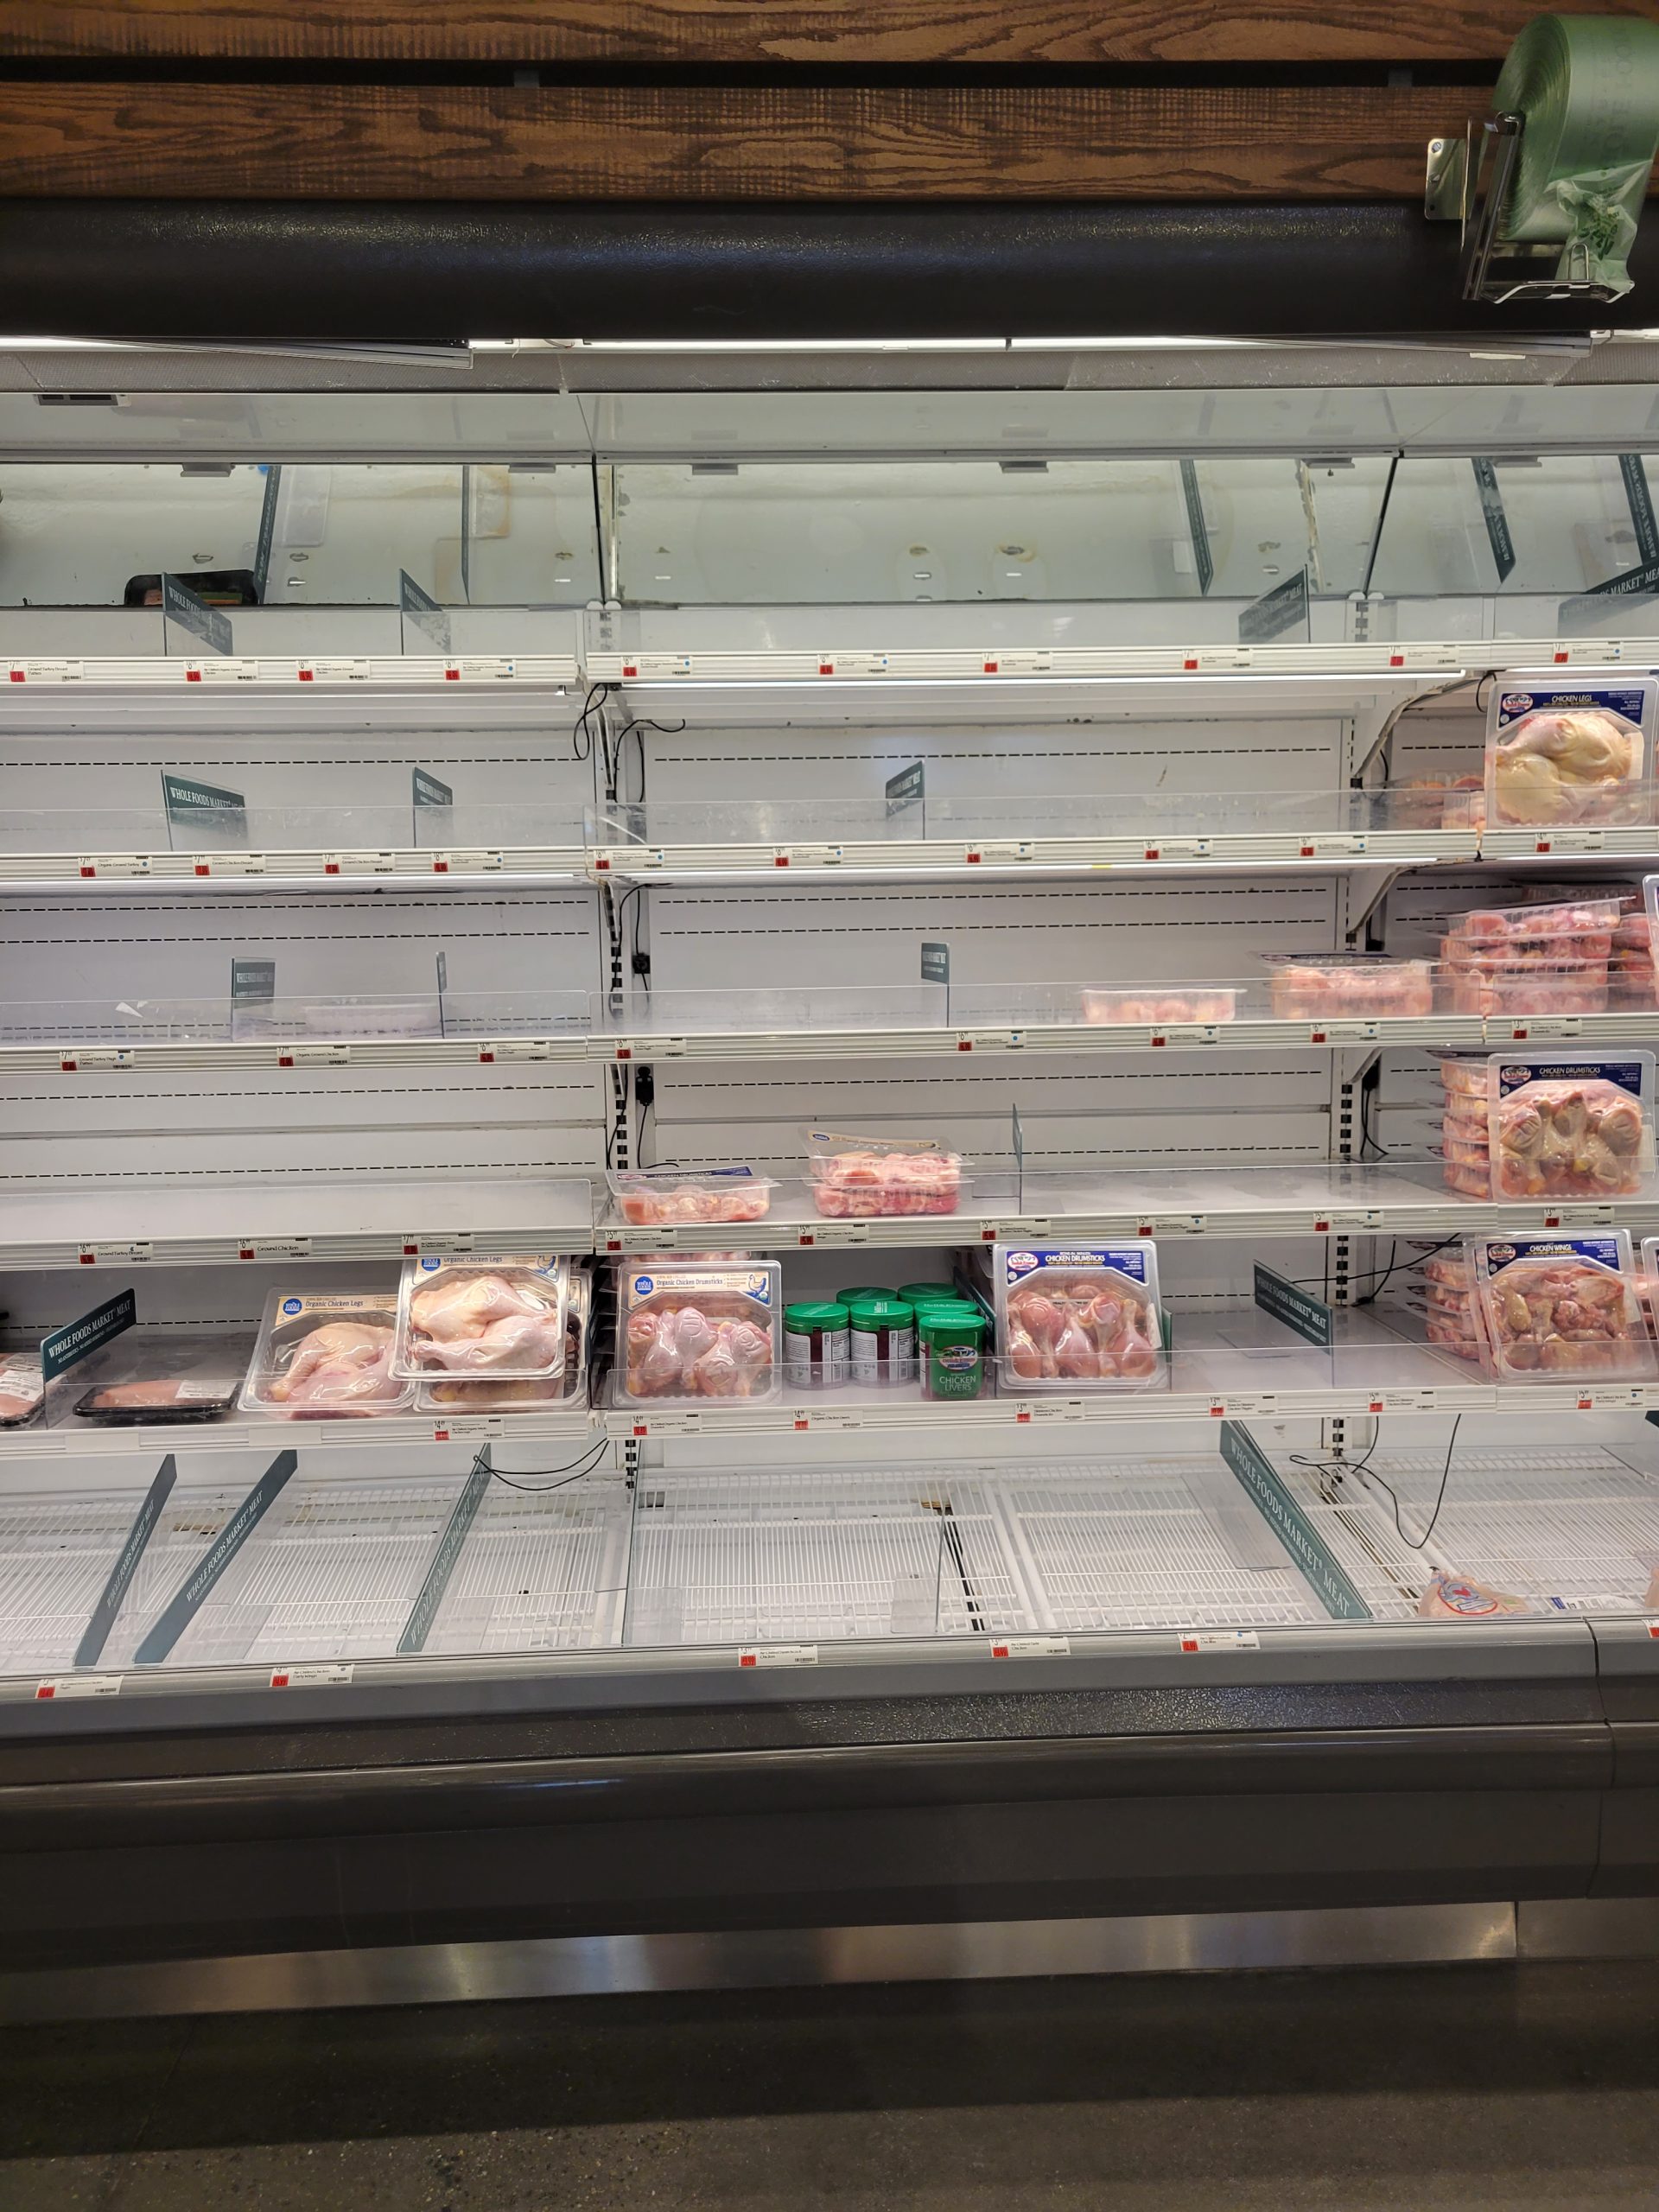
These notes above are all precursors that show significant stress in the supply chain.

At first, each retail operation will show varying degrees of the supply chain stress according to their size, purchasing power, and/or private manufacturing, transportation and distribution capacity.

Remember, the dairy farmers in 2020 dumping their milk because the commercial side of milk demand (schools, restaurants, bag milk purchasers) was forcibly locked down?   Plastic jugs were in short supply, and the processing side of the equation has a limited amount of operational capacity.

Potato farmers and fresh food suppliers were also told to dump, blade or plough-over their crops due to lack of commercial side demand.  These issues have longer term consequences than many would understand.  These are fresh crops, replenishment crops, which require time before harvest and production.

The retail consumer supply chain for manufactured and processed food products includes bulk storage to compensate for seasonality. As Agriculture Secretary Sonny Perdue noted in 2020, “There are over 800 commercial and public warehouses in the continental 48 states that store frozen products.”

Here is a snapshot of the food we had in storage at the end of February 2020: over 302 million pounds of frozen butter; 1.36 billion pounds of frozen cheese; 925 million pounds of frozen chicken; over 1 billion pounds of frozen fruit; nearly 2.04 billion pounds of frozen vegetables; 491 million pounds of frozen beef; and nearly 662 million pounds of frozen pork.

This bulk food storage is how the total U.S. consumer food supply ensures consistent availability even with weather impacts.  As a nation, we essentially stay one harvest ahead of demand by storing it and smoothing out any peak/valley shortfalls. There are a total of 175,642 commercial facilities involved in this supply chain across the country

The stored food supply is the originating resource for food manufacturers who process the ingredients into a variety of branded food products and distribute to your local supermarket. That bulk stored food, and the subsequent supply chain, is entirely separate from the fresh food supply chain used by restaurants, hotels, cafeterias etc.

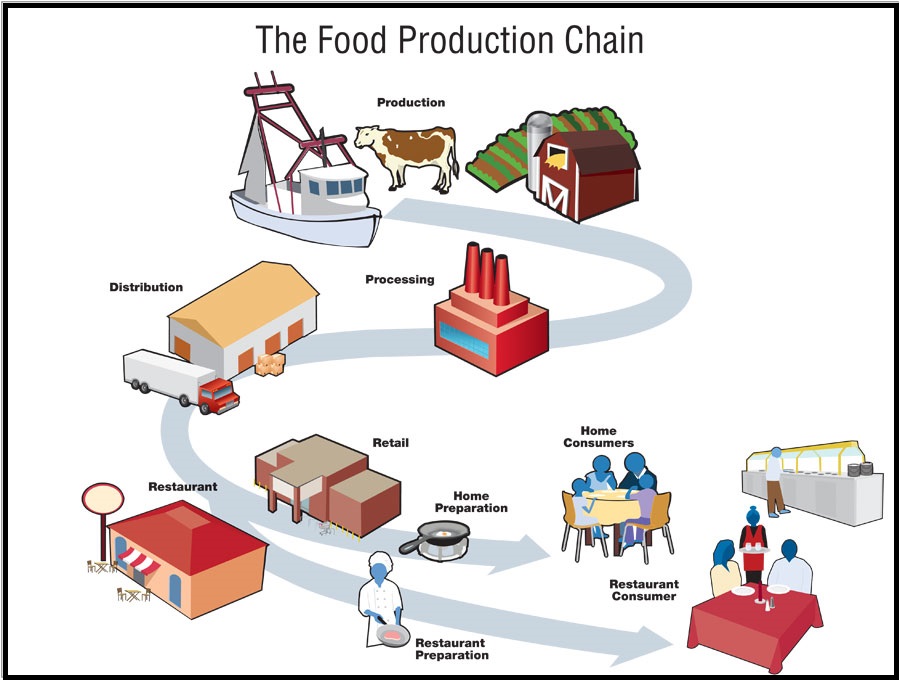
Look carefully at the graphic.  See the fork in the supply chain that separates “food at home (40%)” from “food away from home (60%)”?

Food ‘outside the home’ includes restaurants, fast food locales, schools, corporate cafeterias, university lunchrooms, manufacturing cafeterias, hotels, food trucks, park and amusement food sellers and many more. Many of those venues are not thought about when people evaluate the overall U.S. food delivery system; however, this network was approximately 60 percent of all food consumption on a daily basis.

The ‘food away from home‘ sector has its own supply chain. Very few restaurants and venues (cited above) purchase food products from retail grocery outlets. As a result of the coronavirus mitigation effort, the ‘food away from home’ sector was reduced by 75% of daily food delivery operations. However, people still needed to eat. That meant retail food outlets, grocers, saw sales increases of 25 to 50 percent, depending on the area.

Covid regulations destroyed this complex supply chain in 2020.  It takes time to recover because the replenishment is based on harvest cycles.  This stuff must be grown.

When the food at home sector was forced to take on the majority of food delivery, they immediately hit processing constraints.  The processing side of the supply chain to funnel food into suppliers for the grocery store has “x” amount of capacity.  That system cannot (not feasible) and did not expand to meet the 20 to 50% increase in demand.

Think about potatoes.  A potato farmer sells into one of the two paths “food at home” (retail stores, or a processing supplier) or “food away from home” (commercial food or commercial food processors).   Other than bulk raw potatoes, the harvest goes into: (1) processing or (2) storage.

(1a) processing for retail sales (40%), ex. Ore Ida frozen potatoes, canning, or any of the other thousand retail products that use potatoes, whole or mashed.

(1b) processing for commercial sales (60%), ex. McDonalds french fries, or any of the thousand restaurant, lunchroom and cafeteria needs that use potatoes, whole or mashed.

♦ Processing – When 1b was shut down in 2020, 1a quickly reached maximum retail processing capacity.  Massive multi-million machines and food processing systems have a capacity. The supplies they use also have a capacity: plastic bags, cardboard, trays, bowls, etc.  The 1a processing system can only generate “X” amount of retail product at maximum capacity.

The remaining 1b commercial product was shut down.  A massive percentage of 1b (commercial) potatoes have nowhere to go, except waste.

♦ Storage – Each processor in 1a stores product (deep cold or frozen storage) for 365-day processing and distribution.   Those storage facilities have a limited amount of capacity.   The 1b customers need fresh product for the majority of their outlets. Ergo storing for 1b customers who might eventually be allowed to open later only works for a short period of time.  The fresh potato sales missed by 1b outlets = the 1b discard by potato farmers.

When you restart 1b suddenly the 1b short-term (fresh) storage product is quickly depleted.  Refilling that 2020 storage is dependent on a new 2021 harvest, which simultaneously has a greater immediate demand because the supply chain on the processing side was boxcar’d (over capacity) and then reset to a higher capacity playing catchup.

The amount missing from 2021 storage, because it was used instead of saved, is essentially equal to the amount that was wasted in 2020.

Now you end 2021 will less reserves because storage is depleted, because a greater percentage of the current harvest was immediately used.  You enter into the beginning of 2022 (winter) in a race to try and spread out the stored potatoes as you cross your fingers and race against the clock for the next harvest before running out.

You probably noticed, but there’s another motive to keep people (employees) away from large industrial cafeterias and even students from school lunchrooms.   The total food supply chain needs time, and harvests, to catch up.

In the example above you can replace *potato* with just about any row crop or retail/commercial food commodity like milk.

The reason I list potato as the #1 precursor is because every food outlet sells a potato in some form.  Every supermarket and every single restaurant (fancy or fast food) sells some form of potato.   Potatoes are demanded by every single food outlet; therefore, a shortage of potatoes is the first noticeable issue.

The 2020 demand disruption problem now becomes a 2021/2022 supply chain problem on both the fresh and processing side (depleted inventories), with each vector now competing for the same raw material: wheat, soybeans, grains, beans and stored row crops.

Making matters worse, the protein suppliers also need grain as feed for cattle, pigs, cows, chickens, etc.

[Note: who gets the short straw? The pet food manufacturers]

That’s the nub of the background supply chain issue in the food sector.   Additionally, recovery is not a single-issue problem.

The recovery price and shortages relate to everything from current oil and gas prices to diesel engine oil prices, to fertilizer and weed killer costs, to plastic costs and petroleum packing shortages (Styrofoam especially), to cardboard and sustainable packaging costs, to energy costs and transportation/delivery costs.   All along this complex supply chain there’s also workers and higher payroll costs.

Thus, we get the double-edged sword of higher prices (inflation) and simultaneous shortages.

Here’s what you can do to offset shortages (while possible):

(1) Buy the generic or store brand equivalent (sub-set inside retail supply chain)

(2) Purchase the organic version (another sub-set inside retail supply chain)

(3) Purchase the powered/dehydrated version (potatoes, milk, etc) and experiment (jazz it up).

Each retail operation, or chain of stores, will show varying degrees of the supply chain stress according to their size, purchasing power, and/or private manufacturing, transportation and distribution capacity.

This is where field to fork supplier relationships can make a big difference.  However, every outlet regardless of their operational excellence, is going to have significant shortages in their inventory.   It’s an unavoidable outcome of the previous chaos.

On average the retail shortages will last for about the same time as one full harvest schedule (4 to 6 months) depending on the commodity.   By September of 2022 the sector should be relatively recovered, depending on how government responds when people get seriously stressed in a few weeks.

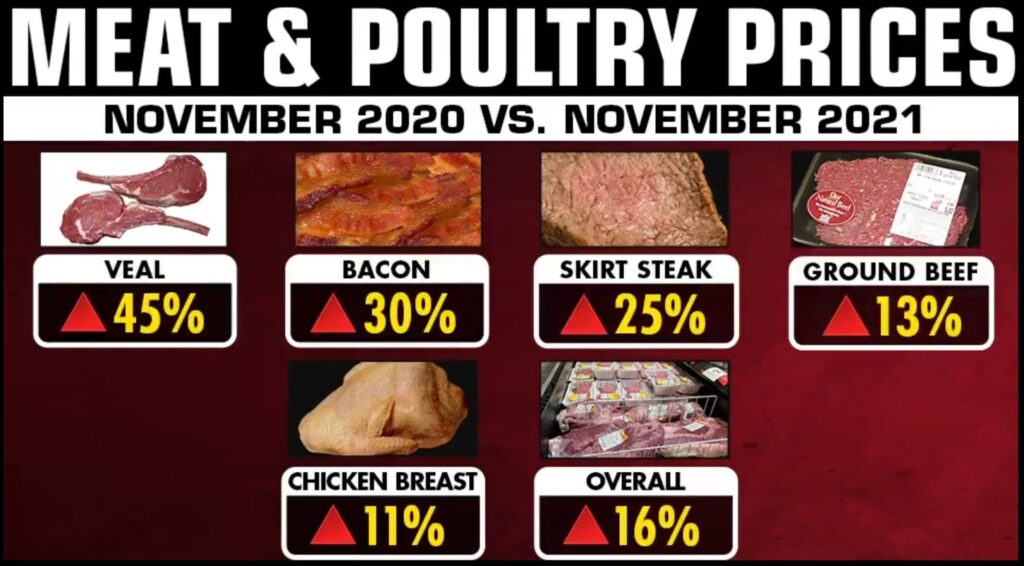
The short-term prices will likely go up again, another 10, 20 up to 50% depending on item.  Those prices will eventually level off, but it’s doubtful they will be able to come back down until supply and demand find some equilibrium again, if ever.  Right now, that’s too far off to even fathom.

We Have Less Than Two Weeks to Finalize Preparation


Posted originally on the conservative tree house on January 7, 2022 | sundance | 386 Comments

I do not know how better to emphasize the points other than to be direct and brutally honest.  Sometimes you just have to call the baby ugly.  The window to prepare for the incoming crisis of our lifetime is now down to two weeks.  Hopefully, that is specific enough.

As we have discussed on these pages, the interventionist policies and regulations from the people creating the COVID response (writ large) have been fubar from the beginning. {Go Deep} When they shut down the restaurants and hospitality sector (2020 lockdowns), the advisors and bureaucrats triggered a cascading series of events inside the food supply chain {Go Deep}.

Every policy implementation since then has made matters worse {Go Deep}

Adding to the supply chain and inflation crisis, in about a week the vaccine mandate and subsequent commercial passport means 30,000 cross border truckers are about to get shut down from operating between the United States and Canada.

70% of the 700 billion in trade between Canada and the US is moved by truck. This will have a dramatic effect on supplies and services reaching their destination and getting in the hands of those who need them. One needs to look no further than the recent UK fuel shortage, where the military had to be brought in to deliver fuel as a result of a lack of truck drivers. We are already seeing shortages, if these shortages reach critical levels on items such as fuel, food, blood, medicine or medical supplies, we will see real long-lasting damage.

~ Mike Milliam, President of the Private Motor Truck Council of Canada

As noted by those following the issue(s) closely: “Starting January 15th, 2022, truckers must show a proof of vaccine to cross the Canada/US borders. Since March 2020, drivers were considered “essential”. They could cross the border without a covid test or the vaccine. Under Biden/Trudeau administration, this is about to change”:

22 000 truckers are about to lose their job. But this estimate is from the Canadian Trucking Association. The Private Motor Truck Council of Canada (PMTC) estimated this number closer to 31 000 truckers.

We are looking at a meltdown of the supply chain, or at least some severe disruption.

Get everything you need now. Inflation is about to get real. (read more)

CTH readers are already well versed in the domestic side of this issue {Go Deep}.  When you overlay the USMCA aspect and recognize the critical sectors of the North American economy that are reliant upon each other; and when you realize that no one outside of the blue collar crews who have specific expertise in applying commonsense to this equation are talking about it, then you begin to realize what is obviously about to hit, and yet all will claim they never saw it coming.

We have approximately two weeks left.  After that, I genuinely do not know what things will look like…. but I do know it will not be good.  We are in very uncharted and unstable waters.

Act as if… or be acted upon.  Ultimately, this appears to be our choice right now.

If we are wrong, then we will breathe a sigh of relief.  However, if we are correct….

….. FUBAR!

December Jobs Report Shows 199,000 Gains, 400,000 Were Expected


Posted originally on the conservative tree house on January 7, 2022 | sundance | 112 Comments

The pundits are just not getting it.  It’s the inflation, stupid.

The Bureau of Labor and Statistics (BLS) released the December jobs report today [DATA HERE] showing 199,000 job gains in December, approximately half of what was expected.  Most financial pundits are perplexed as the employment rate drops to 3.9%, because many people have dropped out of the labor force.  The labor participation rate remains unchanged at 61.9%.

Keep in mind, the November jobs report showed a decline in retail jobs of 29,000, and this report shows that despite November & December being the largest shopping months for holidays, the retail sector jobs were nonexistent.

The issue is what we have discussed here for months, inflation.

The job quits and JOLT turnover reports from last week showed massive numbers of employees quitting their jobs.  In part this is pressure from the vaccine mandate (more on that later).  However, in the majority what we are seeing is employment decisions based on inflation hitting the labor market.

Additionally, the current BLS report does not have the Omicron “winter of death” employment impact within it.  That impact will come in the January report, and it will not be good.  But let’s get down to reconciling December jobs data with reality on the ground.

Inflation is chewing up income amid the workforce.  This is not debatable, and this is reflected in every opinion poll and economic statistic that has surfaced for the past six months.   The BLS report somewhat surprised people in the 0.6% wage gains, and average wage increases are now 4.7% year over year.  That should be a good thing.  However, inflation at 20 to 50+% on energy, fuel, gasoline and food means a 4.7% growth in wages is a pittance.

A nickel more for a dollar earned is futile against food store inflation at 20 to 40% average price increases.  We have never seen food, fuel and energy increase in price at such a rate and in such a short period of time (6 months).  That real price situation is not going to improve.  Economists call this “sticky” inflation, but that catch phrase does not adequately explain the foreboding issue of how damaging this is.

As this inflation relates to jobs and employment, the situation is obvious.  Pundits pretend not to know things, but the two issues are connected.  Ordinary workers need much higher wages to compensate for massive increases in housing costs, energy costs, gas prices and, more importantly, food prices.

The fastest way to get a quick pay increase to compensate for fast and furious inflation is to switch jobs and start the new job, in the same sector, at a higher wage.  That is what we are seeing with the overall turnover rate, quits report, and larger employment data.  They are all connected.

Beyond inflation, you can see from this BLS data that things are tenuous in the economy.   The November retail employment figure (-29,000) was a big red flag that everyone ignored.  Additionally, holiday sales at +8% when the prices are +15% or more, means that people were buying less stuff at higher prices.  Overall, less stuff (units sold) was purchased.

The December BLS data shows us actual hours worked in manufacturing declined (0.1 hrs), and overtime declined (0.1 hrs).  Remember, the third quarter productivity rate dropped a stunning 5% overall.

Big Picture = less stuff is in demand, less stuff is being made, and less hours are being used; however, the amount of available labor in the creation of durable goods still exceeds the demand for those durable goods, hence productivity has dropped.

Construction employment is modest at +22,000 in December, but it is lower than the prior three months average of +38,000. Some of this is seasonal, but the trendline is much softer than a customary 3.9% total unemployment economy would show. Again, more evidence of weakness in the structural economy (no pun intended).

Two-thirds of the U.S. economy overall is dependent on people buying stuff. When people cannot afford to buy stuff, because their disposable income has been wiped out by inflation, things in the data start to show the wobbly wheels of a tenuous economic train.

When the number of people quitting their jobs, or switching jobs, is twice the number of people getting officially hired in the BLS jobs report, then you know things are sketchy.

Let me repeat the issue and try to emphasize the problem. It’s the inflation, stupid.

We have a looming problem that does not reconcile with 3.9% unemployment.  The pundits are perplexed.

The confusion is because NO ECONOMIC data has ever shown this level of inflation in such a short period of time.   There are no models.  There is no experience in this situation.  This is not like the 1970’s where oil prices were the direct and primary cause.  This is different, because we are experiencing shortages and price increases specifically due to policy.

Energy policy is killing us (oil and natural gas prices).  Legislative policy is killing us (spending and bailouts).  Monetary policy is killing us (cheap lending, quantitative easing, devaluation).  All of this is causing massive inflation at a level we have never seen in history, and it’s on everything.

Then we throw in a vaccine mandate, and perpetual fear of a virus that hits both the demand side and the employment side simultaneously…. and, well, here you go.  The disruptions inside the economy are like deep cuts, thousands of them, and they are not accidental.

Many, if not most, of these disruptions are being done at the altar of climate change and the Green New Deal.

COVID-19 mitigation and mandates only make this worse.

The disruptions in the supply chain are a direct result of policy.  Now, we have to prepare for inflation AND shortages.  This will not get better in 2022.

Prepare your family accordingly.  I believe those of you reading this article represent the people best prepared for what is about to happen.

Winter Weather Exacerbates Supply Chain Crisis


Armstrong Economics Blog/North America Re-Posted Jan 6, 2022 by Martin Armstrong

Comment: This is a Whole Foods in a high to middle income suburb in the northeast on January 4, 2022. I live near numerous ports from NJ, PA, to NY. I have lived here my whole life and have never seen the aisles this bare. When corona began the essentials were missing from shelves but now they are completely bare. Did JB completely ruin America?

Reply: The snowfall in the north has only exacerbated the supply chain and food crisis. The ports up north are not what they once were, and perhaps I will elaborate on that in a separate post. Regardless, the shelves should never appear that empty. I too lived in the north for many years, and even amid snowstorms, there was more food available than what I am seeing in your pictures.

It is a global problem, but the Biden Administration is undoubtedly making matters worse. Forced vaccinationstrucker/labor shortagesinflation denial, and increased shipping costs are all contributing to the diminished supply of available goods. Additionally, farmers in the US (and elsewhere) noted that food prices will rise in 2022. Unfortunately, 40% of our exports come in from California, where Governor Newsom has imposed laws to ensure a depleted supply chain for the rest of the country.

Winter weather is now coming into play as a new variable exacerbating the supply chain. As I warned years ago, stock up while you can.

Another 370,000 Workers Quit in November, Total Quits Rate Now 4.5 Million


Posted originally on the conservative tree house on January 4, 2022 | Sundance | 378 Comments

The Bureau of Labor Statistics (BLS) released the November job openings and turnover data today [DATA HERE] showing 370,000 workers quit their jobs in November bringing the quits rate now to 4.5 million people.

From the report, “Quits increased in several industries with the largest increases in accommodation and food services (+159,000); health care and social assistance (+52,000); and transportation, warehousing, and utilities (+33,000).”

Over the 12 months ending in November 2021, hires totaled 74.5 million and separations totaled 68.7 million, yielding a net employment gain of 5.9 million for 2021. However, while the unemployment rate drops with fewer people working, the employment picture overall appears to be tenuous.

The FRED personal savings rate for Americans overall [DATA HERE] has been dropping rapidly since March 2021, the last federal COVID employment bailout injection. All of the federal assistance has created massive data skews in the savings rate, as federal subsidies gave an artificial boost to the U.S. savings rate.

It appears that the aggregate American worker is now using their savings, created by COVID bailouts, to offset the massive inflation created by the COVID bailouts.  The net result is a workforce going into negative savings each month as inflation driven expenses (energy, fuel, food) are higher than earnings.  This is an unsustainable situation.

There is obviously a large retirement factor in the quits rate; however, it does appear the vaccination mandate is also a major influence. Additionally, when talking about people living paycheck-to-paycheck, rapid inflation almost always causes job-jumping for workers to get higher wages.

According to the BLS data, in November the job openings rate decreased in small establishments with 10-49 employees. This could be due to employees returning to small business, and/or there are fewer small businesses around to be hiring.

The hires rate rate increased in very large employers with 5,000 or more employees. However, the quits rate increased in both small businesses with 1-9 employees and in medium-sized businesses (1,000 to 4,999 employees). The I9 contracted workers are also leaving small and mid-size employers.

Then comes a significant aspect, “both the layoffs and discharges rate -and the total separations rate- increased in the larger establishments with 1,000 to 4,999 employees.” This could indicate mid-sized businesses are starting to see contractions in sales or demand and lowering their payrolls. This outlook would match the productivity drops we noted last month.

(DECEMBER CTH) – “The value of all products and services generated increased by 1.8 percent.  However, the labor cost of generating that small amount of added value increased by 7.4 percent.  The difference between those two numbers is a drop in productivity of 5.2% over the entire quarter.

This is the largest quarterly drop in productivity since 1960 !

The Biden administration will blame the drop in productivity on a lack of material to produce the end product (ie. the COVID excuse).  Which means employed people were sitting around waiting for goods to arrive and being less productive.   There is a small amount of that which might be true.  However, it is not the biggest factor, at least not on this scale.  Keep in mind we are talking about both goods and services.

The more likely cause of such a massive decline in productivity is a genuine decline in demand.  In the aggregate, consumers needed less goods and services.  This likelihood aligns with the diminished and softened retail sales figures recently noted.   It is a simple cause and effect.  When gasoline, energy, and essential products like food cost more, consumers have less money for other stuff.  Demand for the non-essential products drop.” (more)

When we look at the macro picture, things look a lot clearer than the financial pundits talk about.

After the March 2021 peak of savings rate (massive fed spending bill), sometime around June of 2021, the U.S. economy overall started to jam up.  In May of 2021 the first round of massive inflation started, what the Fed and White House called “transitional”, but we noted it wasn’t.

Then, new home housing starts, and contracts for new homes yet to be built suddenly stopped; while at the same time (June/July 2021) new permits for construction dropped.  From that moment forward prices for food, fuel and energy related products started a massive upward spike.  Despite the Fed and administration “transitional” talking points, the prices continued to climb and inflation was growing month over month.

The middle class and working class started to really feel the inflationary pain in the second half of 2021.  It was not the Delta variant driving this economic pain, it was inflation and the collapse of disposable incomes.  By the time we go to November 2021, suddenly the low employment gains shocked the financial pundits.  A few weeks later, we saw sales data from November go down, and retail hiring for the holiday season was non-existent.

Take a look at the timeline in hindsight. At exactly the wrong time last year, September 2021, Joe Biden mandated vaccination for all U.S. workers.   The economic data was sending signals that things were tenuous, but no one was paying attention.  The already tenuous economy and labor pool (economists ignoring) was hit with an ultimatum of forced vaccination or get fired.

It’s not a single factor leading to this quits rate data.  As you can see, there is a snowball effect inside the data.   Wages earned, including any pay raises, have been chewed up by much higher inflation.   When we look back upon this economy in a year, I am quite certain we will identify the inflection point as June of 2021.  That’s when things peaked and started to go down.

Keep in mind, inflation has a big impact on job turnover.  When people feel inflation, they look for pay raises.  Larger employers are slower to respond to pay raises driven by worker needs, and many have very structured pay raise guidance.

Ex. if a worker needs a raise (immediate inflation driven), and the boss or organization is less responsive (structured pay raise schedule or performance review), the worker can get a faster pay raise by quitting their employer and going to work at a higher entry wage rate with another firm.   If the job market is tight, the worker can make much more doing this.  This is called job-jumping.  In my opinion, this is a big factor right now.

So, what does the labor market look like in your town?  What is going on in/around your community and local economy?   Are you seeing a drop in spending habits overall for the people around you?   The workforce hunkering down, forced to spend savings to survive and dealing with massive rising costs, will ultimately lead to less employment.

What do you see around you?