Posted originally on the CTH on January 9, 2023 | sundance
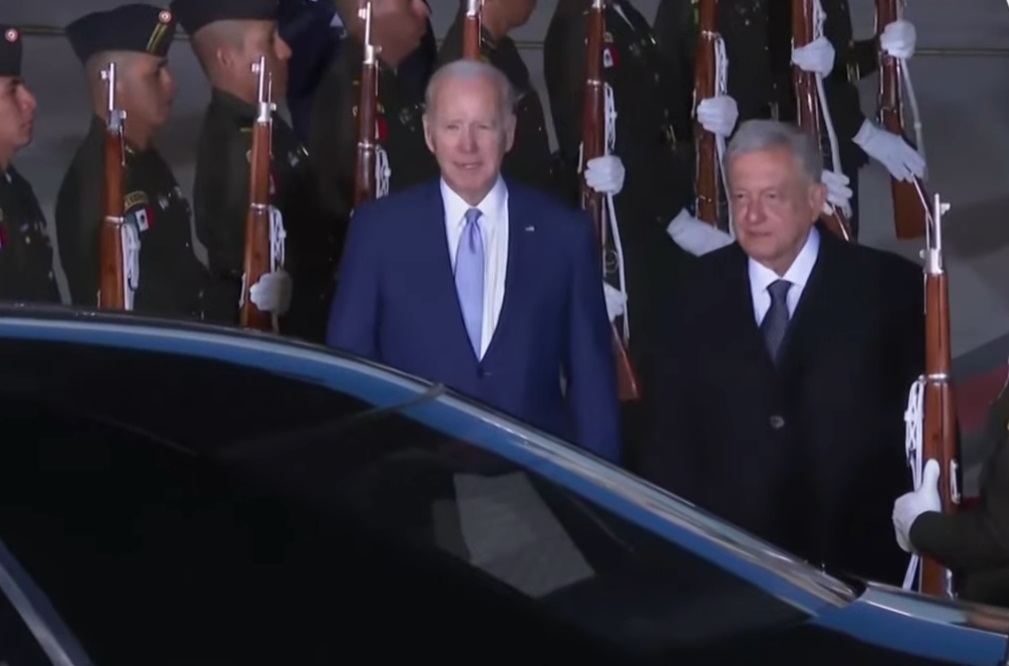
Joe Biden is in Mexico for the U.S-Mexico-Canada North American Summit, and as we have said the demands from the U.S and Canada to join the western climate change energy agenda immediately come to the forefront.
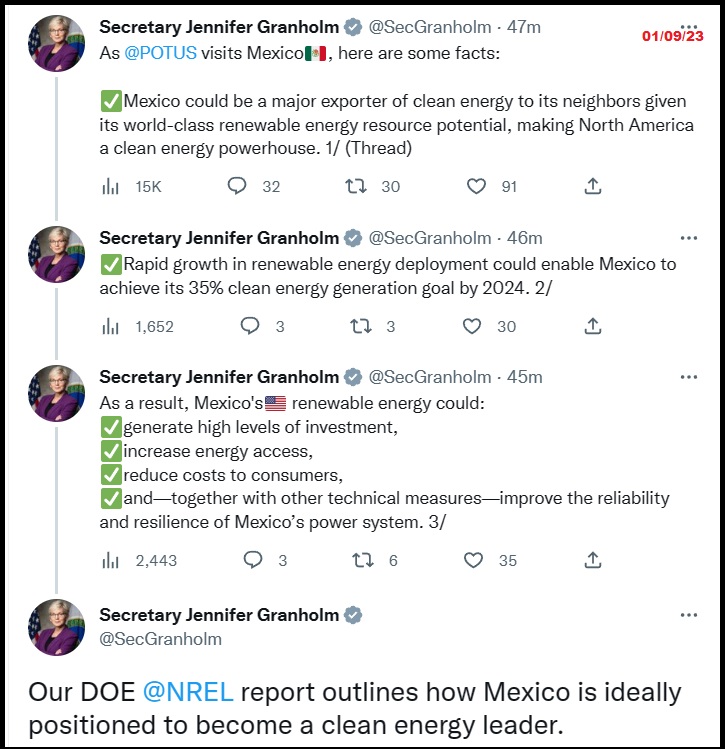
As National Security Advisor Jake Sullivan briefs the traveling press corps, Energy Secretary Jennifer Granholm starts tweeting in support of the overall narrative.
The overall effort is designed to force Mexico to join the western Build Back Better energy policy agenda, known domestically as the Green New Deal.
Previously Mexican President Andres Manuel Lopez-Obrador has pushed back against the pressure from the U.S. and told Joe Biden his nation would remain focused on economic gains, that includes the use of traditional Oil, Coal and Natural Gas resources. However, the corporations and multinational financial constructs who control the Biden and Trudeau administrations, WEF types, are not going to accept that.
It is within this very consequential economic dynamic that we begin to see a host of other ancillary geopolitical aspects start to build against the AMLO administration, to include cartel activity perhaps stimulated by covert U.S. intelligence activity. We have been outlining the importance of Mexico for several months, there are trillions at stake.
The first pressure point applied, was to demand AMLO join the Biden and Trudeau group by condemning the populist uprising in Brazil [Accomplished]. Among other geopolitical facets, this joint condemnation helps set distance between Mexico and the potential for any BRICS alliance.
With that secured, now the Biden team led by Jake Sullivan (Neocon wing of State Dept), start to apply pressure around social issues (immigration), cultural issues (fentanyl trade), humanitarian issues (human trafficking, border crisis, drugs and cartels); then building toward economic issues (worker conditions and trade) ultimately culminating with energy policy (Green New Deal).
(White House) – […] And President López Obrador and President Biden will have the opportunity to discuss questions related to supply chains, to clean energy cooperation, and to a larger economic vision of North America that involves high labor standards, high environmental standards, and as much positively reinforcing economic activity as possible that allows the United States to be the manufacturing powerhouse that President Biden has talked about but also is a win-win for Mexico and Canada, and reduces our dependencies on other countries and other parts of the world who don’t necessarily share the same values that we share with our partners here in North America.
There will be a lot of other issues on the agenda: broader law enforcement cooperation, questions related to how we move forward a common agenda to combat the climate crisis, health, people-to-people ties, and so much else.
But these areas in particular — migration, fentanyl, and integrated supply chains and the increased strength of North America’s manufacturing and innovation powerhouse in critical sectors, including in the clean energy sector — these are the areas, I think, where you will see the greatest amount of focus.
The final point I would make: This trip is a good opportunity for President Biden to deepen his personal engagement with President López Obrador and Prime Minister Trudeau. Yesterday, he had the opportunity to ride with President López Obrador from the airport back into town, which gave them the chance to just have a one-on-one chat on kind of how they’re seeing the world right now, what’s on their minds. I think they both got a lot out of it.
And then, this evening, they will have the chance to all meet together with their spouses for a personal dinner. So that’s an important dimension to this as well.
[…] Q – And briefly, can you say whether the presidents discussed the dispute over Mexican energy policy, which has been a thorn in trade ties for some time, in either the limo ride — or does he plan to discuss it over the next couple of days? What is President Biden’s message to President López Obrador on that issue?
MR. SULLIVAN: I’m not going to read out the conversation in the limo because I think that was a personal conversation between the two of them. I’ll let each of them speak to it, to the extent they feel comfortable doing so.
What I will say is that the question of energy policy and the consultations over energy will be on the agenda, will come up between the two leaders on this trip. I want to leave it at that because those are sensitive conversations. They’re best done behind closed doors. But the President certainly comes with that as a key part of his economic agenda here.
Q Can I follow up? Can I follow on the — just the energy part? In talking to U.S. energy companies, they’re frustrated at the pace of these negotiations, consultations. The deadline — it expires, it’s been extended.
They are urging this White House to take the next step of calling a dispute panel, saying that there’s evidence that that is necessary. Is that something the U.S. is considering? And kind of what — what would need — what are the preconditions you would need to see in order to kind of call a dispute panel?
MR. SULLIVAN: So, I’m not going to negotiate in public or telegraph next steps in public. I’ll just say that we remain in close touch with all of those energy stakeholders. We remain in close touch with both Democrats and Republicans on the Hill. In fact, I’ve spoken with members just this morning on this issue, to keep them up to date on what we’re doing.
And as I said before, this will be a topic between the leaders here in Mexico, but I don’t want to get ahead of their opportunity to discuss this. I would just say that we think consultations have helped clarify both the nature of U.S. concerns, have identified some potential pathways forward, but we’re not there yet. And we’ll make determinations about next steps based how things unfold here in the coming days and weeks. (read more)