Rules for Radicals: What Constitutional Conservatives Should Know About Saul Alinsky


122K subscribers
SUBSCRIBE
David Horowitz Published in 1972, Saul Alinsky’s Rules for Radicals still enjoys brisk sales. With a former community organizer now commander-in-chief, and the idea of transformative leadership through radical change not just a theory, it is important for partisans of the Constitution to understand the roots of today’s radicalism. Presented as part of the First Principles on First Fridays series for the month of July, 2010. Recorded July 9, 2010. (c) Hillsdale College, 2010. http://kirbycenter.hillsdale.edu/

Passion for Politics Meets the Story of Christmas


150K subscribers

Join Bill Whittle, Scott Ott, Stephen Green and the Members and fans of this show on a 3-night cruise in May 2020. Reserve your cabin now at https://BillWhittleCruise.com —– Why do you even care about politics — a distant enterprise, operated by people you don’t really know, arguing about things that often don’t even impact you? The passion for politics, that inner drive that keeps you on fire with emotion, has a reason. Scott Ott has a theory that ties your desire for good governance to the story of Christmas. Right Angle comes to you 20-times each month thanks to our Members. Meet them and unlock new levels of engagement by becoming a one of us at https;//BillWhittle.com/register/ Listen to audio versions of this show at https://bit.ly/BWN-Podcasts Ask Alexa to play Bill Whittle Network on TuneIn Radio , or watch Bill Whittle Network on your Fire TV

The Poorest 20% of Americans Are Richer on Average Than Most Nations of Europe


A groundbreaking study by Just Facts has discovered that after accounting for all income, charity, and non-cash welfare benefits like subsidized housing and Food Stamps—the poorest 20% of Americans consume more goods and services than the national averages for all people in most affluent countries. This includes the majority of countries in the prestigious Organization for Economic Cooperation and Development (OECD), including its European members. In other words, if the U.S. “poor” were a nation, it would be one of the world’s richest.

Notably, this study was reviewed by Dr. Henrique Schneider, professor of economics at Nordakademie University in Germany and the chief economist of the Swiss Federation of Small and Medium-Sized Enterprises. After examining the source data and Just Facts’ methodology, he concluded: “This study is sound and conforms with academic standards. I personally think it provides valuable insight into poverty measures and adds considerably to this field of research.”

The “Poorest” Rich Nation?

In a July 1st New York Times video op-ed that decries “fake news” and calls for “a more truthful approach” to “the myth of America as the greatest nation on earth,” Times producers Taige Jensen and Nayeema Raza claim that the U.S. has “fallen well behind Europe” in many respects and has “more in common with ‘developing countries’ than we’d like to admit.”

“One good test” of this, they say, is how the U.S. ranks in the OECD, a group of “36 countries, predominantly wealthy, Western, and Democratic.” While examining these rankings, they corrupt the truth in ways that violate the Times’ op-ed standards, which declare that “you can have any opinion you would like,” but “the facts in a piece must be supported and validated,” and “you can’t say that a certain battle began on a certain day if it did not.”

A prime example is their claim that “America is the richest country” in the OECD, “but we’re also the poorest, with a whopping 18% poverty rate—closer to Mexico than Western Europe.” That assertion prompted Just Facts to conduct a rigorous, original study of this issue with data from the OECD, the World Bank, and the U.S. government’s Bureau of Economic Analysis. It found that the Times is not merely wrong about this issue but is reporting the polar opposite of reality.

Poor Compared to Who?

The most glaring evidence against the Times’ rhetoric is a note located just above the OECD’s data for poverty rates. It explains that these rates measure relative poverty within nations, not between nations. As the note states, the figures represent portions of people with less than “half the median household income” in their own nations—and thus—”two countries with the same poverty rates may differ in terms of the relative income-level of the poor.”

The upshot is laid bare by the fact that this OECD measure assigns a higher poverty rate to the U.S. (17.8%) than to Mexico (16.6%). Yet, World Bank data shows that 35% of Mexico’s population lives on less than $5.50 per day, as compared to only 2% of people in the United States.

Hence, the OECD’s poverty rates say nothing about which nation is “the poorest.” Nonetheless, this is exactly how the Times misrepresented them.

The same point applies to broader discussions about poverty, which can be measured in two very different ways: (1) relative poverty or (2) absolute poverty. Relative measures of poverty, like the one cited by the Times, can be misleading if the presenter does not answer the question: “Poor compared to who?” Absolute measures, like the number of people with income below a certain level, are more straightforward and enlightening.

Unmeasured Income and Benefits

To accurately compare living standards across or within nations, it is necessary to account for all major aspects of material welfare. None of the data above does this.

The OECD data is particularly flawed because it is based on “income,” which excludes a host of non-cash government benefits and private charity that are abundant in the United States. Examples include but are not limited to:

  • healthcare provided by Medicaid, free clinics, and the Children’s Health Insurance Program.
  • nourishment provided by Food Stamps, school lunches, school breakfasts, soup kitchens, food pantries, and the Women’s, Infants’ & Children’s program.
  • housing and amenities provided through rent subsidies, utility assistance, and homeless shelters.

The World Bank data includes those items but is still incomplete because it is based on government “household surveys,” and U.S. low-income households greatly underreport both their income and non-cash benefits in such surveys. As documented in a 2015 paper in the Journal of Economic Perspectives entitled “Household Surveys in Crisis”:

  • “In recent years, more than half of welfare dollars and nearly half of food stamp dollars have been missed in several major” government surveys.
  • There has been “a sharp rise” in underreporting of government benefits received by low-income households in the United States.
  • This “understatement of incomes” masks “the poverty-reducing effects of government programs” and leads to “an overstatement of poverty and inequality.”

Likewise, the U.S. Bureau of Economic Analysis explains that such surveys “have issues with recalling income and expenditures and are subject to deliberate underreporting of certain items.” The U.S. Census Bureau says much the same, writing that “for many different reasons there is a tendency in household surveys for respondents to underreport their income.”

There is also a wider lesson here. When politicians and the media talk about income inequality, they often use statistics that fail to account for large amounts of income and benefits received by low- and middle-income households. This greatly overstates inequality and feeds deceptive narratives.

Relevant, Reliable Data

The World Bank’s “preferred” indicator of material well-being is “consumption“ of goods and services. This is due to “practical reasons of reliability and because consumption is thought to better capture long-run welfare levels than current income.” Likewise, a 2003 paper in the Journal of Human Resources explains that:

  • “research on poor households in the U.S. suggests that consumption is better reported than income” and is “a more direct measure of material well-being.”
  • “consumption standards were behind the original setting of the poverty line,” but governments now use income because of its “ease of reporting.”

The World Bank publishes a comprehensive dataset on consumption that isn’t dependent on the accuracy of household surveys and includes all goods and services, but it only provides the average consumption per person in each nation—not the poorest people in each nation.

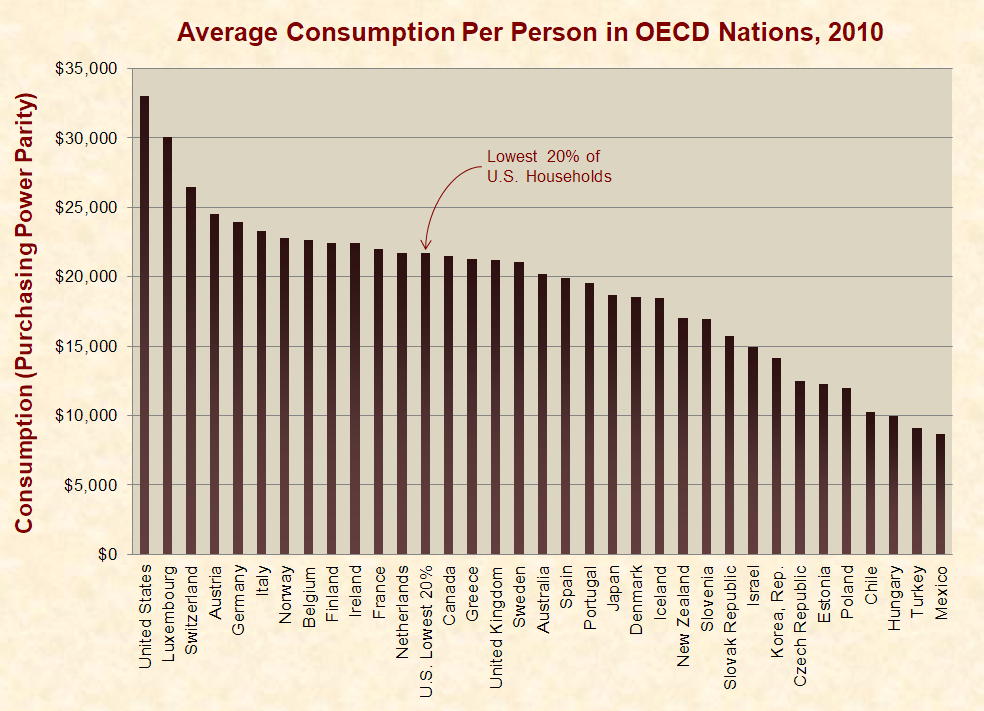
However, the U.S. Bureau of Economic Analysis published a study that provides exactly that for 2010. Combined with World Bank data for the same year, these datasets show that the poorest 20% of U.S. households have higher average consumption per person than the averages for all people in most nations of the OECD and Europe:

Average Consumption Per Person in OECD Nations, 2010

The high consumption of America’s “poor” doesn’t mean they live better than average people in the nations they outpace, like Spain, Denmark, Japan, Greece, and New Zealand. This is because people’s quality of life also depends on their communities and personal choices, like the local politicians they elect, the violent crimes they commit, and the spending decisions they make.

For instance, a Department of Agriculture study found that U.S. households receiving Food Stamps spend about 50% more on sweetened drinks, desserts and candy than on fruits & vegetables. In comparison, households not receiving Food Stamps spend slightly more on fruits & vegetables than on sweets.

Nonetheless, the fact remains that the privilege of living in the U.S. affords poor people with more material resources than the averages for most of the world’s richest nations.

Another important strength of this data is that it is adjusted for purchasing power to measure tangible realities like square feet of living area, foods, smartphones, etc. This removes the confounding effects of factors like inflation and exchange rates. Thus, an apple in one nation is counted the same as an apple in another.

To spot check the results for accuracy, Just Facts compared the World Bank consumption figure for the entire U.S. with the one from the Bureau of Economic Analysis. They were within 2% of each other. All of the data, documentation, and calculations are available in this spreadsheet.

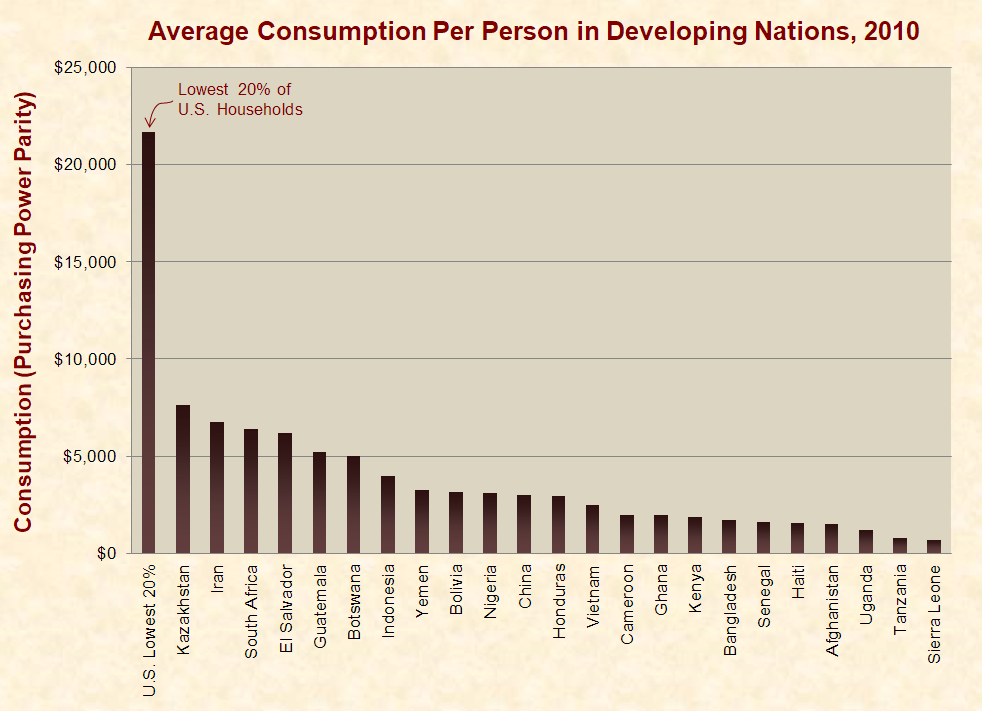
In light of these facts, the Times’ claim that the U.S. has “more in common with ‘developing countries’ than we’d like to admit” is especially far-fetched. In 2010, even the poorest 20% of Americans consumed 3 to 30 times more goods and services than the averages for all people in a wide array of developing nations around the world:

Average Consumption Per Person in Developing Nations, 2010

These immense gaps in standards of living are a major reason why people from developing nations immigrate to the U.S. instead of vice versa.

Why Is the U.S. So Much Richer?

Instead of maligning the United States, the Times could have covered this issue in a way that would help people around the world improve their material well-being by replicating what makes the U.S. so successful. However, that would require conveying the following facts, many of which the Times has previously misreported:

  • High energy prices, like those caused by ambitious “green energy” programs in Europe, depress living standards, especially for the poor.
  • High tax rates reduce incentives to work, save, and invest, and these can have widespread harmful effects.
  • Abundant social programs can reduce market income through multiple mechanisms—and as explained by President Obama’s former chief economist Lawrence Summers, “government assistance programs” provide people with “an incentive, and the means, not to work.”
  • The overall productivity of each nation trickles down to the poor, and this is partly why McDonald’s workers in the U.S. have more real purchasing power than in Europe and six times more than in Latin America, even though these workers perform the same jobs with the same technology.
  • Family disintegration driven by changing attitudes toward sex, marital fidelity, and familial responsibility has strong, negative impacts on household income.
  • In direct contradiction to the Times, a wealth of data suggests that aggressive government regulations harm economies.

Many other factors correlate with the economic conditions of nations and individuals, but the above are some key ones that give the U.S. an advantage over many European and other OECD countries.

Summary

The Times closes its video by claiming that “America may once have been the greatest, but today America, we’re just okay.” In reality, the U.S. is so economically exceptional that the poorest 20% of Americans are richer than many of the world’s most affluent nations.

Last year, the Times adopted a new slogan, “The truth is worth it.” Yet, in this case and others, it has twisted the truth in ways that can genuinely hurt people. The Times makes other spurious claims about the U.S. in this same video, which will be deflated in future articles.

The BS of Climate Change from Polar Bears to Taxes


COMMENT: Mr. Armstrong, I have worked in the Arctic Circle. They always show polar bears on ice but what they fail to tell the public is that they normally spend time on land in summer when sea ice declines and most pregnant polar bears give birth and make their dens near the coast not on ice in the open sea.  They are excellent swimmers and will swim long distances. The photo they used to start global warming makes them appear to be clinging to ice because they cannot swim and that is where they live exclusively. This is just another part of the propaganda.

It is rare to find someone these days willing to say the truth.

HN

REPLY: Someone sent in this Facebook link that lists the timeline of climate scares. It is amazing how these people hate society so much that they have lied about everything to try to send us back to the pre-Industrial Revolution. They are totally dishonest about what their objectives truly are and they conspire together to destroy our civilization.

They have succeeded in convincing Europe to take drastic action on “climate change,” but perhaps because the politicians already KNOW that their social system is collapsing and they will be unable to sustain it even with the highest taxation on the planet.

Macron of France is pushing hard to Federalize Europe because he knows full well that France cannot maintain the level of social benefits and still keep its spending in line with the European treaty. His agenda is to federalize Europe and use climate change as a cover for the failing socialism he faces. By pushing France to surrender its total sovereignty to Brussels, the cuts to French benefits will then not be his, but Brussels. That ploy will simply not work. Nonetheless, he has been trying to use climate change to reduce social benefits.


When I lived in Switzerland for a few months a few years ago working on a project, the same Starbucks drink in Zug was $10 compared to $5 in the USA. The degree of hidden taxes through the VAT system combined with income taxes that are 20-30% higher than in the USA means there is just no room to raise taxes in a normal fashion. Hence, politicians need global warming as an excuse to raise taxes. That is what began the Yellow Vest Movement in France — the added fuel tax to save the planet. We saw the same excuse when Canada placed a $1,000 tax per home to save the planet when the money just goes into the general coffer and does not even fund a pretend strategy to save the planet.

Climate change has become the battle cry for governments to simply raise taxes and the lies will only fuel civil unrest.

Climate Change Fears of Teen Activist Are Empirically Baseless


A very good summary of the unfounded fears about climate change. It’s fairly generalized, but is ideal for passing onto friends who are not interested in details:


Iceland Buried in 30 foot Snowfall


The biggest snowstorm in recorded memory has hit Iceland. The Emigration Center is under 30 feet of snow. It has never snowed like this so horses typically remained outside and not in barns. This snowstorm has killed up to 80 horses. Nobody has ever seen a winter like this before. They must be calling this “global warming” just as insurance companies sell death insurance by calling it the opposite – Life Insurance. They certainly do not pay if you never die.

The ECB & its Green Agenda


QUESTION: Marty, what do you think about Legarde claiming the top priority of the ECB is climate protection?

DK

ANSWER: The proposition that the primary objective of the ECB should be climate protection is highly questionable even from a legal perspective. The European Treaties created the ECB with the primary function to ensure price stability. Interestingly, the statutory authority also states that the ECB must support the general economic policy of the European Union without prejudice to the objective of price stability. There is nothing legally in the authorization of the ECB to proclaim it will listen now to Al Gore and Jennifer Morgan of Greenpeace who are both manipulating this 16-year-old “person of the year.”

I do not see anything in the authorization of the ECB where it has the legal right or even the obligation to defend the climate. This seems to be a personal agenda, for Greenpeace succeeded in getting into Davos and influenced Europeans who have gone off the deep end. For the ECB to put climate protection as one of the central themes of EU policy is clearly without any legal authority no less precedent. Climate change is not the role of a central bank.

Supporting “green bonds” has been the worst possible investment. We have institutions asking if we could create a portfolio of green investments that do not lose money just so they can claim they are “investing” in green. Any venture into “green” investment is counter to the ECB directive to provide price stability. The ECB must not compromise the objective of price stability, but it is an impossible task to support a green agenda. It seems that the ECB is now interpreting that if the European Commission imposes strict climate policies which will raise the cost of everything and wipe out the German car industry by virtually outlawing the combustion engine. The ECB has considerable political freedom, and power, to enforce a green agenda upon the EU.

This certainly seems to be an agenda that will only further undermine the European economy going into 2032 and increase the drive for separatism.

A Technical Study in the Relationships of Solar Flux, Water, Carbon Dioxide and Global Temperatures, November 2019 Data


From the attached report on climate change for November 2019 Data we have the two charts showing how much the global temperature has actually gone up since we started to measure CO2 in the atmosphere? To show this graphically Chart 8 was constructed by plotting CO2 as a percent increase from when it was first measured in 1958, the Black plot, the scale is on the left and it shows CO2 going up a bit over 30.0% from 1958 to November of 2019. That is a very large change as anyone would have to agree.  Now how about temperature, well when we look at the percentage change in temperature from 1958, using Kelvin (which does measure the change in heat), we find that the changes in global temperature (heat) are almost un-measurable. The scale on the right side had to be expanded 10 times (the range is 40 % on the left and 4% on the right) to be able to see the plot in the same chart in any detail. The red plot, starting in 1958, shows that the thermal energy in the earth’s atmosphere increased by .30%; while CO2 has increased by 30.0% which is 100 times that of the increase in temperature. So is there really a meaningful link between them that would give as a major problem? The numbers tell us no there isn’t.

The next chart is Chart 8a which is the same as Chart 8 except for the scales which are the same for both CO2 and Temperature. As you see the increase in energy, heat, is not visually observably in this chart hence the need for the previous chart 8 to show the minuscule increase in thermal energy shown by NASA in relationship to the change in CO2. Based to these trends, determined by excel not me, in 2028 CO2 will be 428 ppm and temperatures will be 15.0o Celsius and in 2038 CO2 will be 458 ppm and temperatures will be 15.6O Celsius. This is what the data shows no matter what the reasons are, so I have no idea how the IPCC gets to predict that the world will end in ten or even twenty years.

The full 40 page report explains how these charts were developed and why using NASA and NOAA data that are used without change to prove that The New Green Deal is not required and any attempt to complete that plan will be a worldwide disaster.

Click on the link below for the full report that you can download.

BLACKBODY TEMPERATURE 2019-11


Greta Thunberg When She Can’t Read a Script from Greenpeace


Greta has been named “Person of the Year,” which is supposed to be a great honor. Of course, TIMEis not without their flaws since in 1938 they also named Adolf Hitler the person of the year for his extraordinary economic revitalization. TIME has completely failed to investigate the fact that Greta is not much when she is without a script prepared for her by Jennifer Morgan at Greenpeace, most likely seconded by Al Gore.

The exploitation of Greta is really child abuse. These people will do anything and make up statistics to stop the Industrial Revolution. They want 100% electric cars without any consideration of how to generate that much electricity.

The claims that Greta delivered her famous UN speech to an empty room remains suspicious. There are no photographs to prove there was an audience nor did anyone take a photo to show the room was empty.

Then there was the recent claim she sat on the floor in a German train. The DB Rail company responded that she had a first-class ticket and conceded that she did not sit on the floor for the entire trip. Thunberg claims she doesn’t fly on planes because it’s considered harmful to the climate. However, she flew to Canada to try to intervene in the election since you cannot take a train from Sweden to Canada.  Anyone who travels in Germany by train knows they are overcrowded and they keep selling tickets with no seats. I too have had to stand between stops and then you get a seat. Not very efficient and the climate activists want to end air travel within Europe without the infrastructure to handle the travel.

The question is just how long will this continue without any investigation into what would be a criminal fraud in any other field. The banks were fined for putting out fake research to support the Dot.com Bubble in 2002. Here we have countless fake research moving the start dates to pretend there is global warming, which amounts to a snapshot of the Dow for one week, and proclaiming that is the major trend that will never end.

Trump should order the Justice Department to at least investigate this massive fraud upon the public.

Global warming: why you should not worry


43.8K subscribers

SUBSCRIBE
(Boston Globe) An MIT scientist explains the potential dangers