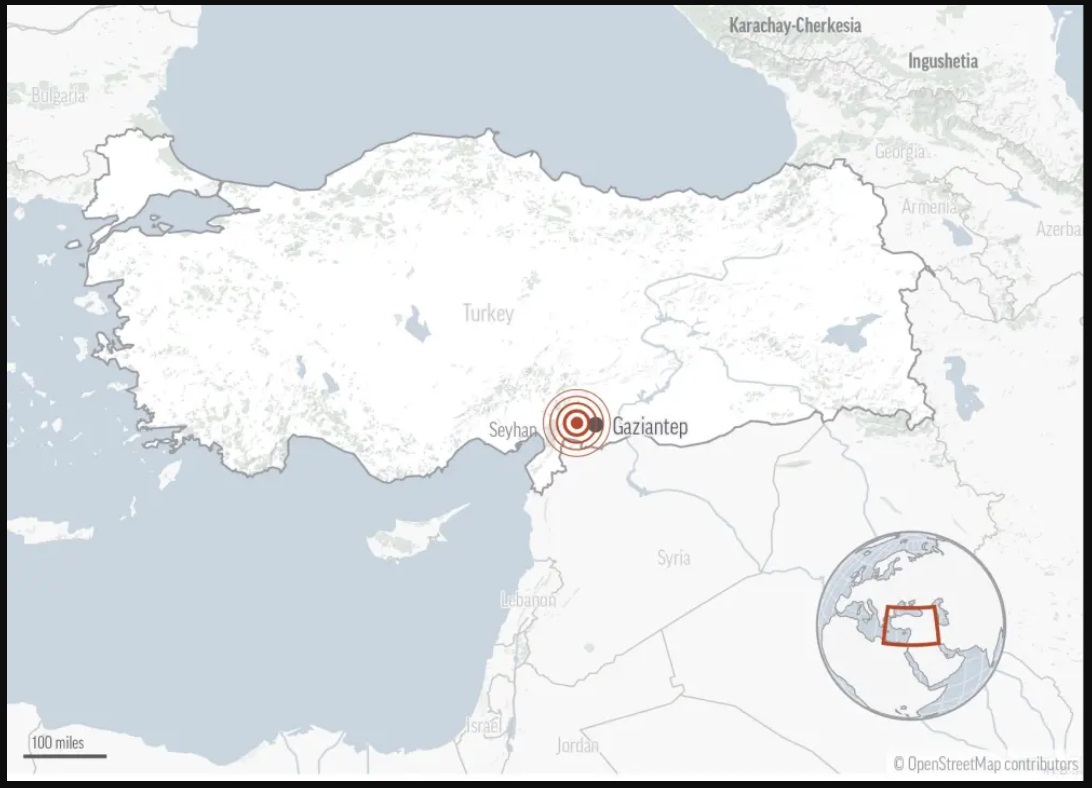
The Double Earthquake that hit Turkey & Syria has been extraordinary. The first quake was a 7.8 magnitude sticking in southeastern Turkey and northwestern Syria early Monday morning local time. Then 9 hours later, a second quake, which recorded a magnitude of 7.5, struck hard. Both countries have witnessed the devastating aftermath as rescue workers on the ground are reporting that nearly 12,000 people have been killed as a result of the quakes, and tens of thousands more have been injured. Thousands of buildings have also been reduced to rubble.
This region is prone to these major DOUBLE earthquakes. Overall, since the major earthquake of 17AD that was so created a financial panic in Rome and forced Emperor Tiberius to issue these coins noting that they were for the relief of that region, there have been 81 major earthquakes. There have been many double earthquakes and the previous was in 2017 June 12th and July 21st. Before that in 2011, there was a Double Earthquake on the 23rd of October and then on November 9th.
What is unusual this time is the time differential was only 9 hours rather than days. This raises the concern that this event may not be over just yet.
Posted originally on the CTH on February 6, 2023 | Sundance
I did not have internet access for most of today, another long-term recovery issue. However, now that I am seeing the footage of the earthquake in Southern Turkey and Northern Syria, my prayers are for all of those in the region. The devastation is just incredible.
According to the Associated Press, 5,600 buildings have collapsed and several of them came down today during aftershocks amid search and rescue operations. The current recorded death toll is over 4,300 people, with the World Health Organization (WHO) predicting the total loss of life could exceed 20,000. This is just horrific.
The estimated 7.8 magnitude earthquake hit over an area of several major population centers. The Guardian reports, “the population of the ten provinces in southern Turkey affected by the earthquakes are home to 13.5 million people. So far, according to the Andalou agency, more than 5,600 buildings have collapsed.
It is just after 6am in Turkey, and we’re seeing stories of people rescued after a very long day and night, which means they survived not only the rubble’s collapse but the cold. There are many, many more who have not yet been found, with the WHO predicting the death toll could reach 20,000 in the coming days. For now, here are videos of a three-year-old toddler and a woman who were freed from collapsed buildings by rescuers.” (link)
(Via Reuters) […] The magnitude 7.8 quake brought down whole apartment blocks in Turkish cities and piled more devastation on millions of Syrians displaced by years of war. It struck before sunrise in harsh weather and was followed in the early afternoon by another large quake.
In Diyarbakir in southeast Turkey, a woman speaking next to the wreckage of the seven-storey block where she lived said: “We were shaken like a cradle. There were nine of us at home. Two sons of mine are still in the rubble, I’m waiting for them.”
She was nursing a broken arm and had injuries to her face.
“It was like the apocalypse,” said Abdul Salam al-Mahmoud, a Syrian in the northern town of Atareb. “It’s bitterly cold and there’s heavy rain, and people need saving.” (more)
All-powerful Father, as we see all of the destruction caused by this natural disaster, we mourn for all that has been lost and the fragility of this life.
Lord God of mercy, please comfort those who have lost somebody they love, and those who are yet still searching. Give them comfort and peace.
Heavenly Father, be a protective wing for those who have survived, but lost their home. Grant the men, women and children the needed fortitude and assistance they need to recover and rebuild. Show me how best to pray for their needs and guide my prayer.
Lord God of all creation, be strong with directed purpose for those whose job it is to search through the rubble for those lost. Give them endurance and strength as they complete their responsibilities.
God of comfort and mercy, help us come together as one body in You during this time of tragedy.
You are the redeemer, the source of our strength and courage, please provide us with reassurance, humanity and faith.
In Your holy and merciful name, we humbly kneel and pray.
Posted originally on the CTh on January 14, 2023 | Sundance
Their names will not make national headlines, and generally everyone has moved on, but to their families and friends Ilonka Knes and James Hurst mattered. As CTH readers may remember, in the aftermath of Hurricane Ian we shared that many missing people would be found in the months after the storm, and unfortunately many more will likely never be found.
The body of Mrs Ilonka Knes (82) was found in the mangroves and back bay salt marsh near Fort Myers Beach and has been positively identified. The body of her husband Robert was found in the days immediately following Hurricane Ian.
Additionally, the sailboat “Good Girl” was found submerged with human remains believed to be the body of James ‘Denny’ Hurst (73).
Mrs. Knes and Mr Hurst bring the total number of Hurricane Ian victims in Lee County, Florida, to seventy-five. Mr. Hurst was the final “official” missing person on the local list; however, there are many more yet unaccounted that were not from this immediate area. The physical devastation is widespread, but the emotional toll on the families and friends of the missing has been beyond imagining. Tonight, two more families have answers.
(FLORIDA) – During Thursday’s news conference, Lee County Sheriff Carmine Marceno released new information regarding the area’s recovery.
“Most of us have gotten back to a sense of the new normal. For some, still missing their loved ones, every day since the storm has been difficult,” said Marceno.
The sheriff said his agency originally attempted a well-being check at what was left at the home of Ilonka and Robert Knes in the aftermath of the storm.
The body of Robert Knes was found shortly after Ian struck, but there were no signs of his wife during the days and weeks following the disaster.
Marceno said it wasn’t until mid-January that a debris removal crew found remains in a dense patch of mangroves, that later tested positive, through the use of dental records, to be that of Ilonka. (more)
The power and duration of Hurricane Ian killed more people than Hurricane Andrew and the storm that hit Southwest Florida last September is now recorded as the deadliest storm in the past 87 years.
If you live anywhere along the coastline of the United States, inland to about 50 miles, please remember to always take these storms seriously.
After this storm, and having been through four previous direct impacts, including Homestead AFB (Andrew), I would say this…. If there is even a remote chance you would ever encounter this type of a hurricane event, EVACUATE. Do not try and hunker down if there is a looming possibility of having to rely on a structure to withstand 150+ mph wind for a full day. Just leave. With all of my preparations in place, and all of the knowledge I possess in storm survival, I would never attempt it again.
It is more than three months since Hurricane Ian hit Southwest Florida and beyond the chaos and debris that still remains visible almost everywhere, they are still recovering bodies. Please take hurricane preparations seriously.
Posted originally on the conservative tree house on December 22, 2022 | Sundance
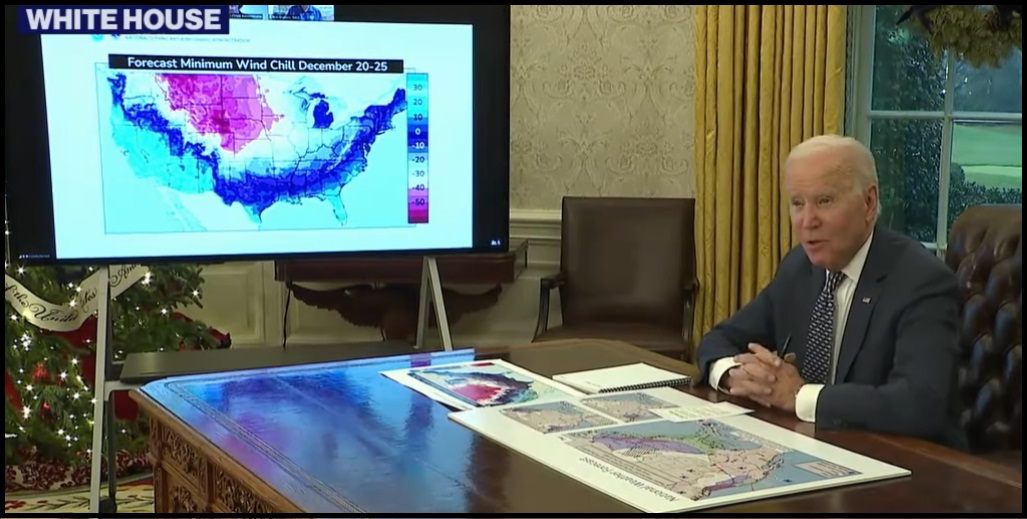
Extreme winter weather, such as subzero temperatures, wind chills and heavy snow, is impacting much of the U.S. this Christmas holiday weekend and is expected to heavily impact travel. Major parts of the U.S. electricity grid are very vulnerable, particularly as a result of Biden energy policy, steering investment away from coal, oil and natural gas.
Places across the northern Rockies, northern Plains and upper Midwest are experiencing temperature drops by tens of degrees in minutes. The extremely cold airmass is expected to hit at least 24 other states along the Gulf Coast and in the eastern U.S. The National Weather Service has a Detailed Warning HERE.
The potential for severe consequences as an outcome of this winter storm has the political minders of Joe Biden worried.
.
(Via NWS) – A major and anomalous storm system is forecast to produce a multitude of weather hazards through early this weekend, as heavy snowfall, strong winds, and dangerously cold temperatures span from the northern Great Basin through the Plains, Upper Midwest, Great Lakes, and the northern/central Appalachians.
At the forefront of the impressive weather pattern is a dangerous and record-breaking cold air mass in the wake of a strong arctic cold front diving southward across the southern Plains today and eastward into the Ohio/Tennessee Valleys by tonight.
Behind the front, temperatures across the central High Plains have already plummeted 50 degrees F in just a few hours, with widespread subzero readings extending throughout much of the central/northern Plains and northern Rockies/Great Basin.
These temperatures combined with sustained winds of 20 to 30 mph and higher wind gusts of up to 60 mph will continue to lead to wind chills as low as minus 40 degrees across a large swath of the Intermountain West and northern/central Plains, with more localized areas of minus 50 to minus 70 possible through the end of the week. (read more)
I am reminded of Fort Wainwright, Alaska, in January of 1989, when a cold airmass settled on the state for weeks. It was so cold (-50°, -70° or worse) that airplanes could not achieve lift. McGrath went from +29° to -42° during a work shift. During a single work shift everyone’s truck tires were flat and frozen. LOL… Crazy stuff.
Joe Biden – “I’m going to, shortly, be briefed by — by both FEMA and the National Weather Service, and we’re going to start that briefing. And — but in the meantime, please take this storm extremely seriously. And I don’t know whether your bosses will let you, but if you all have travel plans, leave now. Not — not a joke. I’m tell- — sending my staff — my staff, if they have plans to leave on — tomorrow — late tonight or tomorrow, I’m telling them to leave now. They can talk to me on the phone. It’s not life and death. But it will be if they don’t — if they don’t get out, they may not get out. So, any rate, thank you all for coming in, and I’m going to do the briefing now. Thank you.” (link)
The polar air will bring “extreme and prolonged freezing conditions for southern Mississippi and southeast Louisiana,” the National Weather Service (NWS) said in a special weather statement Sunday.
“We’re looking at much-below normal temperatures, potentially record-low temperatures leading up to the Christmas holiday,” said NWS meteorologist Zack Taylor. (link)
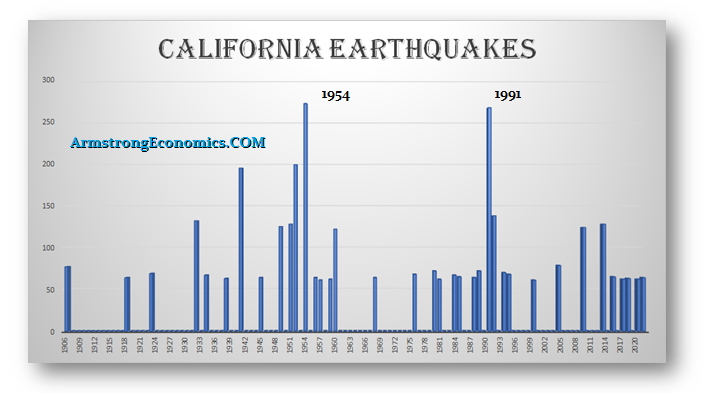
QUESTION: Marty, we had an earthquake here in Northern California today that seems to be following your forecast building into 2028. Can you update your earthquake chart?
Thank you
Jeff
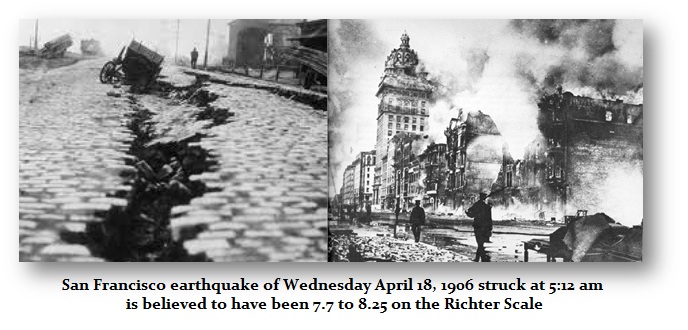
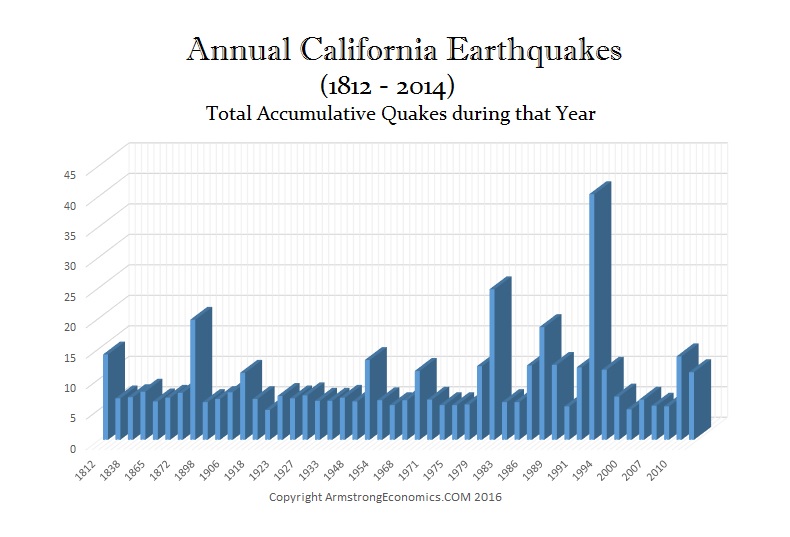
ANSWER: Here is the update. Socrates has already pulled that data down. Yes, the trend appears to be building into a serious cluster for 2028 which may exceed that of 1954. This chart is recording ONLY those quakes that are 6.0 or higher. There are numerous quakes in the 4 to 5 range. It was the 1906 Earthquake that set in motion the Panic of 1907 since the insurance companies were in NYC and the claims were in California. It was JP Morgan who stepped up to save the banks in NY and that became the model for how the Federal Reserve was created with 13 branches to manage the regional capital flows that resulted in the financial crisis in the aftermath of the 1906 San Francisco Earthquake which was a 7.7 on the Richter Scale.
This chart presents the total number of quakes regardless of the magnitude. Here we can see that 1992 was the year with the greatest number of quakes irrespective of magnitude. This is a different perspective entirely. The top chart is what I have called the cluster perspective where we only took into account 6.0 or higher. This illustrates that just like market activity, earthquakes build in intensity. They produce clusters of magnitude. The next serious period should still be 2028.
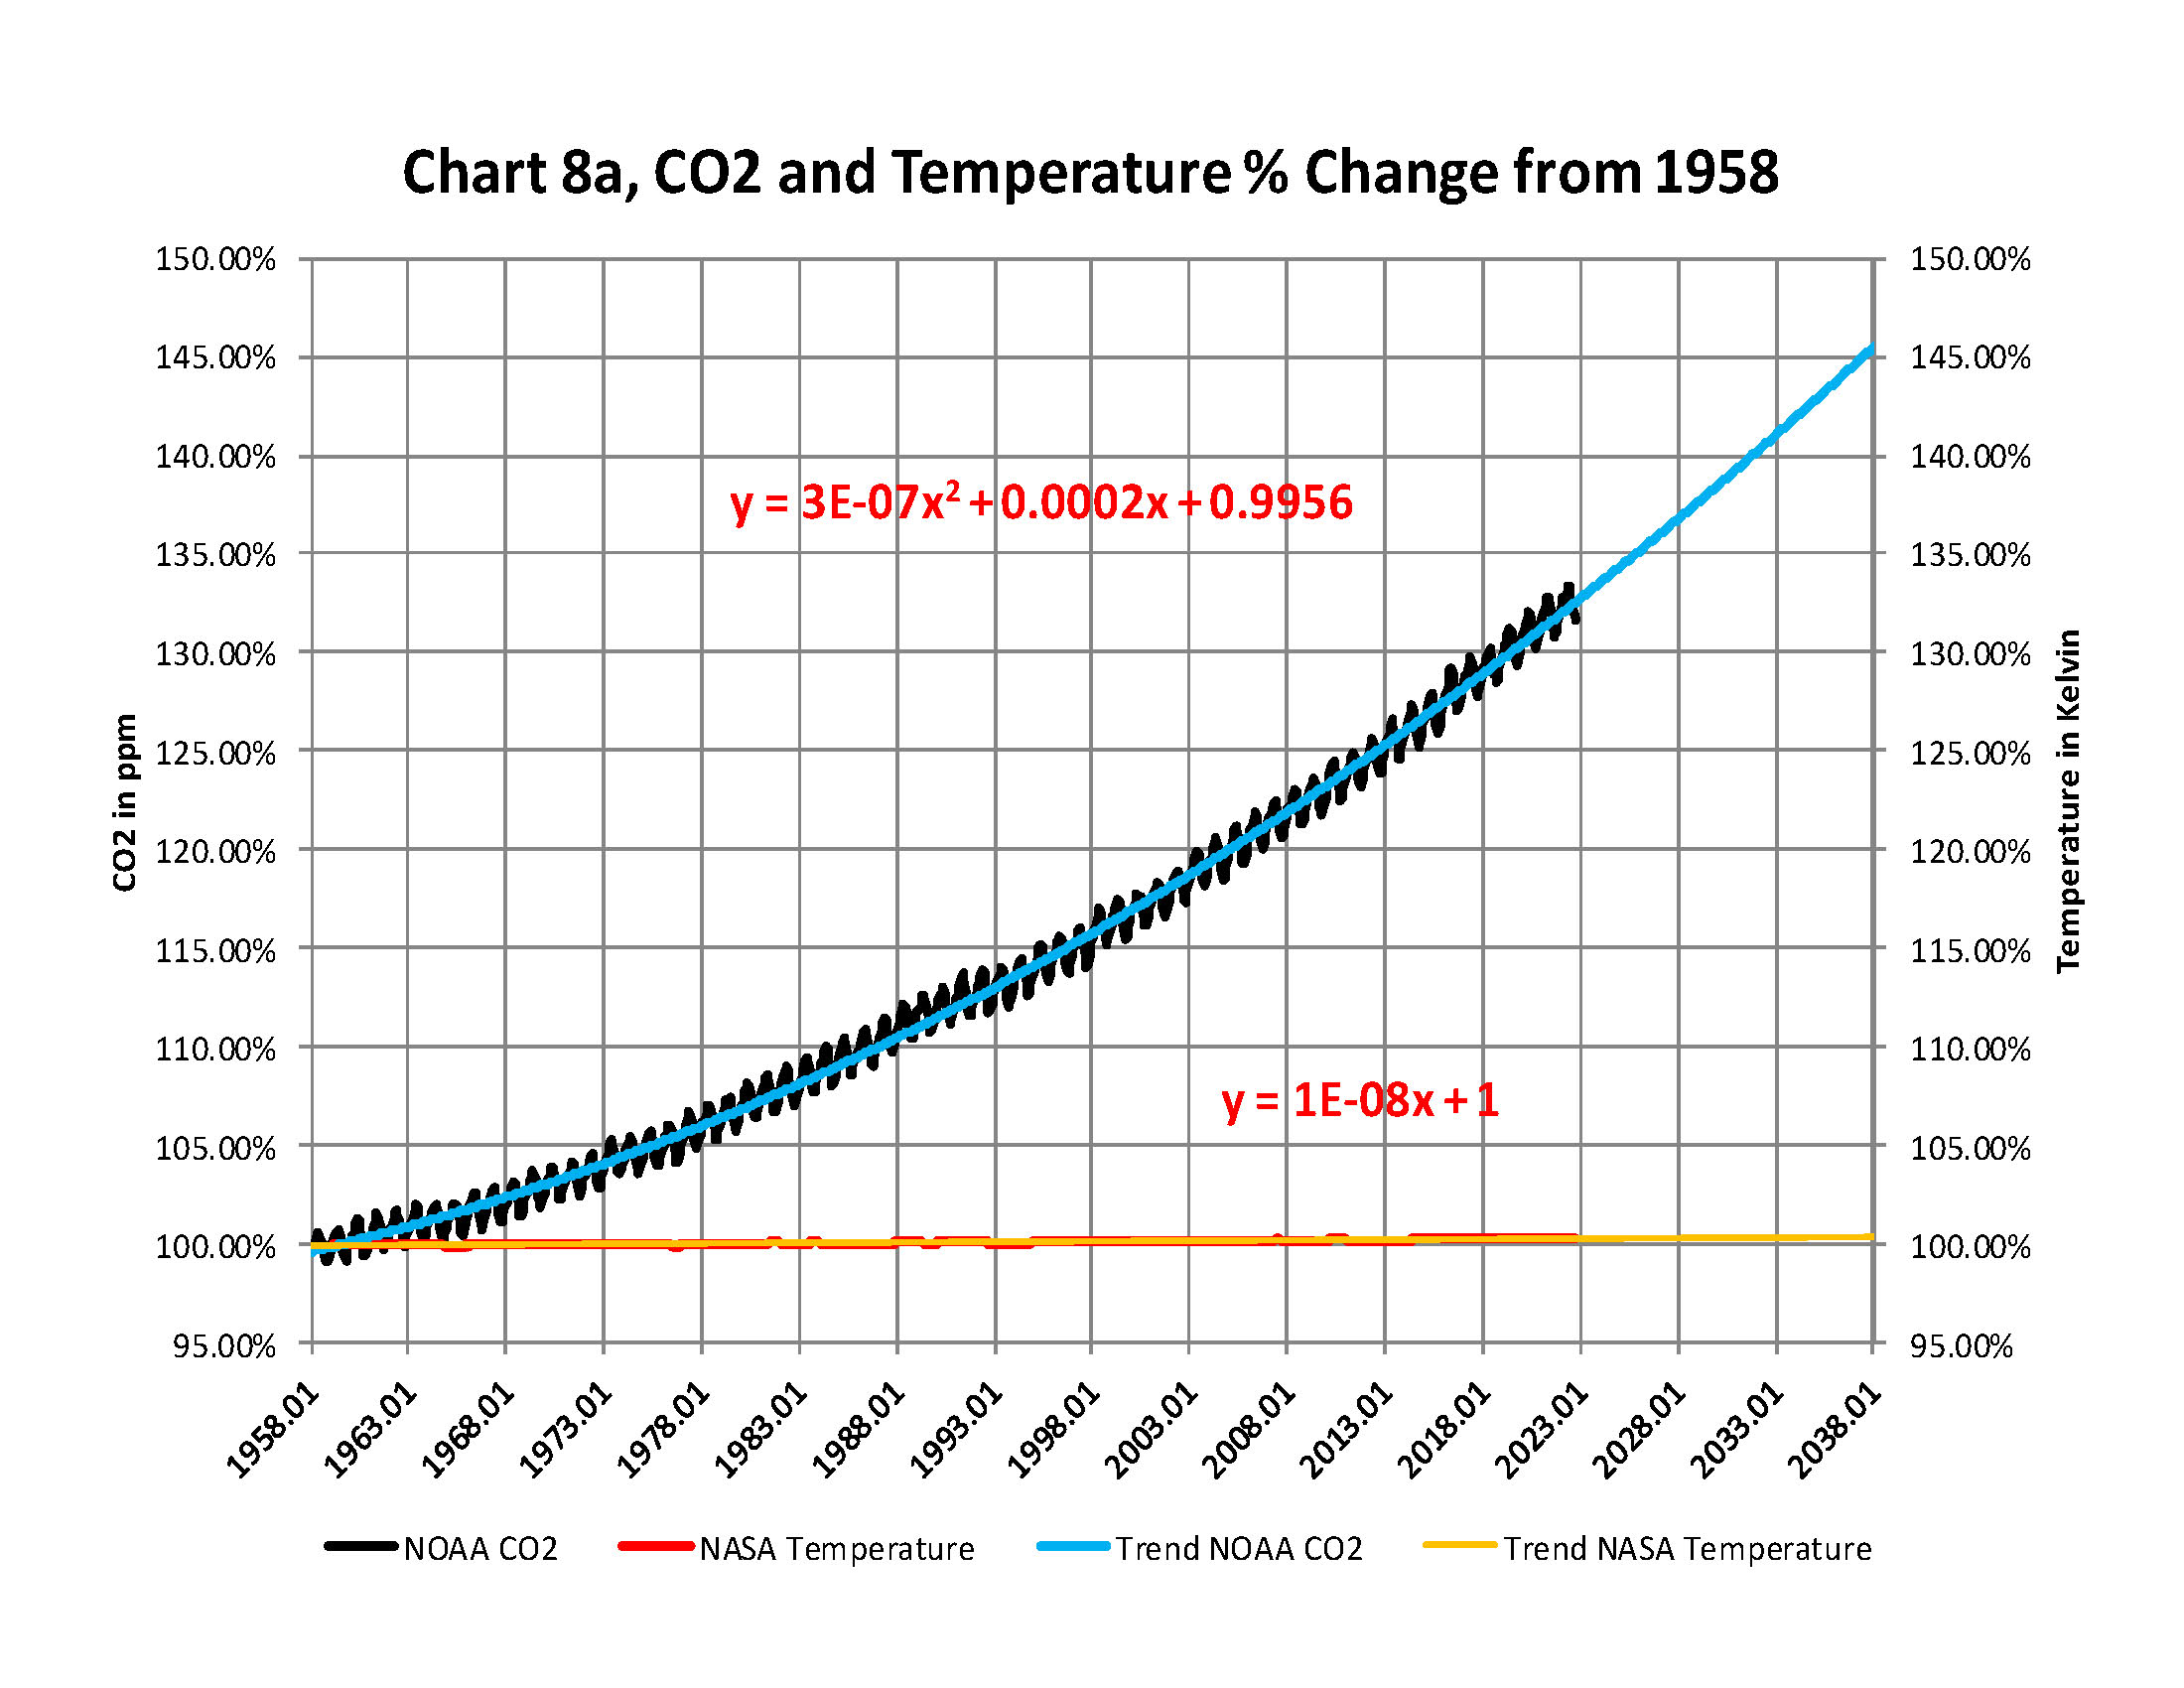
From the attached report on climate change for November 2022Data we have the two charts showing how much the global temperature has actually gone up since we started to measure CO2 in the atmosphere in 1958? To show this graphically Chart 8a was constructed by plotting CO2 as a percent increase from when it was first measured in 1958, the Black plot, the scale is on the left and it shows CO2 going up by about 32.4% from 1958 to November of 2022. That is a very large change as anyone would have to agree. Now how about temperature, well when we look at the percentage change in temperature also from 1958, using Kelvin (which does measure the change in heat), we find that the changes in global temperature (heat) is almost un-measurable at less than .4%.
As you see the increase in energy, heat, is not visually observably in this chart hence the need for another Chart 8 to show the minuscule increase in thermal energy shown by NASA in relationship to the change in CO2 Shown in the next Chart using a different scale.
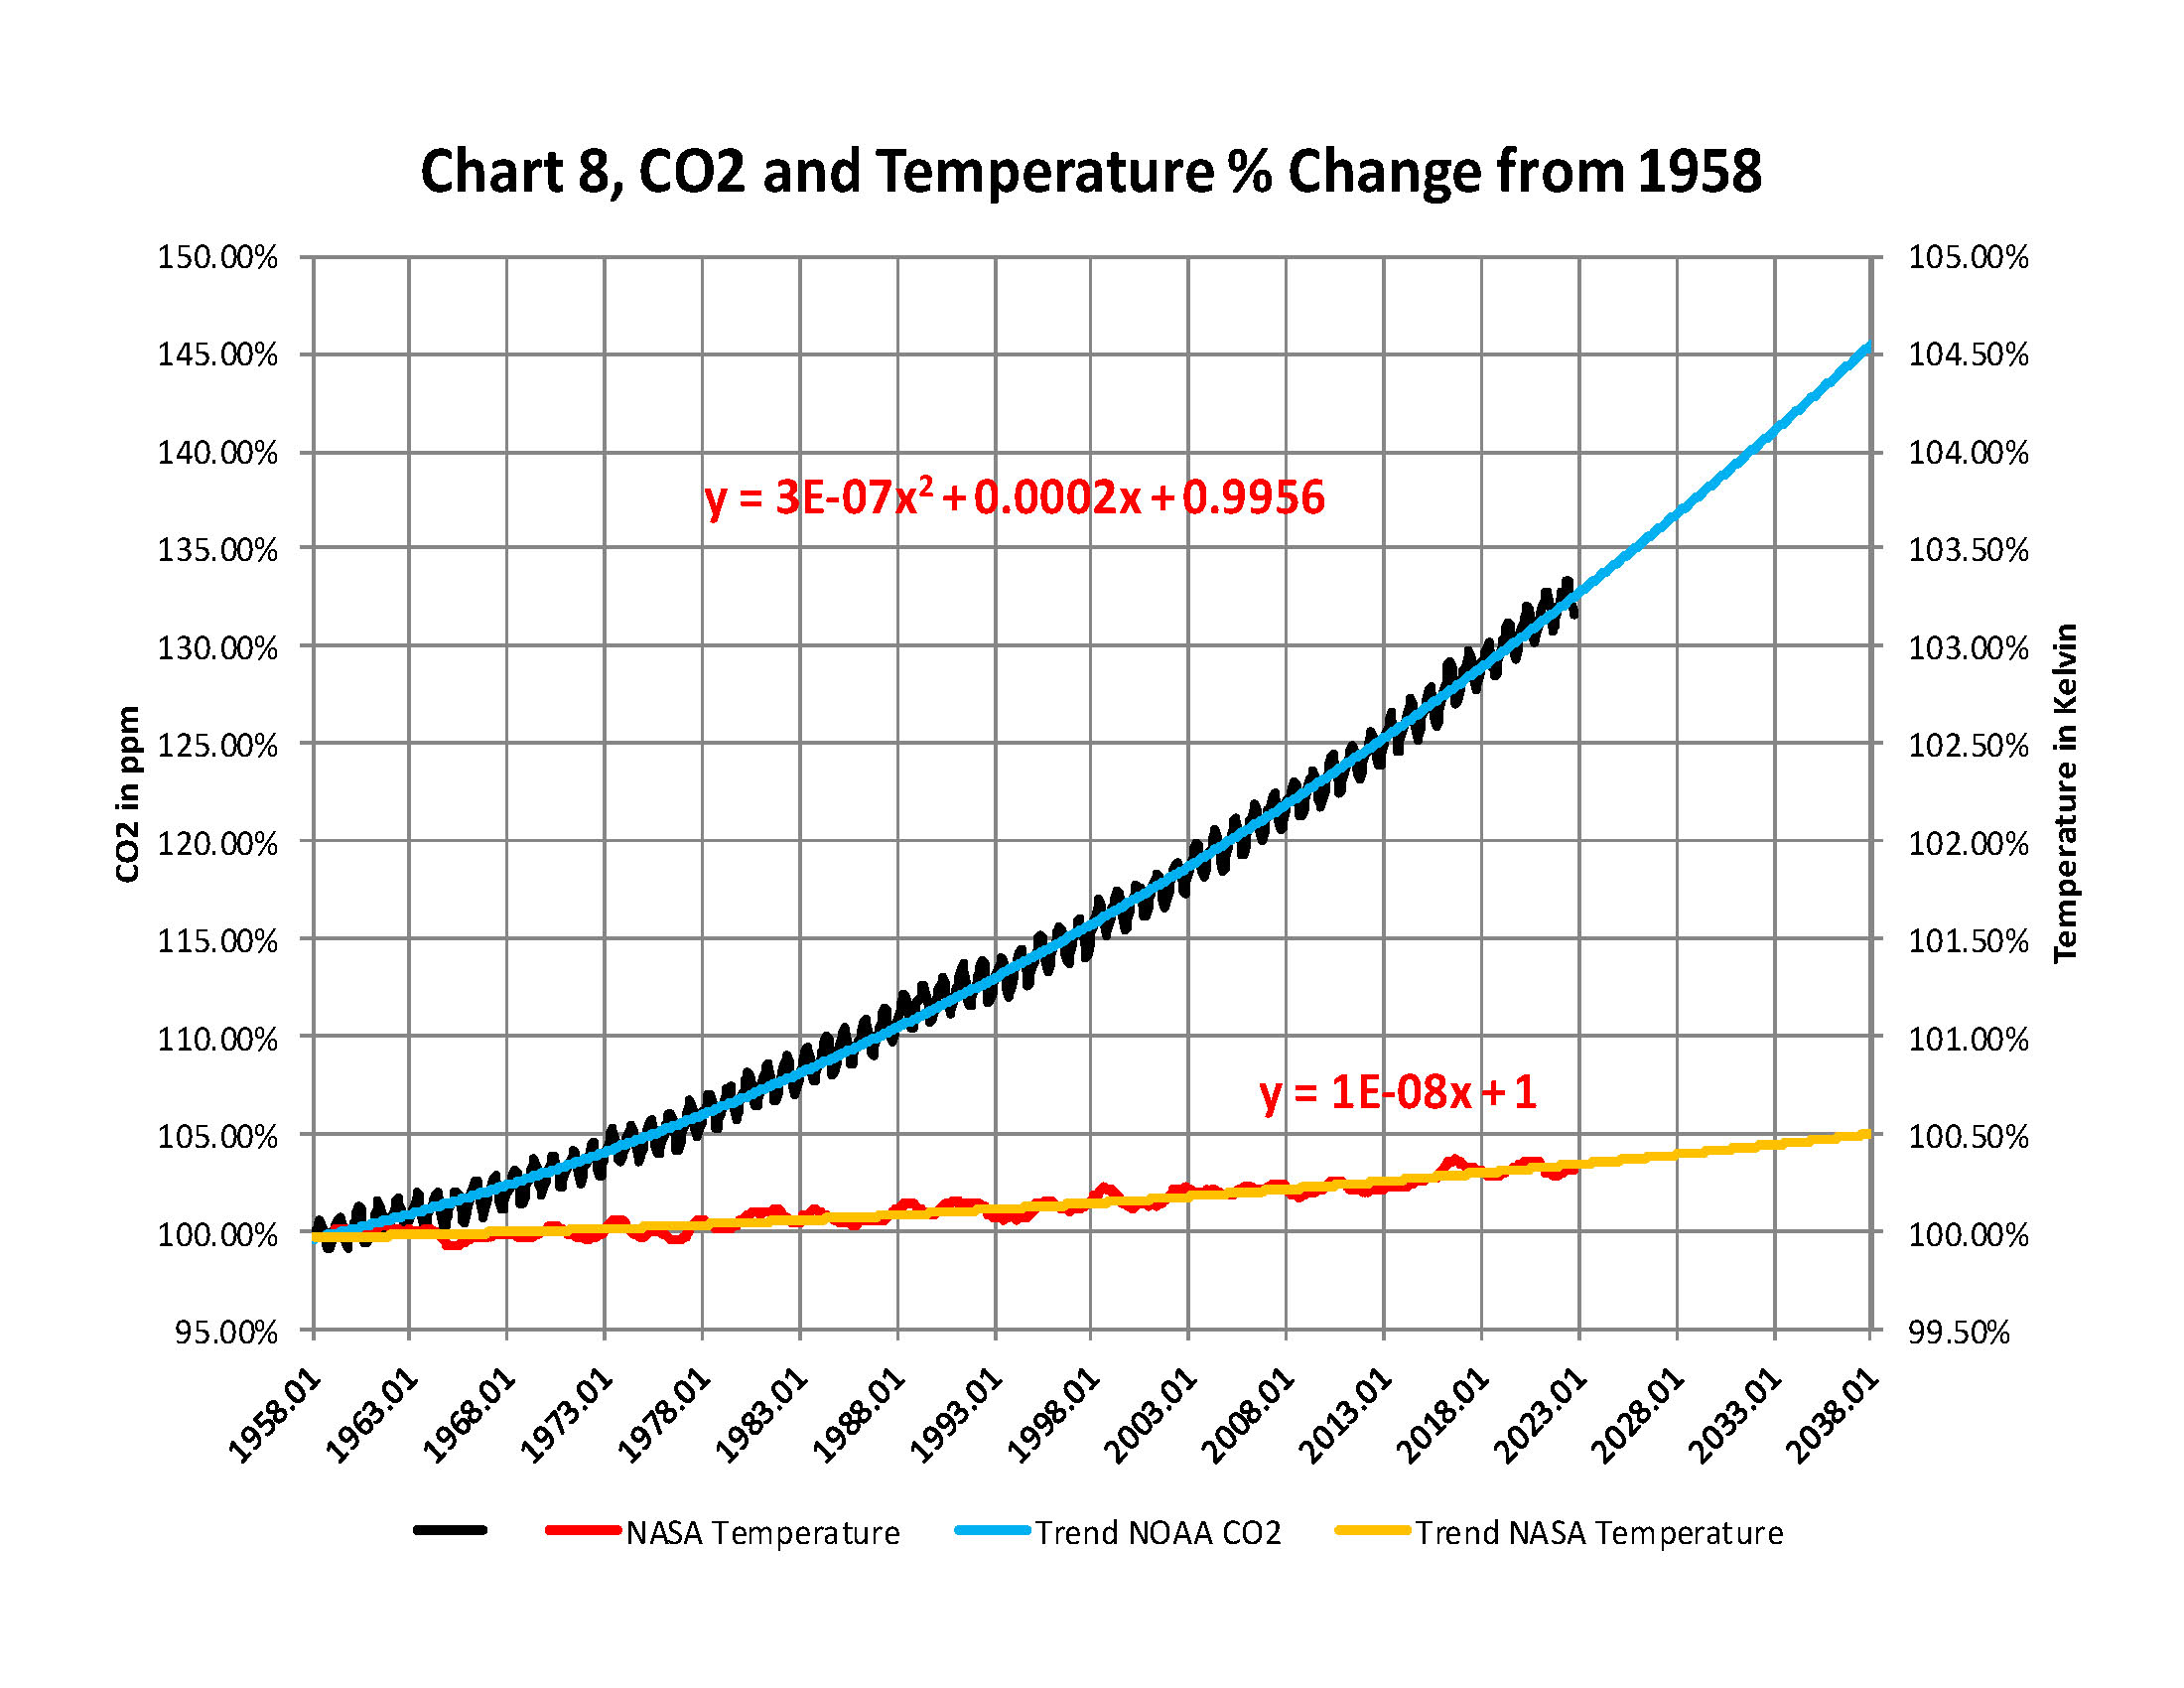
This is Chart 8 which is the same as Chart 8a except for the scales. The scale on the right side had to be expanded 10 times (the range is 50 % on the left and 5% on the right) to be able to see the plot in the same chart in any detail. The red plot, starting in 1958, shows that the thermal energy in the earth’s atmosphere increased by .40%; while CO2 has increased by 32.4% which is 80 times that of the increase in temperature. So is there really a meaningful link between them that would give as a major problem?
Based to these trends, determined by excel not me, in 2028 CO2 will be 428 ppm and temperatures will be a bit over 15.0o Celsius and in 2038 CO2 will be 458 ppm and temperatures will be 15.6O Celsius.
The NOAA and NASA numbers tell us the True story of the
Changes in the planets Atmosphere
The full 40 page report explains how these charts were developed .
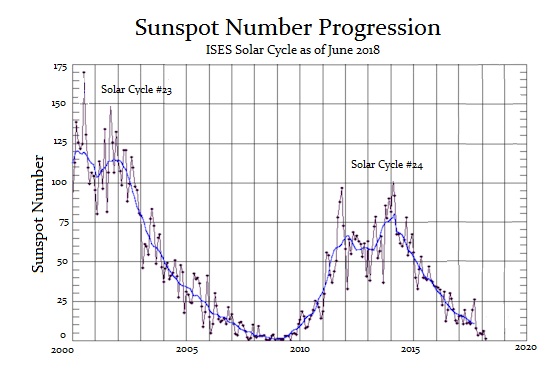
We are now in Solar Cycle 25 with peak sunspot activity expected in 2025. Solar Cycle 24 which ended in December 2019, was of average in length, at 11 years. However, it was the 4th-smallest intensity since regular record keeping began with Solar Cycle 1 in 1755. We’re now in Solar Cycle 25 and we are still in Solar Minimum conditions at this time. Solar Maximum is predicted to occur midway through this cycle which may come as soon as November 2024 but no later than March 2026, with this ideal peak reaching most likely by July 2025.
Right now, the solar wave is conforming more to our model than that of NASA. The Sun has become far more active than NASA has forecast or expected. NASA is beginning to worry that this Solar Cycle 25 could become the Strongest Cycle Since Records Began. Effectively, in terms of our model terminology, Solar Cycle 25 may be a Panic Cycle. In other words, we appear to be headed into the strongest cycle on record following the weakest cycle. That is high volatility in cycle terminology.
So what does this mean for Markets?
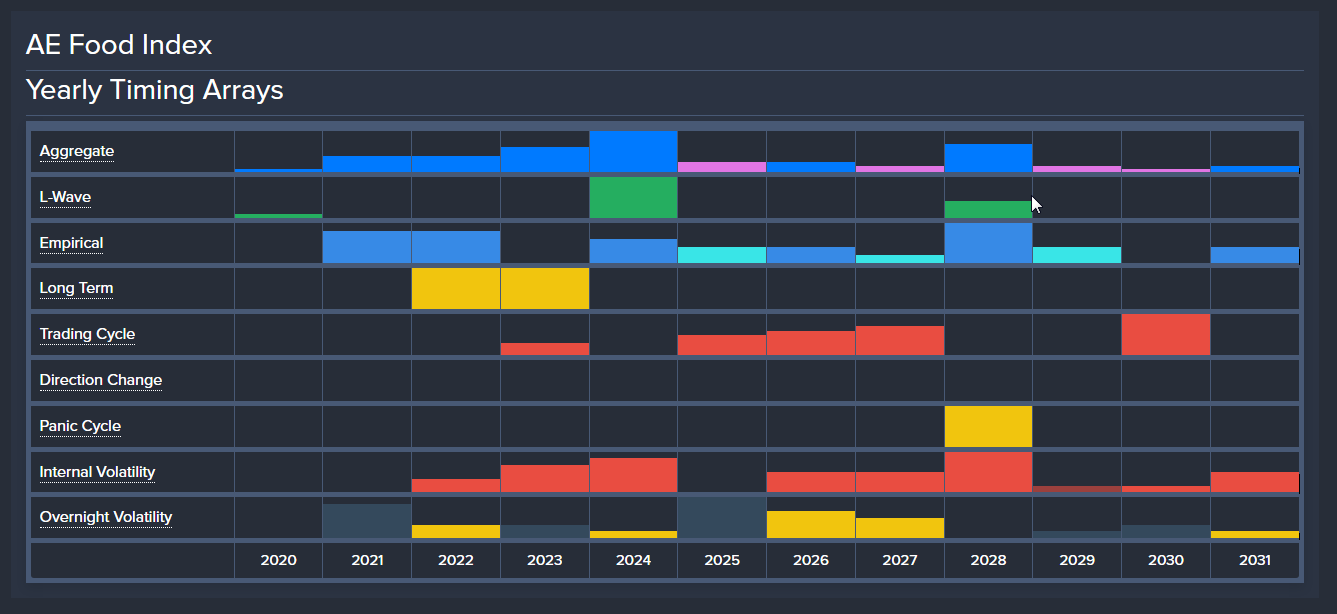
Since this Solar Minimum may continue into 2024, that appears to be a very major turning point on our global food index. Most of our models on markets are showing Panic Cycles in the 2027-2028 time period. That appears to be more war than nature.
I warned that Socrates, which monitors everything around the world, noticed a distinct correlation that more volcanos erupt during Solar Minimum. There have been many studies on the impact of UV and gamma radiation during solar changes and events. Gamma-rays are a form of electromagnetic radiation, as are radio waves, infrared radiation, ultraviolet radiation, X-rays, and microwaves. Gamma-rays can be used to treat cancer, and gamma-ray bursts are studied by astronomers.
I have also reported that our correlation models also show that solar minimums correspond to increased volcanic activity. Volcanic winters take place during solar minimums. It certainly seems that gamma-rays may be the reason volcanoes erupt more during these periods. This certainly also reduces food production and increases disease, presumably because of a rise in malnutrition. However, since gamma-rays are also used to treat cancer, there is at least a basis to warrant further investigation if the increase in gamma-rays during solar minimums impact certain susceptible people or those with particular DNA sequences.
We tend to ignore volcanos since they are not in our backyard. The deadly aspect of these volcanic eruptions is not the loudness of the boom, but how much ash it throws up into the atmosphere which then blocks the sun creating Volcanic Winter.
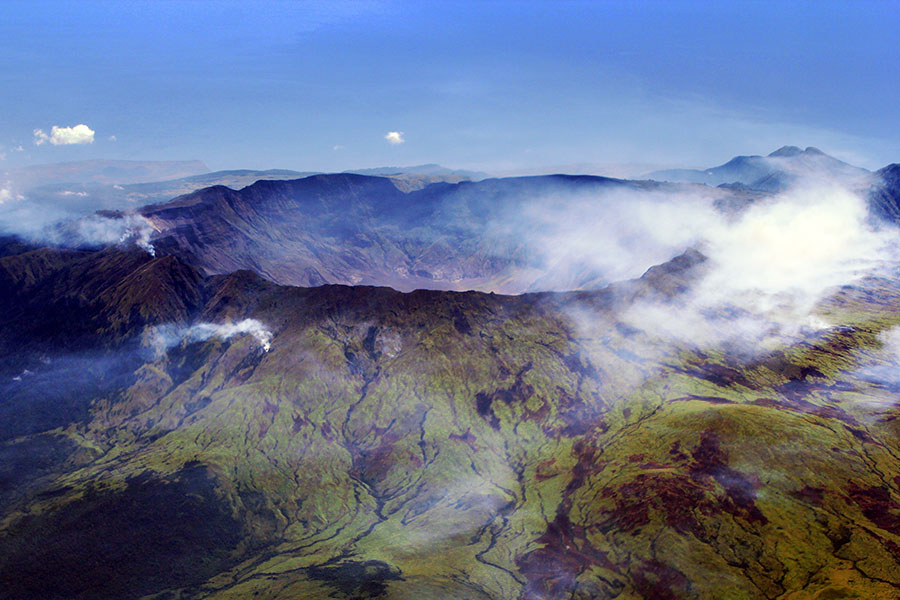
Mount Tambora (VEI 7) erupted in 1816 and threw into the air so much ash that it snowed during the summer in New York City. It became known as 18-hundred-and-froze-to-death. This account from history tells the story that 1816 was a year when the sunlight could not penetrate the natural pollution from Tambora. As a result of a volcanic eruption at Mount Tambora in Indonesia, weather patterns were disrupted worldwide for months, allowing for excessive rain, frost, and snowfall through much of the Northeastern U.S. and Europe in the summer of 1816.
The global cooling altered the natural weather and it resulted in a serious food shortage that set off a mass migration from New England to the Midwest within the USA as people were trying to find the sun. Some saw this as an omen and there was also a religious revival.
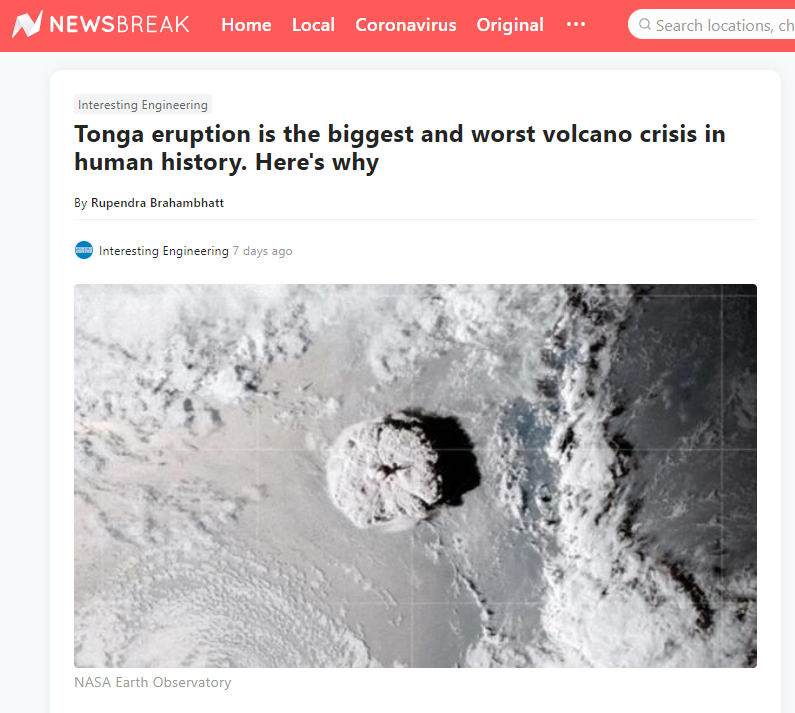
Almost one year has now passed since the Hunga-Tonga-Hunga-Ha’apai volcano erupted (VEI 5). Only now are we starting to realize that this eruption was the biggest volcanic event in human history. They have mapped the 22,000 km(2) area around the Tonga volcano. This has curiously taken place with the weakest solar minimum on record. More significantly, such a major explosion takes about one year before its true impact is understood worldwide.
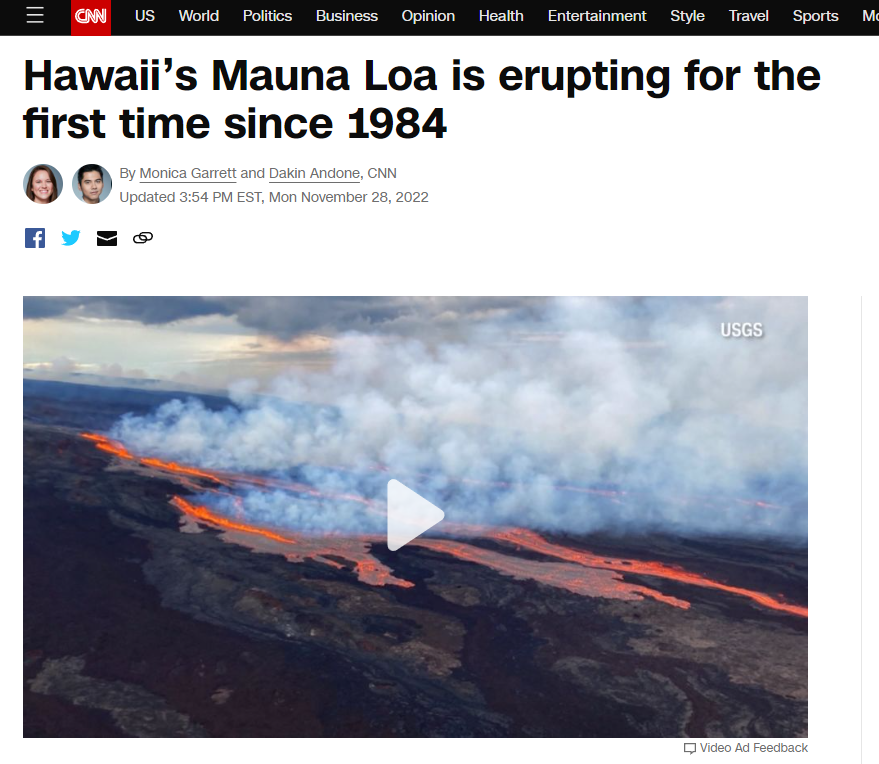
Mauna Loa, which is the largest volcano in the world covers half the island of Hawaii. It has erupted 33 times since 1843 making this an average cycle of 5.4 years. It tends not to be extremely violent as many others. Hawaii’s Mauna Loa has therefore erupted for the first time in decades but nearby, Kilauea is also erupting and both on the archipelago’s Big Island. Dual eruptions haven’t been seen since 1984.
The last eruption took place in 1984, making this prolonged quiet periodthe volcano’s longest in recorded history. More interesting, it is near Kilauea which erupted in 2018. The concern is not this volcano by itself. We are looking around the world at increased volcanic activity for the danger is a volcanic winter coming on top of these shortages manufactured by COVID restrictions.
There has been activity which has been detected in Alaska under what has been an 800-year dormant volcano near Sitka known as Mount Edgecumbe. This volcano was believed to have been extinct since it has not been active for at least 800 years. Earthquakes began earlier this year.
Just in August, in Indonesia, the Anak Krakatau Volcano erupted in Seven Explosions within Two Days. It unleashed 1500-Metre-High Scorching Ash.
The Ahyi Seamount is the largest submarine volcano which lies 449 feet deep in the Pacific Ocean below the Northern Mariana Islands, which are more than 3,700 miles west of Honolulu.
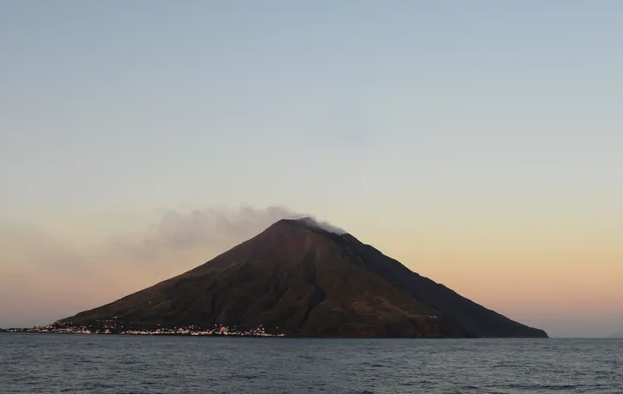
Meanwhile, over in Italy, the Stromboli volcano has also erupted also during October 2022. Several explosions inside of Italy’s Stromboli volcano sent enormous plumes of smoke into the sky and major streams of lava into the Tyrrhenian Sea over the weekend.
Over in Russia, its Shiveluch volcano has become active and now a powerful explosion is considered possible at any moment. It is one of the largest in the Russian far East volcanos recorded and it has had volcanic ash plume rising up to around 13000ft altitude.
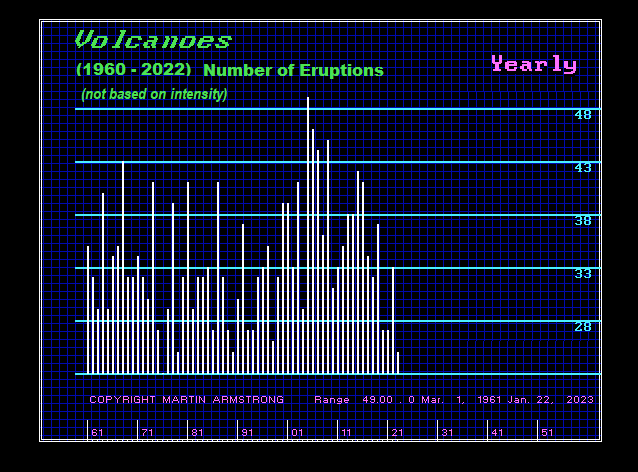
There were 5 eruptions last year around the world at 5 or higher on the Volcanic Explosivity Index (VEI). The first two eruptions here in 2022 were Bezymianny in Russia during May and Popocatépetl in Mexico during June. There was only one in 2020, but 5 during 2019. It appears we are witnessing a rise in global activity that is starting from a general major low in volcanic activity overall.
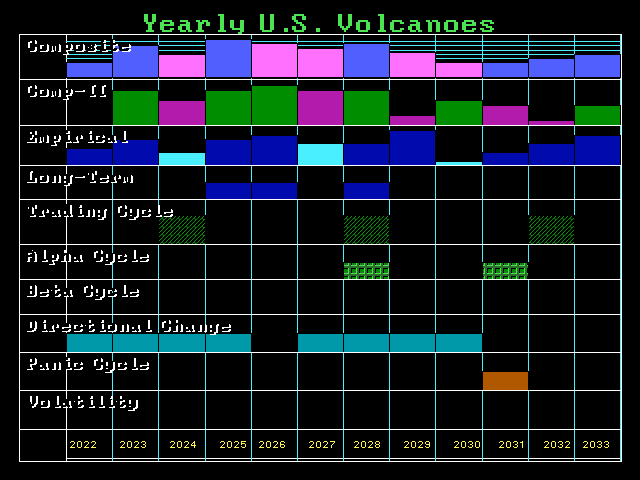
We have a string of Directional Changes between 2022 and 2025. We may be looking at rising volcanic activity into 2025. We will run our models on intensity as well. The undersea Hunga Tonga-Hunga Ha’apai eruption of December 2021 into January 14-15, 2022 was a volcanic explosivity equivalent to VEI 5. It was an eruption of a magnitude greater than the 1991 eruption of Pinatubo in The Philippines. According to a news article, the main undersea international fiber-optic communication cable that had been severed in multiple places due to the eruption had been repaired by February 21, 2022, and internet connectivity was restored the following day.
The sheer magnitudes of this eruption tends to warn that we may in fact witness a very significant rise in both the frequency of eruptions as well as the magnitude into 2025. The VEI describes the size of explosive volcanic eruptions based on magnitude and intensity. The numerical scale (from 0 to 8) is a logarithmic scale, and is therefore similar to the Richter and other magnitude scales for the size of earthquakes.
The largest eruption of magna took place at Yellowstone at Huckleberry Ridge about 2.1 million years ago. Our cycle models on Yellowstone have turned up and the “ideal” target would be in the year 2100. The difference between a VEI5 and VEI6 is a factor of 10 to 100.
Posted originally on the conservative tree house on November 24, 2022 | sundance
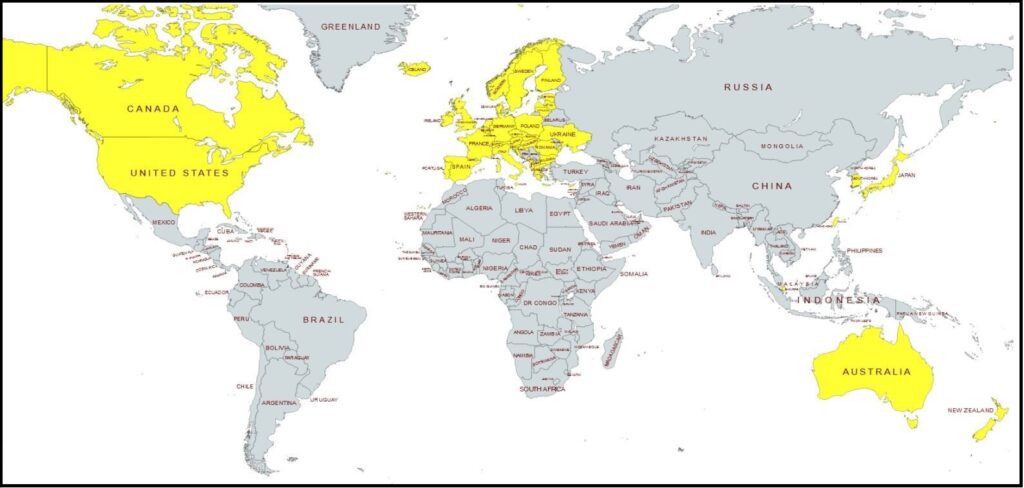
We have been closely monitoring the signs of a global cleaving around the energy sector taking place. Essentially, western governments’ following the “Build Back Better” climate change agenda which stops using coal, oil and gas to power their economic engine, while the rest of the growing economic world continues using the more efficient and traditional forms of energy to power their economies.
Within the BBB western group (identified on map in yellow), the logical consequences are increased living costs for those who live in the BBB zone, and increased prices for goods manufactured in the BBB zone. In the zone where traditional low-cost energy resources continue to be developed (grey on map), we would expect to see a lower cost of living and lower costs to create goods. Two divergent economic zones based on two different energy systems.
This potential outcome just seemed to track with the logical conclusion. The yellow zone also represented by the World Economic Forum, and the gray zone also represented by an expanding BRICS alliance. Against this predictable backdrop we have been watching various events unfold, some obvious and some less so.
Today, we get an obvious example:
NEW DELHI, Nov 24 (Reuters) – Fiat parent Stellantis (STLA.MI) has concluded it can’t currently make affordable electric vehicles (EVs) in Europe and is looking at lower-cost manufacturing in markets such as India, its chief executive told reporters.
If India, with its low-cost supplier base, is able to meet the company’s quality and cost targets by the end of 2023, it could open the door to exporting EVs to other markets, said Carlos Tavares, CEO of the group whose brands also include Peugeot and Chrysler.
“So far, Europe is unable to make affordable EVs. So the big opportunity for India would be to be able to sell EV compact cars at an affordable price, protecting profitability,” Tavares told reporters at a media roundtable in India late on Wednesday.
Stellantis is investing heavily in EVs and plans to produce dozens in the coming decade, but Tavares warned last month that affordable battery EVs were between five and six years away.
On his first visit to India since taking over as Stellantis CEO, he said the company was still working out a plan regarding EV exports from the country and had not yet taken any decisions. (read more)
.
Normally we would expect to see market forces determining the ultimate economic outcome. Historically, we would not expect government policy that puts their nation at an economic disadvantage. However, in this WEF controlled new western economic normal we see multinational corporations’ making decisions and government leaders creating policy to support the corporations.
There is money to be made by corporations within the climate change agenda, and there is money to be made by producing goods with low-cost wages and cheap materials. Eventually, if you keep following this to its natural conclusion, the entire yellow zone becomes a service driven economy.
Multinational corporations in control of government are what the BRICS assembly foresaw when they first assembled during the Obama administration. When multinational corporations run the policy of western government, there is going to be a problem. Brazil, Russia, India, China and South Africa (BRICS) saw President Obama sub-contracting, actually giving away, U.S. trade policy.
In the bigger picture, the BRICS assembly are essentially leaders who do not want corporations and multinational banks running their government. BRICS leaders want their government running their government; and yes, that means whatever form of government that exists in their nation, even if it is communist.
BRICS leaders are aligned as anti-corporatist. That doesn’t necessarily make those government leaders better stewards, it simply means they want to make the decisions, and they do not want corporations to become more powerful than they are. As a result, if you really boil it down to the common denominator, what you find is the BRICS group are the opposing element to the World Economic Forum assembly.
The BRICS team intend to create an alternative option for all the other nations. An alternative to the current western trade and financial platforms operated on the use of the dollar as a currency. Perhaps many nations will use both financial mechanisms depending on their need.
The objective of the BRICS group is simply to present an alternative trade mechanism that permits them to conduct business regardless of the opinion of the multinational corporations in the ‘western alliance.’
Again, if you follow the Build Back Better agenda to its natural conclusion, the entire yellow zone becomes a service driven economy.
The United Nations proposed a new method to funnel money out of developed nations during the COP27 meeting – climate reparations. The United Nations is still negotiating who will pay what, but rest assured, the US will likely pay the most. President Biden fully supports the idea in addition to the $1 billion he was granted last year to fight third-world climate change. China is considered a developing nation, according to the UN, and will not contribute to the global fund despite being the largest polluter in the world.
The ”loss and damage fund,” as it is known, would take money from rich nations in an attempt to change the weather and prevent natural disasters that would take place even if humans did not inhabit Earth. The funds would primarily be sent to countries in Latin America, Africa, and Asia. Fears are sparking that this would act as a confession, and developing nations could sue developed nations and/or businesses for additional compensation.
Trump attempted to get America out of the Paris Accord. The GOP-majority House will likely not vote in favor of this measure. Our best bet is to hope they kick the can down the road until Biden’s term has ended.
From the attached report on climate change for October 2022Data we have the two charts showing how much the global temperature has actually gone up since we started to measure CO2 in the atmosphere in 1958? To show this graphically Chart 8a was constructed by plotting CO2 as a percent increase from when it was first measured in 1958, the Black plot, the scale is on the left and it shows CO2 going up by about 32.4% from 1958 to October of 2022. That is a very large change as anyone would have to agree. Now how about temperature, well when we look at the percentage change in temperature also from 1958, using Kelvin (which does measure the change in heat), we find that the changes in global temperature (heat) is almost un-measurable at less than .4%.
As you see the increase in energy, heat, is not visually observably in this chart hence the need for another Chart 8 to show the minuscule increase in thermal energy shown by NASA in relationship to the change in CO2 Shown in the next Chart using a different scale.
This is Chart 8 which is the same as Chart 8a except for the scales. The scale on the right side had to be expanded 10 times (the range is 50 % on the left and 5% on the right) to be able to see the plot in the same chart in any detail. The red plot, starting in 1958, shows that the thermal energy in the earth’s atmosphere increased by .40%; while CO2 has increased by 32.4% which is 80 times that of the increase in temperature. So is there really a meaningful link between them that would give as a major problem?
Based to these trends, determined by excel not me, in 2028 CO2 will be 428 ppm and temperatures will be a bit over 15.0o Celsius and in 2038 CO2 will be 458 ppm and temperatures will be 15.6O Celsius.
The NOAA and NASA numbers tell us the True story of the
Changes in the planets Atmosphere
The full 40 page report explains how these charts were developed .
I have created this site to help people have fun in the kitchen. I write about enjoying life both in and out of my kitchen. Life is short! Make the most of it and enjoy!
This is a library of News Events not reported by the Main Stream Media documenting & connecting the dots on How the Obama Marxist Liberal agenda is destroying America