California Economy Declining Significantly


California is the center of the far left which takes the position that even undocumented aliens can hold a position in government, they support sanctuary cities, and of course, they are the major movement in the New Green Deal initiative. Berkeley, California banned natural gas which is a clean fuel requiring homes to be powered by solar and electricity, that is normally twice the cost of natural gas. Then they hired a guy to enforce it and gave him a salary of  $273,341 annually to start – plus pensions.

The state is mandating that beginning next year, every new home must be fitted with solar panels, raising the cost of a new home by at least $10,000. Higher home prices, higher electric bills, fewer choices are hoped to reduce population growth. The claimed logic behind the Berkeley ban maintains that they can help the planet and reduce carbon emissions by eliminating natural gas and switching to electric heating and cooking. This is erroneous since the electric grid is powered predominantly by fossil fuels. The state prides itself on having very little coal use, but it imports electricity from neighboring states like Utah and Arizona where it is generated by coal. The scam is to buy electricity from other states displacing the emissions from California and pretending they are a “Green” state, provided you do not look too close.

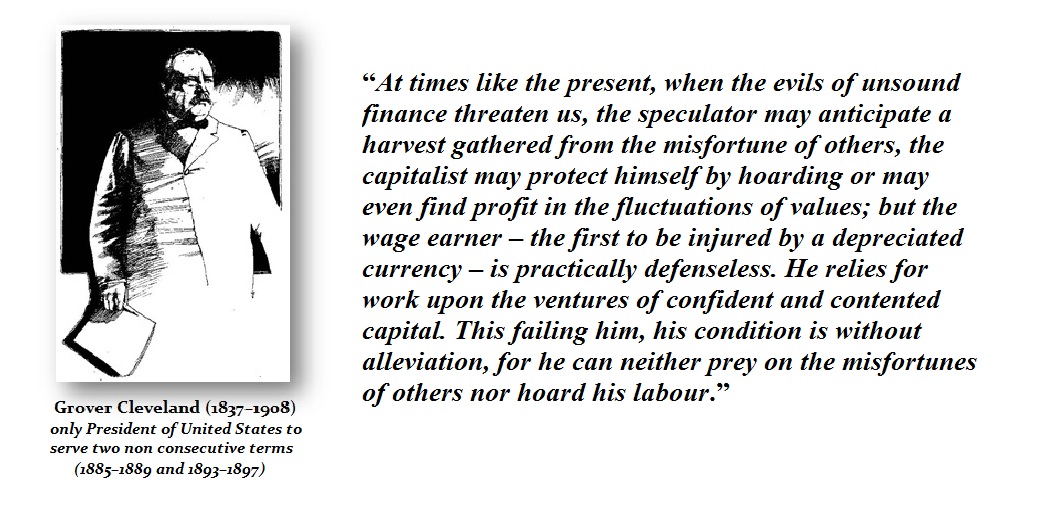
The environmentalists are now pushing 50 other cities to follow the lead of Berkley.  It’s no wonder families are fleeing the state, and that California is led only by New York in out-of-state-migration. The worst of all is who can migrate. During the Panic of 1893, President Grover Cleveland made a critical observation. Raising taxes hurts the average person for the “rich” can leave and export their wealth. The average wage-earner cannot export their labor. All the studies show that people who earn more than $1 million a year are much more likely to migrate than any other class. Even the Governor of New York Governor Andrew Cuomo has made the same observation and warned that raising taxes on the rich only results in their migration from the state.

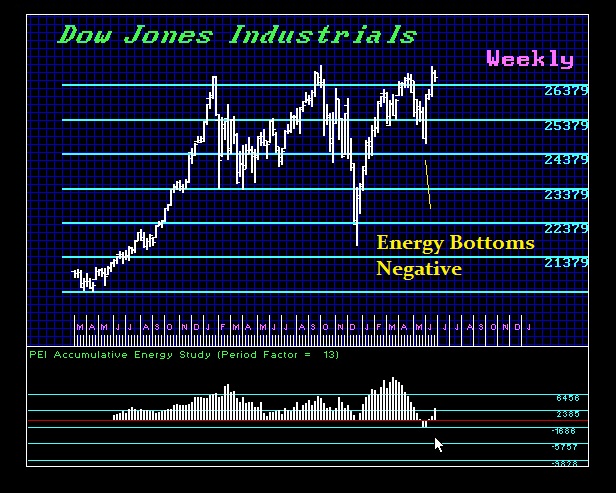
California’s economy looks like that of France or Germany whereby the peak in economic growth was 2000. We can also see that the last peak was 2015 perfectly in line with the Economic Confidence Model. The long-term projections for California are actually lining up with the European Union and this seems to imply that the adoption of such socialistic policies that ignore economics is detrimental long-term. Even CALPERS, California pension system for state employees, was directed to invest in “green” projects for political reasons and lost. They have been trying to cover-up their politically correct investment decisions.


The Worst Heatwave was the 1930s


QUESTION: Marty, wasn’t the Dust Bowl the worst heatwave in history?

DL

ANSWER: Yes, you are correct. Despite the hype this weekend, the heatwave is nowhere near historical records. The peak was the 1930s which created the Dust Bowl. The agenda is clear and these people will use every heatwave to end civilization as we know it. We even have AOC claiming we will all die in 12 years unless we surrender all cars and airplanes and stay home and just read books because even the TV and internet require power generation.

These people have put out a warning using this weekend’s heatwave.

We must act decisively to cut
heat-trapping emissions to defend
ourselves against a gravely hot future.

Their Report: killer-heat-analysis-full-report.pdf

It’s the Volatility – not the Temperature!


QUESTION: Mr. Armstrong, in relating your comments on weather and how the winters will spike to record cold and then the summers will spike to record highs, is this the same as a panic cycle in markets?

HC

ANSWER: Yes. Our computer looks at the weather the same as it does with the price in a market. Patterns emerge and you can understand the causes ONLY by correlating the trends with everything else. This is indeed a Panic Cycle where we exceed the previous high and penetrate the previous low. This coming weekend will see temperatures break 100 in the Northeast. I have lived in New Jersey and there were plenty of summers where we have days at 103. This is NOT abnormal. What is abnormal is the volatility how we can go from a winter where it was colder in Chicago than it was in Antarctica and then we break the record highs in July. It is the VOLATILITY – not the empirical level of temperature we should be paying attention to

Cycles, Einstein & Galileo – Geometry of Time


QUESTION: Mr. Armstrong; It has dawned on me studying Einstein’s General Relativity, that the two of you reached the same realization from different fields. Newton’s laws of gravity were turned upside down by Einstein who rejected Newton that there was a linear formation to space. Einstein came up with the fact that space was curved and that time and space were linked so that time was not the same throughout the universe. In reading the few chapters on the Geometry of Time you handed out at I think was the 2011 WEC, your entire process is also linking the curvature and time albeit from a different observation than Einstein.

Would you elaborate?

GDM

ANSWER: According to Einstein’s theory of general relativity, massive objects warp the spacetime around them, and the effect a warp has on objects is what we call gravity. So, locally, spacetime is curved around every object with mass. However, what led Einstein to his discovery was the question of free fall. Before I had ever ready Einstein, I was probably about 12 years old and I fell out of a tree and over a cliff falling probably a couple of hundred feet. I was lucky and it was Fall so at the base of the cliff was a mountain of leaves. The leaves broke my fall but my teeth nearly came through my bottom lip. The wind was knocked out of me and my nose was bleeding. I went to my friend’s house nearby and finally got my nose to stop bleeding. I kept tasting blood. I opened my mouth and saw the injury and only then did it start to hurt. It was a good 30 minutes. I went to the hospital and they stitched me up.

Two things dawned on me that day. First, I asked why did my mouth not hurt until I saw I was insured? Secondly, when I was falling, I did not feel like a dead weight, but I felt like I was flying – weightless.

Because of that incident, I came to realize that there was some truth to the saying what you do not know, can’t hurt you. But it also gave me insight into what Einstein was talking about. In the middle of a free fall, you feel weightless as if gravity has canceled itself out. Actually, Aristotle first tried to reason that a heavy object will fall faster than a light object in a free fall. He was incorrect. Galileo was the first to actually get it right. He realized that a falling body picked up speed at a constant rate.Galileo also made the observation that in a vacuum, all bodies fall with the same acceleration. That was a truly astonishing idea. That experiment was carried out on the moon with a hammer and a feather. They both fell to the ground at the same time.

Yes, these things influenced me in seeing what I called the Geometry of Time in how and why do trends unfold and what are their durations? Was there a constant force at work, or were there patterns of time within time? This is an extremely complex subject. Far too much for a blog post. I will publish that work in 2020.


Understanding the Energy Model


QUESTION: Hi Marty

I try not to bother you with questions, I know you’re plenty busy answering much more complex questions but I’m wondering if you could explain energy in the markets a bit?

I always watch for divergences in energy and price (both positive and negative), or fading energy during a rally, or a random jump in energy during a consolidation period but I can’t stop thinking about your last private blog where it can’t crash if the energy is negative… so only if it’s peaking? So should someone be cautious if the energy starts getting high? Does that also mean if it’s negative it has more potential to swing to the upside?

Here on bitcoin energy peaked after price peaked, which leaves me confused again, what does that mean? And both Bitcoin and Netflix and others I’ve found had a panic to the upside when the energy went negative, is this more of a rule, or are these exceptions?

And the million dollar question, are there other things I should be watching when it comes to energy? I’m sure there is still much I don’t know

Thank you,
NS

ANSWER:  The Energy Model is measuring the bulls against the bears. It is providing a different measurement of how much “energy” remains in the market from the long-side. Therefore, if people are recently long, i shows to what extent that represents the whole of the market position. A crash is possible when energy is at a high level and a rally is likely when energy is negative.

In the case of Bitcoin, the market failed to make a new high with the new high in energy. That was the divergence warning that this was a top. In Netflix, the market was bottoming and the energy turned negative. Again, because the energy was negative, that effectively means the liquidation is over. It is impossible to get a panic crash without energy still in the positive. The risk will be to the upside when the energy is negative.

Now, let’s look at the Dow. You can see that energy bottomed negative three weeks from the breakout. This, again, warned there would be no crash as everyone was predicting. The Energy Indicator is an excellent tool in judging the risk in a market from a purely numerical perspective — not opinion.


France Slaps Eco-Tax on Departing Air Passengers, because…Climate Change


Published on Jul 12, 2019

TS Barry – Possible Hurricane Barry – Louisiana and Mississippi Prepare for Extreme Flooding…


The latest storm advisory from the National Hurricane Center still shows Louisiana as the most likely impacted region of the northern gulf coast. Tropical Storm Barry will likely become Hurricane Barry shortly before landfall.  Severe flooding is the largest concern.

National Hurricane Center – At 4:00pm CDT (2100 UTC), the center of Tropical Storm Barry was located near latitude 27.8 North, longitude 89.3 West. Barry is moving toward the west near 5 mph (7 km/h) and this motion is expected to continue tonight. A turn toward the northwest is expected on Friday, followed by a turn toward the north on Saturday.

On the forecast track, the center of Barry will be near or over the central or southeastern coast of Louisiana Friday night or Saturday, and then move inland into the lower Mississippi Valley on Sunday.

Maximum sustained winds are near 40 mph (65 km/h) with higher gusts. Strengthening is expected during the next day or two, and Barry could become a hurricane late Friday or early Saturday when the center is near the Louisiana coast. Weakening is expected after Barry moves inland. (more)

.

Advertisements

Barry? Head’s Up Louisiana and Northern Gulf Region…


A storm is gaining strength in the northern Gulf of Mexico and the National Hurricane Center is now predicting organization to hurricane strength late Friday. If you live in a gulf coast community pay attention to storm updates.

At 1000 PM CDT (0300 UTC), the disturbance was centered near latitude 27.7 North, longitude 88.0 West. The system is moving toward the west-southwest near 9 mph (15 km/h). A motion toward the west is expected on Thursday, followed by a west-northwest motion on Friday and a northwestward motion by early Saturday. On the forecast track, the system is expected to approach the Louisiana coast this weekend.

Maximum sustained winds remain near 30 mph (45 km/h) with higher gusts. Strengthening is forecast during the next couple of days, and the disturbance is forecast to become a tropical depression early Thursday, a tropical storm by late Thursday, and a hurricane by late Friday. (LINK)

Ryan Kruger

@Ryan11Alive

We’re keeping an eye on the tropics on https://www.11alive.com/article/weather/hurricane/developing-tropical-system-forecast-to-make-landfall-this-weekend/85-8d061f04-d28f-4dc3-ba97-48ce54489137 

Developing tropical system forecast to make landfall this weekend

The National Hurricane Center forecasts this system to become a category one hurricane when it makes landfall in Texas or Louisiana

11alive.com

See Ryan Kruger’s other Tweets

Why is Weather Analysis so Corrupt?


Lorenze

QUESTION: Your correlations about the weather have been very interesting. What I understand is that as the climate has shifted into solar minimum, the weather gets more volatile with colder winters and spike heat waves in summer that decline in duration. Then for some reason, this is also the same period when volcanoes become more common. Do you have any idea why there seems to be such stubbornness in viewing history and correlating the data for what it simply is?

MF

ANSWER: I believe the problem stems from this idea of linear thinking which so many use in these fields to the exclusion of just looking at the data. As I have explained before, Chaos Theory emerged from studying weather. The Father of Chaos Theory is Edward Norton Lorenz (1917–2008) who was an American mathematician and meteorologist. Lorenz was certainly THE pioneer in Chaos Theory. A professor at MIT, Lorenz was the first to recognize what is now called chaotic behavior in the mathematical modeling of weather systems.

During the 1950s, Lorenz observed that there was a cyclical non-linear nature to weather, yet the field relied upon linear statistical models in meteorology for weather forecasting. It was like trying to measure the circumference of a circle with a straight-edge ruler. His work on the topic culminated in the publication of his 1963 paper Deterministic Non-periodic Flow in the Journal of the Atmospheric Sciences, and with it, the foundation of Chaos Theory. During the early 1960s, Lorenz had access to early computers. He was running what he thought would be random numbers and began to observe a duality of a hidden repetitive nature. He graphed the numbers that were derived from his study of convection rolls in the atmosphere. What emerged has been perhaps one of the most important discoveries in modern time.

LORENZ (3)

This illustration of the Lorenz Strange Attractor is incredibly important and was first reported in 1963. Lorenz’s discovery of a strange attractor was made during an attempt to create a model of weather patterns. The actual experiment was an attempt to model the atmospheric dynamics of the planet. It involved a truncated model of the Navier-Stokes equations. It is a visual example of a nonlinear dynamic system corresponding to the long-term behavior in a cyclical manner. It reveals a hidden order we cannot otherwise observe.

Those who support global warming ignore all evidence of nonlinear activity in the weather. The Lorenz Attractor is proof beyond a shadow of a doubt that there is a hidden order to weather. They are ignorant of how to do research and have been manipulating the data to pretend that they are correct to the detriment of society. Government hands them billions for fake research so they can justify raising taxes. Just follow the money.

Global Warming | Bjorn Lomborg | Oxford Union


OxfordUnion

Published on Nov 8, 2013
Bjorn Lomborg talks about solutions to global warming. SUBSCRIBE for more speakers ► http://is.gd/OxfordUnion