Posted originally on Jun 5, 2025 by Martin Armstrong
This is the first installment for our Institutional Clients concerning the two countries at the greatest risk of DEFAULT – Japan and Germany. We have provided the forecast for Japan’s default and explained in detail the internal battle between the Government, the Bank of Japan, and the Private Sector. This report exposes the truth about who holds what and the threat to instability as Japan also tries to cozy up close to NATO as a diversion for its fiscal mismanagement.
Investors have long fretted about the sustainability of Japan’s government debt as other nations, including Germany, are facing unsustainable fiscal mismanagement across the developed world. Japan has garnered the most attention due to its highest debt load relative to economic output and the heaviest debt-service burden. At the same time, the excuse has been that they are mostly self-funded, and as such, appearances are deceptive. Still, all Western nations are on a collision course with a sovereign debt crisis that will bring them all crashing down when the line at the door stops buying the new debt to roll over the old.
Japan’s fiscal mismanagement is not significantly worse than that of others. The pandemic, climate change, sluggish growth, and financial crises, accompanied by a lack of confidence, have led to an increase in government debt for many wealthy countries. At more than 250% of GDP, Japan’s gross debt stands out. Combined with sluggish growth and a shrinking population, many financiers and economists see it as an existential risk. The real question this report addresses is the real story behind the curtain, and when does this come to a head?
Posted originally on May 31, 2025 by Martin Armstrong
QUESTION: Marty, There seems to be a growing trend with States approving gold and silver coins as acceptable payment methods. You have always said that it would be coins and not bars. However Florida now states that the silver must be 99% pure. How will this affect the pre 65 constitutional coins like dimes, quarters and half dollars generally referred to a junk silver? Junk silver coins will of course be worth more if the price of silver increases however it appears that one may not be able to use them for any daily transactions. Would one be better off selling their junk silver and converting it to silver rounds immediately? What does Socrates or Socrates Jr think on this topic as it is certainly a new wrinkle. Thanks ! JimJ
ANSWER: I understand the act, and it only illustrates my point that when it comes to a silver bar, 99% of the people out there would NEVER know the difference between that and a bar of Nickel. That’s what I said; I prefer the pre-1965 silver coins because the average person can easily identify the date. They are ALREADY legal tender. So they are not demonetizing the silver coins.
The Roll of 20 – 2025 $1 American Silver Eagles are 99.9% silver. However, they are denominated as $1. This may be more confusing to the average smuck on the street. Personally, I have bags of silver coins, and I have a hoard of $20 gold coins that came from a central bank, which found them tucked away in the basement vault. They are all uncirculated 1924 Saints. This was a private offering.
Posted originally on May 30, 2025 by Martin Armstrong
Happening now: @GovRonDeSantis is in Apopka to sign HB 999 which “sets in motion #Florida’s full recognition of gold and silver as legal tender, giving Floridians the freedom to use precious metals for everyday transactions alongside traditional currency.”https://t.co/fRkQpDJE7Dpic.twitter.com/dOMajgwAsj
Florida Governor Ron DeSantis has declared gold and silver legal tender. HB 999 maintains that these precious metals may be used in payments if they meet specific purity standards. The bill goes into effect on July 1, 2026, but many are confused as to what this will entail.
As stated in the legislation: “Legal Tender; Revising the sales and use tax exemption for certain coin or currency; specifying that a person who claims the sales tax exemption bears the burden for determining whether the gold coin or silver coin meets a specified definition; providing a presumption regarding the purity requirements of gold coin and silver coin, etc.”
“We are the first large state to step up and to get this done,” DeSantis said. “And this is right out of the Constitution of the United States. So this legislation will authorize money services business like check cashers or PayPal to transmit and accept payment in gold and silver.” State Rep. Bill Bankson sponsored the bill with the goal to “eliminate the tax burden and make it a functional means of transaction between willing parties.”
To begin, Florida is not the first state to declare gold and/or silver legal tender. Utah passed the Utah Legal Tender Act of 2011, which declared coins of either metal legal tender. Oklahoma passed Senate Bill 862 in 2014, recognizing U.S.-minted gold and silver coins as legal tender and exempting them from taxation. Kansas and West Virginia have similar policies. Texas has recognized these coins as legal tender and enacted legislation to protect them from state seizure. Wyoming treats gold and silver as currency and has exempted it from sales tax. South Carolina and Louisiana have similar policies.
Florida’s approach is a bit more structured. Gold coins must be at least 99.5% pure and silver coins at least 99.9% pure to qualify as legal tender. The weight and purity must be imprinted on the metal with the name or symbol of the mint refiner. Both will be exempt from sales tax. The state government may choose to accept silver and gold coins for payments on taxes, dues, charges, and debts. Yet, these transactions must be done electronically, and the coins will be held by a public depository while processing. A regulatory regime will be established to handle coinage, process insurance, record-keeping, licensing, and consumer disclosure agreements, which the Office of Financial Regulation will oversee.
Will Floridians see people using silver coins to check out at the grocery store? No. The law entails that payments in gold and silver coinage are entirely optional, and no person or business is required to accept them in payments. Merchants will not be required to attain knowledge on metal purity or have scales behind the cash register. The difference now is that businesses are allowed to accept them if they choose to do so. There are numerous tax benefits to choosing metal over cash.
If John Doe wants to purchase a boat from a dealership with gold, for example, the dealership must voluntarily accept the coinage but is in no way obligated to do so. Then the dealership has the burden of verifying the spot price of gold or silver rather than the state. However, if you go to a bank to cash a check, the bank will have the ability to offer clients payments in gold or silver coinage rather than cash. Another aspect to consider is that Florida will no longer add a sales tax on transactions in gold and silver, lowering the cost for businesses and consumers by around 6%.
This signals the ongoing loss of confidence in the federal government. States are rebelling against federal mismanagement and offering residents alternatives to move off the grid. People tend to hoard gold and spend paper. Gold and silver are not practical as daily commerce but are a symbolic store of wealth. We are entering a phase where sovereign debt will become toxic, and states will begin to prepare for the inevitable chaos coming from Washington.
originally on Posted May 30, 2025 by Martin Armstrong
The US economy contracted by 0.2% from January through March of 2025. This is the second Q1 estimate provided by the US Commerce Department, with a third on the way on June 26.
Imports surged into the US during Q1 as corporations aimed to avoid incoming tariffs. The 42.6% uptick in imports marked the fastest pace of goods arriving in the US since Q3 2020. Business investment rose 24.4% in Q1, with business inventories adding 2.6 percentage points to overall GDP. Federal government spending fell by 4.6%, the largest drop in three years, but a deduction from overall GDP calculations.
Real consumer spending rose by 1.2%, albeit far less than the 4% posted during Q4 2024 and revised down from the first reading of 1.8%. Other reports indicate that Americans are spending far more on the essentials like utilities, health care, and housing. The Fed’s preferred inflation measure (PCE price index) rose 3.6%. Persistent inflation has led to cautious consumer behavior and a decline in demand for goods, contributing to the overall weakened reading for Q1.
Discretionary retail fell by 3% this quarter to 23% as consumers are less likely to purchase items like clothing, furniture, and electronics. Durable goods experienced a significant decline of 19%. The University of Michigan’s survey noted that decreased confidence has caused the demand for big-ticket items to decline. A lot of the demand we did see in Q1 was spending to offset anticipated tariffs. Autos, for example, rose by 11% YoY in March alone, and Q1 saw an overall 4.8% in auto purchases. That trend is not expected to continue as consumer sentiment is low.
April’s 2.3% CPI reading was the smallest annual increase since 2021, yet still above the 2% target set by the Fed years ago. The Fed isn’t fighting inflation. That phase is over. What they’re really fighting now is a collapse in confidence in the bond market, the dollar, and in the entire public sector. There will be no soft landing as once anticipated, as we are currently in a stage of stagflation.
Meanwhile, Fed Chair Jerome Powell met Trump at the White House on Thursday to declare that rate decisions would be based on “careful, objective, and non-political analysis.” “I’ve never asked for a meeting with any president, and I never will,” Powell said. “I wouldn’t do that. There’s never a reason for me to ask for a meeting. It’s always been the other way.” Trump invited Powell to the White House to encourage him to cut rates at the June meeting. The markets were pricing in a rate cut in June but now that does not seem as likely.
Trump fails to realize that the Fed is attempting to preserve confidence in the US, primarily in the debt market. We are witnessing cash deficits of over $1 trillion per quarter. Moody’s recently downgraded the US and no longer believes that Treasuries are a certain bet. The government is broke and the Fed must maintain the illusion of solvency.
Posted originally on May 21, 2025 by Martin Armstrong
BREAKING: Hillary Clinton slams President Trump for insisting that Americans have more kids, arguing that is what immigrants are for. pic.twitter.com/7j1UeK92as
Hillary Clinton infamously blamed women for failing to secure the presidency. Clinton felt entitled to the female vote, but more women voted for Donald Trump than for Hillary Clinton. Instead of acknowledging that women are permitted to hold independent ideas and beliefs, she continually bashes women at every opportunity for not aligning with her views.
“They left me because they just couldn’t take a risk on me, because as a woman, I’m supposed to be perfect. They were willing to take a risk on Trump, who had a long list of, let’s call them flaws, to illustrate his imperfection, because he was a man, and they could envision a man as president and commander in chief,” Clinton said of her 2016 election fail.
In fact, Rodham–or Clinton, as she prefers her married name– believes that Republican women are unfit to lead. “Well, first of all, don’t be a handmaiden to the patriarchy, which kind of eliminates every woman on the other side of the aisle, except for very few,” Clinton said when asked if she had advice for a potential future woman president. “The Handmaid’s Tale” by Margaret Atwood has been a popular portrayal of the far left who believe that allowing individual states to vote for abortion, a motion that was implemented by the US Supreme Court and not the president, is akin to a dystopian society where women are silenced and forced to reproduce.
Clinton said that there are a few conservative women, notably those who have attacked Trump, such as Liz Cheney, who are the rare exception. She then perpetuated the lie that is the Project 2025:
“It’s all in there—the return to the nuclear family, the return to being a Christian nation, return to producing a lot of children, which is sort of odd since the people who produce a lot of children are immigrants.”
Take that all in. Hillary was horrified that voters would like America to return to its roots, believing it would be an absolute tragedy if women had the CHOICE whether to work or raise a family, unlike today, where the economy simply does not allow one income to comfortably support a household in most situations. Children should be placed in expensive child care, run by the state, and parents should continue focusing on churning out taxable wages, and allow the system to raise the next generation.
Project 2025 has been debunked, but repopulation theory is alive and well. Hillary admits that immigrants here “legally and undocumented” produce “larger than normal—American standard—families.” The left in America and Europe are aggressively pushing mass migration not out of compassion, but out of desperation and control. When you destroy the economic incentive for families to grow through taxation, inflation, and debt—you kill natural reproduction. The West has done exactly that. Financial constraints are the number one reason that young adults are refraining from having children.
The left believes migrants will be engineered into dependency, relying on government welfare and therefore voting for the party that promises perpetual handouts. This is why lawmakers want to prohibit voter ID checks. It is why states are spending their funds on countless social programs for noncitizens. Traditional Western culture is conservative in nature. Replacing the population with people who do not adhere to the traditional Judeo-Christian ideology changes the dynamics of the population at large.
The traditional nuclear family does not revere the government. Friedrich Engels (pictured above), a pioneer of Marxism, argued against the nuclear family. He believed that the nuclear family perpetuated capitalism, private property ownership, and familial wealth, calling families a “unit of consumption.” Engels believed in communal living, polygamy or group marriage, and the removal of any private property. He argued that this was a feminist concept, as women in that time period were dependent on their husbands rather than the government.
As he writes in “The Origin of the Family, Private Property and the State”:
“The significant characteristic of monogamous marriage was its transformation of the nuclear family into the basic economic unit of society, within which a woman and her children became dependent upon an individual man. Arising in conjunction with exploitative class relations, this transformation resulted in the oppression of women that has persisted to the present day.”
Marxism believes that the patriarchy controls women and the state controls men. It believes we should hand over all power to government who will ensure we are all equal—in poverty, as history has shown time and time again. Traditional roles, and gender roles, threaten Marxist philosophy, which is why we have seen gender identity become a massive controversy in recent years, with the left promoting a genderless society.
Hillary Clinton and everyone on the far left has damned the nuclear family because they uphold Marxist beliefs rooted in centralized government power and control.
Posted originally on CTH on May 20, 2025 | Sundance
In order to understand where we are today, we must understand our journey by remembering its origin.
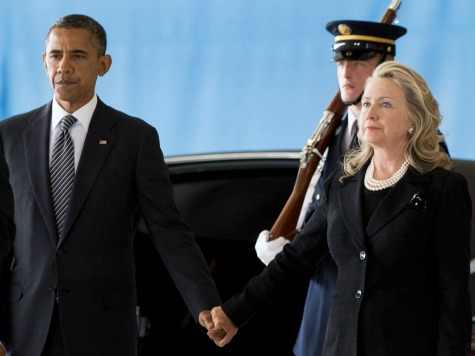
Context is needed in order to truly appreciate events soon upon us. A Big Hat Tip to Daniel Bocic Martinez who provides one of the most succinct encapsulations of the Hillary Clinton -vs- Barack Obama dynamic.
“Hillary Clinton didn’t trust Barack Obama because he was supposed to have waited his turn.
When the Bill Clinton presidential team in 2000 burrowed into the DNC, and installed HRC into the NY Senate seat, through heavy influence in primary machine politics, the Clintons were the happiest Dems in the country when W squeaked by Gore, leaving them in full control of the DNC money laundering operation for the duration of the W years.
“8 years of Bill, then 8 years of Hill,” was all going according to plan, with Hollywood planting Hillary as President “Easter eggs” throughout media of the 1990’s.
The 2008 primary was the culmination of their plan started decades earlier.
Obama’s 2004 DNC Speech and his Jefferson-Jackson speech were to place him as the heir apparent, but their lock over the DNC (and the superdelegates) was fait accompli.
Even Obama running a near flawless campaign wouldn’t have been enough on its own.
The factors that pushed him over the top, and that were outside his control, were 1) Hillary ran an abysmal campaign, due in large part to her abysmal interpersonal skills and genuine dislike of most human beings; and 2) then patriarch of the Kennedy political dynasty, Ted (whose always loathed the Clintons), pounced on the chink in HRC’s inevitability armor highlighted by her loss in Iowa (where she was outhustled in all 99 counties), and literally embraced Obama in New Hampshire shortly before the primary voting, and crowned Obama as heir apparent of what remained of the political capital once described as Camelot.
The superdelegate tsunami was stopped in its tracks and the rest is history.
With an embittered Hillary not ready to abandon decades of planning and ride off into the sunset, she first hoped McCain would somehow best Obama and then moved to burrow into his administration to maintain some level of control/access to the DNC money laundering operation her crime family ruled over for the better part of two decades.
Obama knew she would be disloyal outside of the administration, even worse in the Senate, spending each moment plotting a 2012 primary challenge (same reason she could never have been VP, she would have poisoned him if given the slot).
So, he made the Faustian bargain that would one day destroy his legacy and place in History and made her the one offer he knew she could not refuse, Secretary of State.
Out of sight, out of mind. He always cared more about his domestic agenda than foreign policy, and if she’s too busy selling political indulgences around the world, she’d put off 2012 primary ambitions and keep her eye on 2016.
Obama’s only obligation was to ensure that he did his part and ensure that his VP choose not to stand for President in 2016, which Biden dutifully complied with. HRC’s remaining embeds at the DNC then did their part in the 2016 primary and ensured the “mistake” of 2008 (heavily contested primary and near-infinite debates) was rectified.
The DNC went on to implement the “pied piper” strategy boosting Donald Trump in the early GOP primary, while being caught completely off guard as previously unknown Vermont Senate gadfly rallied the near plurality of Democrat primary voters who found her character and lack of authenticity repellant.
As the frailty of her campaign become apparent to threats from both Trump on the right and Bernie on the left, Hillary’s embeds in the administration at FBI/DOJ put their insurance plan into effect.
The FBI opened investigations into both [political] threads. For Bernie, the investigation targeted his wife and allegations of fraud surrounding a real estate transaction at her non-profit. For Trump, it was Crossfire Hurricane.
Neither was Obama’s operation by design but nonetheless happened under his watch and with the enthusiastic support of then VP Biden.
Once Trump finishes putting Chapter 9 of Art of the Deal into practice, it will be Obama’s lasting legacy.”
Posted originally on May 10, 2025 by Martin Armstrong
QUESTION: Mr. Armstrong, a friend of mine attends your conferences and said you’re the only person who understands the economy because you have international experience and have met with many central banks around the world. He said inflation is no longer the simplistic expansion of the money supply, and anyone who said that is still trapped by Keynesian economics. If inflation is not the quantity of money anymore, then can you explain what inflation is all about? Why have you not appeared on Tucker Carlson to explain your theory?
I appreciate your patience.
Rob
ANSWER: The people who put out this theory have ZERO international experience.
CURRENCY INFLATION:
Currency inflation can take place in primarily two ways. First, the currency declines in value, and this attracts foreign capital to rush in for bargains. I did that myself when the British pound fell to $1.03 in 1985. It was like the country on sale at Harrods.
Secondly, let’s say you have a building in it, and I buy it for $10 million. The money supply is not altered. However, let’s say I’m British and I buy your building in the United States. I have to bring British pounds, convert them into dollars, and then pay you your $10 million. I have just increased the domestic money supply and assets, and the central bank had no impact.
Here are the capital flows during the Great Depression. You see a massive exit of capital in 1931, which was caused by the Sovereign Debt Defaults of 1931, as all of Europe, including Britain and the British Commonwealth, such as Canada, suspended their debt payments. That is what took down 9,000 banks, not tariffs.
Here are the capital flows for the 1987 Crash, which was also caused by capital outflows. Even looking at the 1989 Japanese Bubble, what made it similar to the 1929 bubble in the USA? Capital inflows and concentration from around the world cause the assets to rise, and money pours into the economy. Currently, Canada has seen a 300% rise in real estate, largely due to foreign capital flowing into the country.
After the 1989 Bubble in Japan, capital then shifted to Southeast Asia. Thailand’s assets soared, both in real estate and stocks. Then it crashed in 1997, as capital was then expected to be the next hot market in 1999. Here you see Thailand’s peak and the US market rose into July 1998. Thailand then passed real estate legislation, which prohibited foreigners from owning land. Foreigners generally cannot own land outright in Thailand, even since the 1997 Asian Currency Crisis. However, exceptions exist for significant investments (e.g., a 2022 cabinet-approved proposal allowing land purchase with a 40 million baht investment in specified sectors, subject to parliamentary processes). This aims to stimulate the economy rather than restrict access.
Foreigners may own up to 49% of the total unit area in a condominium project, provided the funds are imported from abroad, which increases the money supply. Foreigners can lease property for up to 30 years in the classic British system, with potential renewals, although this does not confer ownership – only the right to use. While setting up a Thai company (majority Thai-owned) to hold land is a common workaround, authorities actively scrutinize such arrangements to prevent misuse.
Recent discussions (2022–2023) focused on easing restrictions for high-value investors rather than imposing bans. Thus, Thailand maintains its historical framework: it restricts land ownership but permits certain property investments under regulated conditions. Always consult legal experts for current, case-specific advice. All of this was a response to the 1997 Asian Crisis caused by capital concentration, and then it moved on to the next hot topic.
Here, you can see that the price of gold varies by currency, all based on its value. Are you genuinely looking at a chart of gold, or are you only looking at it in relation to the local currency?
DEMAND INFLATION:
This was Keynes’ misconception, who assumed the bull market up to 1929 was purely driven by domestic demand. He proposed raising interest rates to make borrowing more costly and lowering interest rates to encourage borrowing. The idea was seriously myopic. He did not understand capital flows, and that higher interest rates sometimes attract capital, as was the case when Volcker raised interest rates to insane levels in 1981, which sent the dollar soaring to a record high in 1985.
Lowering rates in 1927 to try to deflect the capital inflows back to Europe failed. The Fed raised rates from 3.5% to 6%, and it did not stop the rally in the share market. The Fed then lowered rates from 6% to 1,5% in 1931, and it had no impact on supporting the market. So, again, all we have are failed theories, yet people lacking international experience mouth the same old stuff over and over again because everyone else does.
ASSET INFLATION:
Then you have raw shortages or oversupply. The purchasing value of gold dropped significantly thanks to the 1849 California Gold Rush. During inflation, assets rise in value, and money declines. That took place during the 19th century when a gold coin was money. MONEY has NEVER been of a constant value – NEVER! These people yelling fiat simply do not comprehend that for thousands of years, there has always been a business cycle, and that means money rises and falls in purchasing power, REGARDLESS of whatever it has been. The fiscal irresponsibility of governments is well-documented throughout history, long before the introduction of paper money.
Even under a gold standard, there were periods of inflation and deflation. Read the history of the California Gold Rush. During the 1849 Gold Rush in California, the journalist for the New York Tribune, Bayard Taylor (1825-1878), arrived in San Francisco by ship during the summer of 1849. He was shocked at what he encountered and did not think that anyone would even believe what he was going to write. His dispatches about the gold rush economy in California stunned many and helped to create the 1849 Gold Rush.
The average wage for a laborer in New York was about one or two dollars a day. In California, individual hotel rooms were rented to professional gamblers for upwards of $10,000 a month, which is the equivalent of about $300,000 today. The degree of inflation in terms of gold was astounding and lacks comparison in modern times. There was so much gold that the value of goods rose even though they did not in New York. The inflation phenomenon was local – akin to the Tulip Bubble.
There is a lot more to this than simply the quantity of money. In case you haven’t noticed, some Marxist economists who propose MMT (Modern Monetary Theory) claim that since the U.S. borrows in its own currency, it can print dollars to cover its obligations and can’t go broke. The theory has won converts among freshman Democrats, like Alexandria Ocasio-Cortez, as a way to finance social policies like the Green New Deal and Medicare for All. They pointed to the vast Quantitative Easing (QE) in 2008-2009, and inflation was not created. The European Central Bank expanded the money supply and lowered interest rates to negative in 2014, despite no inflation.
Quantitative Easing (QE) does not increase the Supply of Money—it is only a maturity swap. Today’s total money supply includes debt, unlike during the pre-19th century. This has erroneously given rise to Modern Monetary Theory, for they pointed to QE and said there was no inflation, so that we could print without repercussions. It was merely a swap of maturities when you finally realized that debt is now money that earns interest, as paper money was introduced during the Civil War.
When paper money stopped paying interest, the term “Greenback” emerged, meaning there was no interest payment schedule on the reverse, just green ink. Paper money began as essentially debt or bonds that circulated as a form of cash. Today, people blame the central bank, but remain clueless that the money created by the central bank is only a tiny fraction of the money supply. Because debt issued after 1971 is now legal to use as collateral, posting T-Bills to trade futures, the $34 trillion debt is part of the money supply that dwarfs the central bank. Shutting down the Federal Reserve will make things worse. The real source of inflation under this theory of the Quantity Theory of Inflation is the debt itself.
Moreover, we pay interest, and that no longer stimulates the economy because much of it is held offshore. China has 10% of the US debt, which accounts for 10% of the $1 trillion in interest payments that flow to China, not the domestic economy.
If your Definition of Money is Wrong, So is Everything Else that Follows
As far as Tucker is concerned, I haven’t been invited, and I’m not sure he would want someone who doesn’t agree with 99% of the analysts on this subject.
And by the way, this is not theory – it’s plain experience and observation.
I have created this site to help people have fun in the kitchen. I write about enjoying life both in and out of my kitchen. Life is short! Make the most of it and enjoy!
This is a library of News Events not reported by the Main Stream Media documenting & connecting the dots on How the Obama Marxist Liberal agenda is destroying America