Ex Muslim Exposes The Reality of Islam In The West | Yasmine Mohammed | SPIRITUALITY | Rubin Report


1.14M subscribers
Dave Rubin of The Rubin Report talks to Yasmine Mohammed (Author and Activist) about how she became an ex Muslim and the untold reality of Islam in the West. Yasmine grew up in a fundamentalist Muslim home in Canada. Despite living in a western country her childhood more closely resembled living under Sharia law in Saudi Arabia. She was forced to wear a hijab starting at age 9 and was later put into an arranged marriage. She left her husband and tried to regain control over her life. Yasmine had her awakening when she saw Sam Harris’s famous appearance with Ben Affleck on Real Time With Bill Maher. It was then that she knew she had a duty to tell the world about her experiences growing up Muslim in Canada. She also discusses her book “UNVEILED: How Western Liberals Empower Radical Islam”. Yasmine shares stories about her young students of the Zoomer generation and how she sees them as potentially being the end of “woke culture”. She also reveals why she thinks people in the West are being sold a lie by fetishizing the hijab through burkinis in Sports Illustrated, and Nike swoosh hijabs. The lie being that these things empower women, when in fact they oppress them. Yasmine also shares her surprise at how afraid a lot of westerners are to speak up, despite having their speech protected. Watch Dave Rubin’s previous interview with Yasmine Mohammed here: https://www.youtube.com/watch?v=DAqEv…

Widespread Poverty Stats Greatly Overstate the Number of Americans Who Are Destitute


By James D. Agresti, January 25, 2020

While pressing her agenda to expand means-tested welfare programs, Democratic Congresswoman Alexandria Ocasio-Cortez is claiming that the federal government’s poverty statistics vastly undercount the number of Americans who are “destitute.”

In reality, the exact opposite is true because those statistics omit a broad range of government benefits, charity, and unreported income. When these are counted, the poorest fifth of U.S. households consume five times more goods and services than the poverty stats reveal. These material resources amount to an average of more than $50,000 per household per year, making the poorest fifth of Americans richer than the averages for all people in most developed nations of the world.

AOC’s Claims

In a recent video, AOC alleges: “You would not know that our country is posting record profits because 40 million Americans are living in poverty right now, and if the poverty line was real—if it was around what some people think it should be—about $38,000 a year, we will be shocked at how much the richest society on the planet is allowing so much of its people to live in destitute [sic].”

Her number of 40 million is roughly equal to the Census Bureau’s figure of 38.1 million, or 11.8% of the U.S. population. This represents merely one of the widely different ways of measuring poverty, but it is the federal government’s official measure, and the media follows suit. As stated in a 2019 paper in the American Economic Journal: Applied Economics: “The official poverty rate is also one of the most cited government statistics in the popular press.”

What’s Excluded

Without vital context—which AOC and most news reports fail to provide—the oft-cited Census poverty stats are highly misleading. For as the Census Bureau explains, they don’t “include the value of noncash benefits such as those provided by SNAP [Food Stamps], Medicare, Medicaid, public housing,” and a host of other goods and services that the poor receive from government and charities. More specifically:

  • Food Stamp beneficiaries received an average of $3,200 per household in Food Stamps during 2017.
  • Medicaid beneficiaries received an average of $7,794 per person in healthcare benefits during 2016.
  • Section 8 voucher beneficiaries received an average of $8,333 per household in rental assistance during 2016.
  • Head Start beneficiaries received an average of $9,871 per child in childcare and preschool benefits during 2017.
  • Other government programs provide noncash welfare benefits in the form of utility assistance, college grants, school lunch, school breakfast, community health centers, family planning services, prescription drugs, job training, legal services, cell phones, cell phone service, and internet service.
  • Federal law requires most hospitals with emergency departments to provide an “examination” and “stabilizing treatment” for anyone who comes to such a facility and requests care for an emergency medical condition or childbirth, regardless of their ability to pay and immigration status.
  • Private charities provide additional benefits to low-income people, such as food, clothing, housing, and healthcare.

Furthermore, Census income and poverty figures are obtained through household surveys, and low-income households don’t report much of their cash income in such surveys. Regarding this:

  • A study published by the American Economic Journal in 2019 found that 63% of all New York State households who received benefits from two major cash welfare programs did not report any of this money to the Census Bureau.
  • The same study found that people who did report receiving cash welfare from these two programs received an average of 65% more money from the programs than they reported to the Census Bureau.
  • In 2013, the chief actuary of the U.S. Social Security Administration estimated that 3.9 million illegal immigrants worked “in the underground economy” during 2010.
  • In 2016, the IRS reported that 63% of income not reported to the IRS by third parties (like employers) is never reported to the IRS by the people who receive the money.

The Big Picture

An official federal measure that accounts for all of people’s material resources is called “consumption.” Recorded by the federal government’s Bureau of Economic Analysis, it is a comprehensive measure of the goods and services consumed by households. It is also the World Bank’s “preferred welfare indicator, for practical reasons of reliability and because consumption is thought to better capture long-run welfare levels than current income.” Significantly, a 2003 paper in the Journal of Human Resources explains that “consumption standards were behind the original setting of the poverty line,” but government changed to the current method because of its “ease of reporting.”

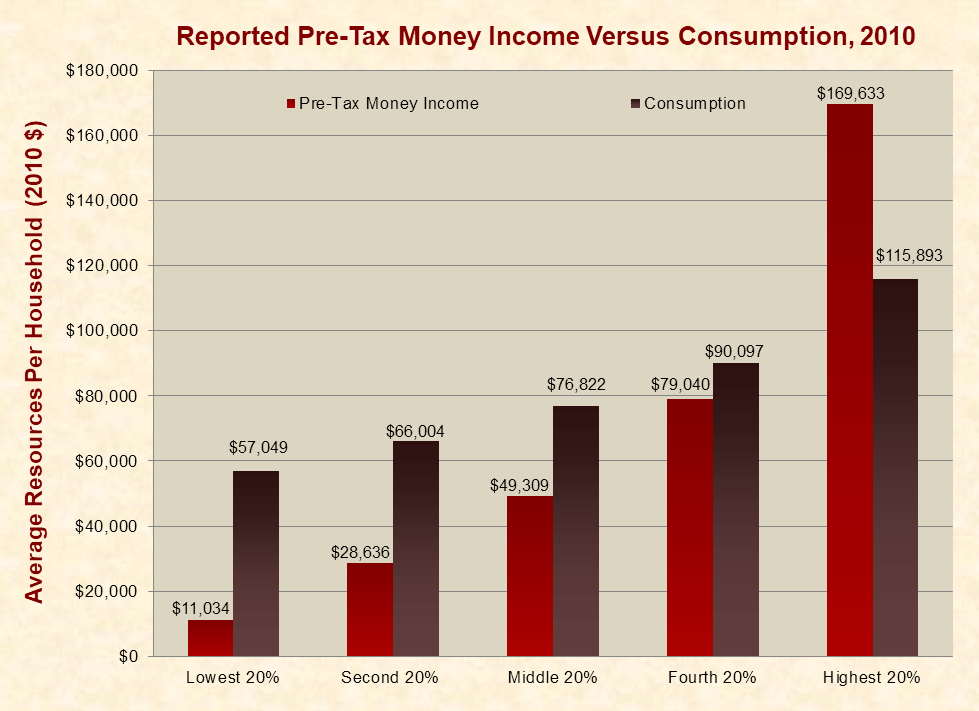
The Bureau of Economic Analysis normally reports consumption for the entire nation and doesn’t break down the data to show how people at different levels fare. However, it published a report in 2012 that does that for 2010. Placed side-by-side with the Census Bureau income figures that underlie its poverty stats, the differences are striking—particularly for the poorest and richest U.S. households:

The federal data graphed above shows that the poorest 20% of U.S. households consumed an average of $57,049 of goods and services per household in 2010, while they reported an average of $11,034 in pre-tax money income to the Census Bureau. This means that widely reported federal poverty stats exclude about 80% of the material resources of low-income households. Put simply, the poorest fifth of U.S. households consume five times more goods and services than the poverty stats reveal.

AOC argues that the federal poverty line for “1 earner & a mother home full-time” should be $38,000/year, as compared to the current line of about $26,000 for a family of four. She attempts to justify this by saying that the current line “doesn’t include cost of childcare, geographic cost of living, or healthcare.” What she neglects to say is that low-income households typically receive such items and many others for free or greatly reduced prices.

In contrast, most U.S. households earn their healthcare, housing, food, childcare, phone service, and such for themselves, while also paying taxes that fund these items for others. As a result, U.S. middle-income households consume only 26% more goods and services than the poorest fifth.

The impacts of this wealth redistribution are even more drastic for the richest fifth of U.S. households, who forfeit a large portion of their income to taxes and receive few government benefits. They report 15 times more pre-tax money income than the poorest fifth of households, but they consume only twice as much goods and services as the poorest fifth.

Given that the available data treat the poorest 20% of households as a single group, while 11.8% of U.S. residents are officially in poverty, one might assume that poor households consume markedly less than the $57,049 average for the group. However, other government data suggests that is not the case. The U.S. Bureau of Labor Statistics collects data on a subset of consumption called “consumer expenditures.” These show a mere $2,179 difference between the lowest 10% of U.S. households and the second lowest 10%. Since consumer expenditures exclude many forms of non-cash welfare, and eligibility for welfaredeclines as income rises, the poorest 10% may consume more goods and services than the second-poorest 10%.

Conclusion

Contrary to AOC, the facts are clear that frequently reported federal poverty stats vastly overstate the number of Americans who are destitute. Moreover, Just Facts’ recent study of data from the World Bank and the U.S. Bureau of Economic Analysis reveals that the poorest fifth of Americans consume more goods and services than the averages for all people in most developed nations of the world. In spite of these facts, AOC decries “economic injustice in America” and insists that the U.S. cannot “capitalism our way out of poverty.”

The School Funding Inequity Farce


By James D. Agresti
November 25, 2019

Leading presidential candidates and major media outlets are claiming that school districts with high concentrations of minorities and poor children generally receive less funding per student than other districts. That hasn’t been true for at least half a century, but people are spreading this myth through deceptive studies that exclude federal funds.

In reality, a broad range of credible studies that include all funding sources show that such school districts are as well-financed as others.

The Claims

According to Democrat presidential hopeful and U.S. Senator Elizabeth Warren, “our current approach to school funding at the federal, state, and local level underfunds our schools and results in many students from low-income backgrounds receiving less funding than other students on a per-student basis.”

Along the same lines:

  • Sarah Mervosh of the New York Times reported in early 2019 that “on average, nonwhite districts received about $2,200 less per student than districts that were predominantly white….”
  • Maria Danilova of the Associated Press (AP) reported in 2018 that “the highest-poverty” school districts “receive an average of $1,200 less per child than the least-poor districts, while districts serving the largest numbers of minority students get about $2,000 less than those serving the fewest students of color….”
  • Democrat presidential contender and U.S. Senator Bernie Sanders claims that “less is invested in the education of children from low-income families compared with their more affluent peers” because “school districts are funded out of local property taxes.”
  • Clare Lombardo of National Public Radio (NPR) reported in 2019 that “high-poverty districts serving mostly students of color receive about $1,600 less per student than the national average.”

With the exception of Sanders—who provides no evidence to support his claim—all of the others misrepresent their sources by failing to reveal that they ignore federal funds. Moreover, their sources obscure this fact in the following ways:

  • Warren cites a study by the Education Law Center, which refers to federal funding on page 2 but then never accounts for any of it. Instead, the study mentions on page 5 that it uses “actual state and local revenues” for its analysis.
  • The New York Times and NPR cite a report from EdBuild, which doesn’t say a word about the exclusion of federal revenues. Instead, it tacitly slips this into a separate webpage of “research methods“ that references “revenues from state and local sources” while ignoring federal revenues except when subtracting out charter school funding.
  • The AP cites a report from the U.S. Commission on Civil Rights that repeatedly mentions federal funding, but when it presents the $1,200 and $2,000 underfunding figures quoted by the AP, it cites a study from the Education Trust that explicitly excludes “federal sources.” The Commission on Civil Rights doesn’t even allude to this fact—and to discover it, readers must go to the footnote and then locate the study from a citation with an unclickable link.

In short, these politicians and journalists never hint that their statistics exclude federal funds, and the sources they appeal to bury this crucial caveat. This ensures that only diligent readers with time to investigate will learn the truth.

Moreover, those who propagate this falsehood often call for more federal funds to fix this contrived disparity. But since they ignore federal funding, their proposals to increase it will not change the statistics they present.

Warren’s K–12 education plan, for instance, makes the false claim quoted above and then calls for “quadrupling Title I funding—an additional $450 billion over the next 10 years—to help ensure that all children get a high-quality public education.” Title I is the largest source of federal K–12 education funding, but because Warren doesn’t count this money in her statistics, her plan won’t affect her own measure of school funding.

The Reality

Wide-ranging studies that include all education funding—like those conducted by the U.S. Department of Education (1996), Ph.D. economist Derek Neal (2006), the left-leaning Urban Institute (2008), and the conservative Heritage Foundation (2011)—have all found that school districts with higher portions of minority students spend about the same amount per student as districts with smaller portions of minorities.

The Urban Institute study, which looks the furthest back in time, found that “differences in spending per pupil in districts serving nonwhite and white students are very small” since at least 1972.

Likewise, a study published by the journal Education Next in 2017 found that “per-student K–12 education funding from all sources (local, state, and federal) is similar, on average, at the districts attended by poor students ($12,961) and non-poor students ($12,640), a difference of 2.5 percent in favor of poor students.” The study also found that “this difference has not changed much since 1994–95,” the earliest data in the study.

Within school districts, research published by the Brookings Institution in 2017 found that “on average, poor and minority students receive between 1-2 percent more resources than non-poor or white students in their districts, equivalent to about $65 per pupil.”

The Property Tax Charade

Warren alleges that “school systems rely heavily on local property taxes, shortchanging students in low-income areas.” This was previously the case, but it hasn’t been so for decades. As explained by the Urban Institute:

In the past, because public schools were funded largely by local property taxes, property-rich and -poor school districts differed greatly in expenditures per pupil. Since the early 1970s, however, state legislatures have, on their own initiative or at the behest of state courts, implemented school finance equalization programs to reduce the disparity in within-state education spending.

Consequently, data from the U.S. Department of Education show that local revenues have declined from 83% of all school funding in 1920 to 45% in 2016:
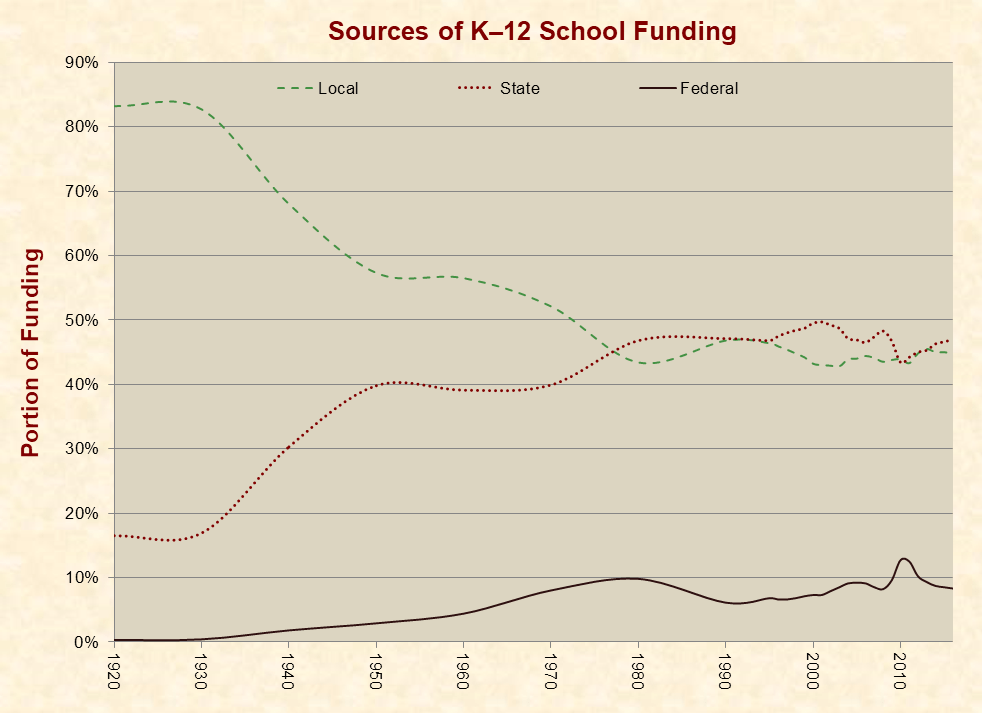
Furthermore, the chart above only shows national averages. These don’t reveal the fact that school districts in low-income areas typically receive greater portions of their budgets from state and federal funds. For example, the U.S. Government Accountability Office reported in 2011 that some school districts receive no federal Title I education funding, while others receive as much as 36% of their budget from it.

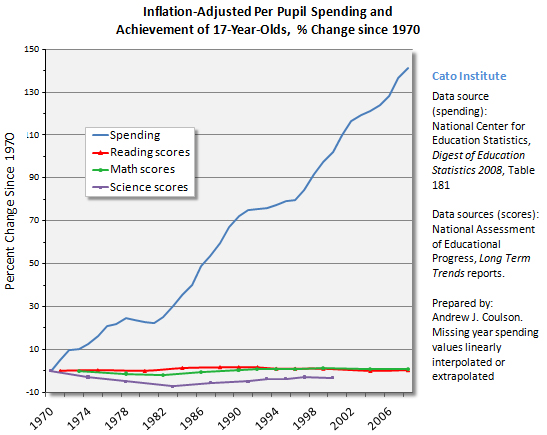
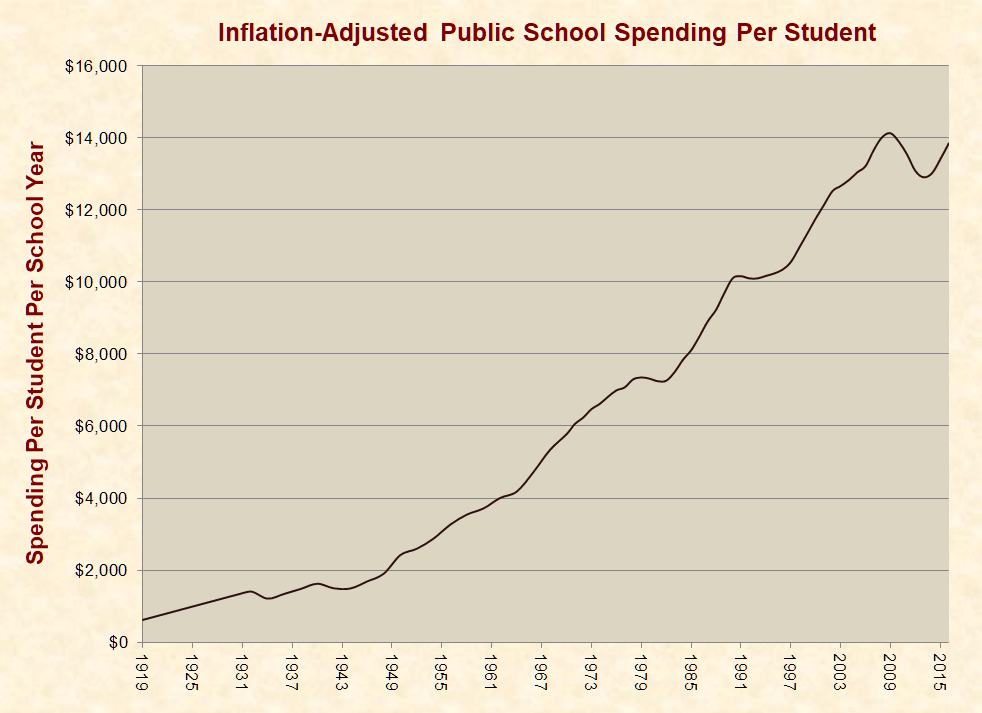
Along with increasing shares of school funding paid by state and federal taxpayers, the inflation-adjusted average spending per student grew by 22 times in the same era:
False Justifications

Some people openly argue that federal funding should be ignored when comparing schools, because this money is meant to help disadvantaged students. However, federal law is at odds with such logic.

The Education Trust, for example, writes that it excludes such funds from its analysis because “federal dollars are intended—and targeted—to provide supplemental services to such specific groups of students as those in poverty, English learners, and students with disabilities.”

In accord with that view, the Obama administration published an issue paper stating that federal education funding “is intended to provide the extra help low-income students need to succeed, but it cannot do that if state and local funds are not evenly distributed to start with.” The administration also drafted regulations to impose this requirement on school districts.

In contrast, the applicable federal law explicitly states that “nothing in this subchapter shall be construed to mandate equalized spending per pupil for a state, local educational agency, or school.” Thus, the Congressional Research Service determined that the Obama administration’s proposed regulations “appear to directly conflict” with the law.

Federal law does require that states and localities not reduce their funding to schools when they receive federal funds. This provision says that states and localities can only use federal funds “to supplement the funds that would, in the absence of such federal funds, be made available from state and local sources,” “not to supplant such funds.” This does not require that funding be equal before or even after federal funding. It simply requires that states and localities don’t cut other funding just because they receive federal funds.

The law also requires that local school districts provide services that “are at least comparable” to all schools within their district before they receive federal funds. New York City, for example, cannot provide unequal services to schools and then use federal funds to equalize them. To meet this requirement, districts must provide similar staff-to-student ratios, “curriculum materials,” and “instructional supplies” to schools in their district in order to receive federal funds.

Nevertheless, politicians and unions sometimes create funding disparities within local school districts by agreeing to contracts that give senior teachers more pay and discretion to choose the schools where they work. These higher-paid teachers tend to avoid inner-city schools with high rates of crime and student discipline problems, resulting in lower spending-per student in poor neighborhoods. Federal law permits this practice by excluding “staff salary differentials for years of employment” from its compliance provisions.

Conclusion

Regardless of any rationale for excluding federal funds from school funding comparisons, it is deceitful to omit such money without even a hint. Yet, Elizabeth Warren, Bernie Sanders, the New York Times, National Public Radio, and the Associated Press are doing just that.

Such disinformation is enabled by advocacy groups like EdBuild and the Education Law Center, which publish reports that exclude federal funds while burying this vital fact.

Warren takes the deception even further by leading people to believe that she actually accounts for federal funds. She does this by claiming that “the current investment in Title I—$15.8 billion—is not nearly enough to make up for state-level funding inequities,” but her supposed evidence for this is a study that excludes all of this money. This provides false grounds to continually demand more from taxpayers and to portray the U.S. education system as systemically racist.

Image

Happy Valentine Day


“Darwin’s Doubt” with Stephen Meyer


29K subscribers

Darwin, the scientific method, Danny DeVito, and Cher all manage to find a place in this mind-boggling and entertaining conversation between Eric Metaxas and Stephen Meyer, at the Union League Club in New York City on September 12, 2013.

Touching Moment – President Trump Honors Rush Limbaugh With Medal of Freedom…


Rush Limbaugh is going to attempt to broadcast tomorrow (Thursday).  I would strongly urge all those who have listened and learned from El Rushbo to tune in.  Given the rapid nature of the cancer diagnosis our time with Rush is short. As a beacon when needed most, Rush Limbaugh has guided minds, inspired hearts and touched the lives of many.

Last night President Trump honored Mr. Limbaugh for his years of excellence in broadcasting, his unwavering love of country and his numerous charitable efforts.  Presenting Mr. Limbaugh with the Medal of Freedom was a very special moment in recognition of a very special man.

Discovering Cycles


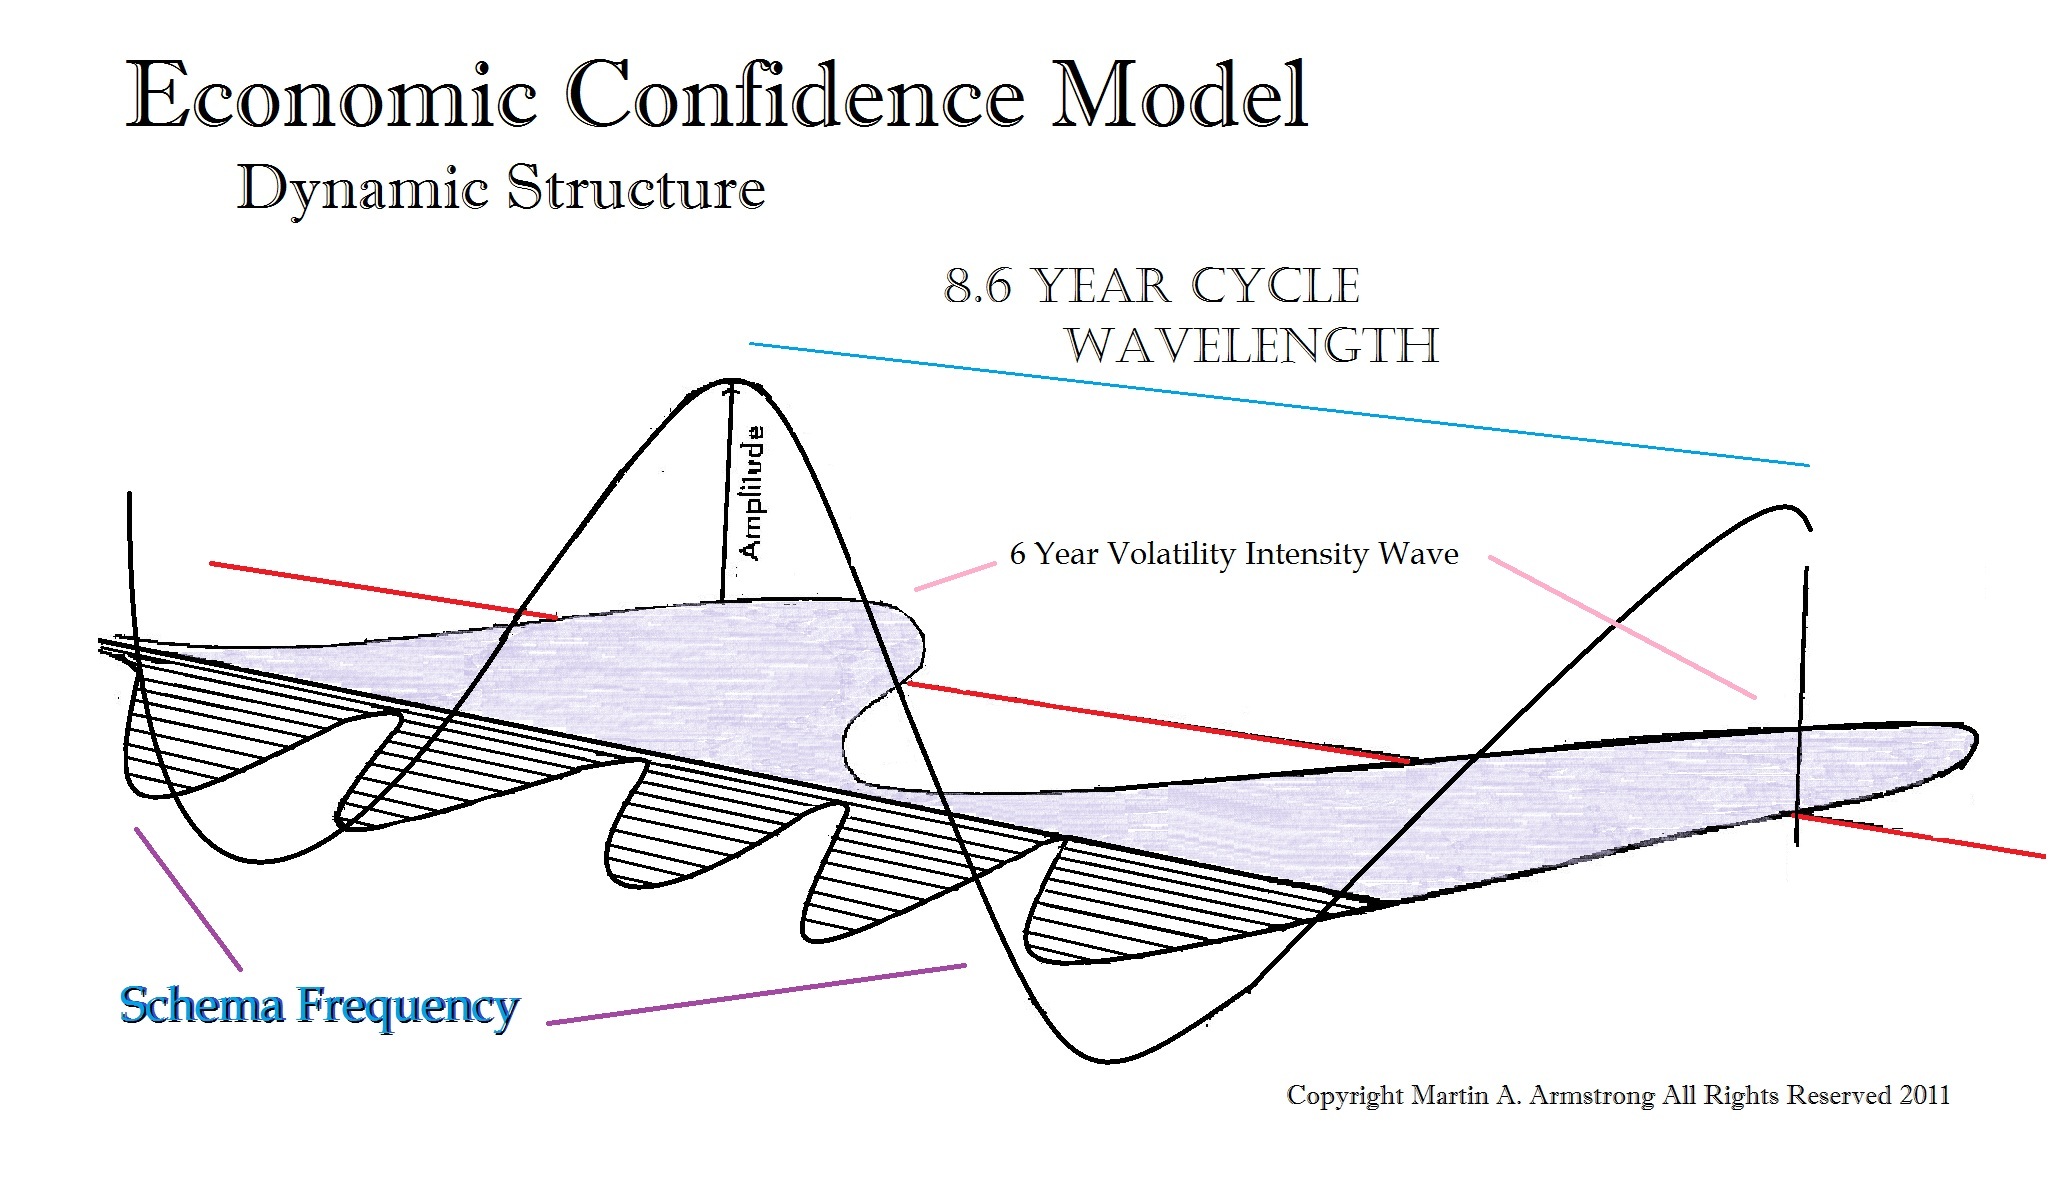
QUESTION: Speaking of cycles and frequency I guess the question is how to find the exact beginning of a cycle? You say 8.6 is the base frequency. Why not 8.5875? In other words, how do you come up with the exact day a cycle begins?

A

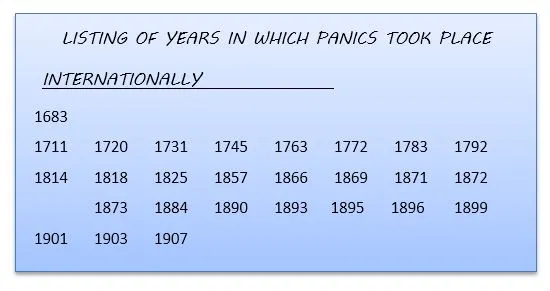
ANSWER: You have to discover them. The 8.6 I discovered from a list of international panics covering 1683 to 1907 that I stumbled upon while doing research in the Firestone Library at Princeton University. There were 26 events within 224 years. That was 8.6153846… When I began to test it, I discovered it was interlaced with volatility, which moves on a different frequency of a base of 6. This is a very deep subject that cannot be addressed in a simple blog post.


I will release two books on this subject this year – “The Geometry of Time” and “The Economic Confidence Model.” I am working hard to get a series of books out now. Trying to finish up my goals. These will deal with the cyclical nature of time and the world we live in.

Are Climate Activists Displaying Patterns of Violence That Always Undermines Civilization?


COMMENT: Mr. Armstrong, I find it interesting how the entire climate crisis people are pushing so hard to seize everything and force zero CO2 which is impossible when a volcano or forest fire releases far more CO2 than driving cars around. Then they ignore the sun entirely when even NASA said we are headed into a cooling people.


REPLY: The press helped them to push this agenda because all they are interested in has been catchy headlines to sell advertising. There is no more truth in newsrooms anymore — it’s just not profitable. Yes, NASA warned we were heading into a cooling period back in 2018. Despite all of that, I get emails claiming I am wrong and they should shut down this blog. These are evil people who have always been a danger to any free society, for they seek to oppress and eventually kill anyone who disagrees with them. It never matters what the subject might be. This pattern of behavior ALWAYS historically leads to violence be it religion, economics (Marxism), or now climate. They just hate people and that’s the bottom line.


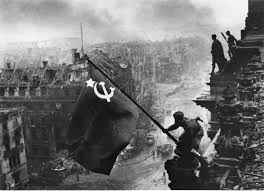
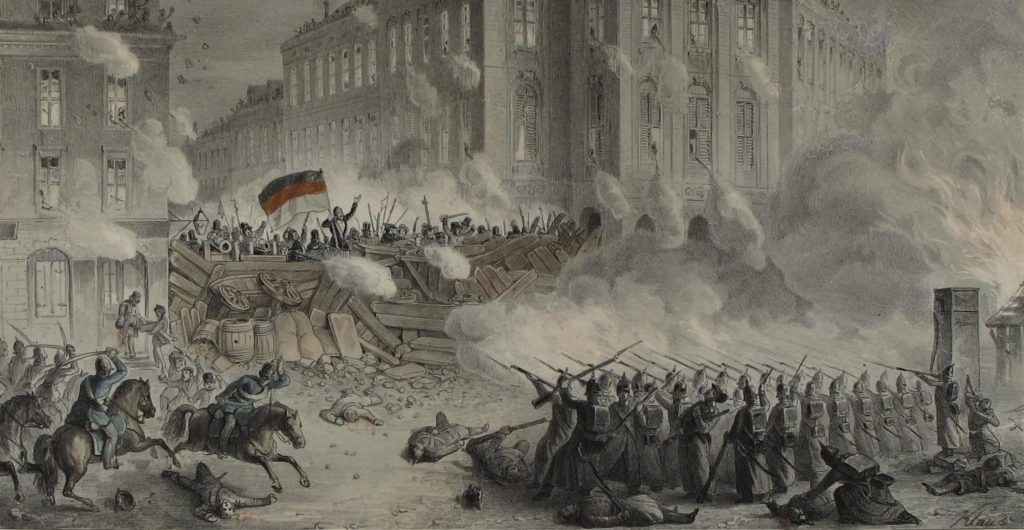
The subject matter seems to be irrelevant. They display the same pattern that has led to millions of deaths throughout history. The hatred they display is eerily similar to the rise of Communism during first the Revolutions of 1848 and then the early 20th century. This will lead to major bloodshed by 2036. The bottom of that cycle was 2005, which marked three important events.


  1. The IRA announced the end to armed conflict and gave up its weapons to independent weapons inspectors
  2. Israeli settlers were forced to leave settlements in the Gaza Strip as part of a peace settlement
  3. Syria withdrew the last of its 14,000 troop military garrison in Lebanon ending its 29-year military occupation

The peak of that cycle will be 3

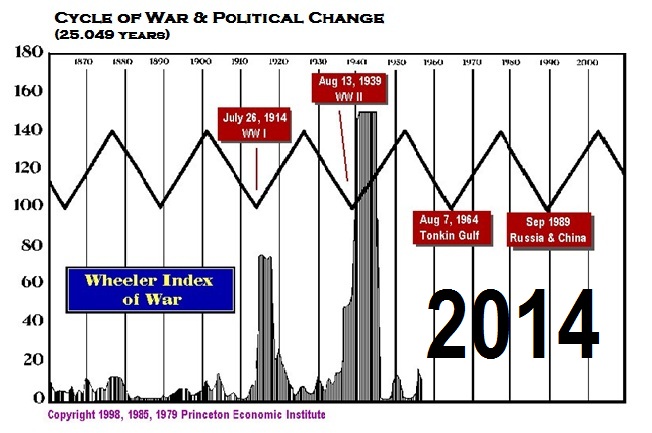
Northwoods & Cycle of War


CycleOfWar-2014

This particular Cycle of War is the combination of two models: 1) international war, and 2) domestic civil unrest. This is the first time these two models have coincided in the same time slot for about 300 years. We should expect a rise in civil unrest going into 2022, but the international war cycle is targeting 2032. We are witnessing a sharp intense rise in civil unrest on a global scale. This is what we should be most concerned about, for this is what leads to separatist movements and in many cases civil war.

I will update the Cycle of War in 2020

Search for Religion in the 1860s


Armstrong Economics Blog/Religion
Re-Posted from Jan 23, 2020 by Martin Armstrong

COMMENT:  Concerning the post today of the “Decline and Fall of Religion?”
I nearly fell out of my seat when you mentioned 1860 as a cyclic date. You mentioned the US Civil War. However, you may not be aware of the Baha’i faith which started in the early 1860’s with the prophet Bahá’u’lláh in Iran. The specific date depends on the source but the consensus is the early 1860’s.

While the Baha’i faith does not have the greatest number of total members, it is globally the second widest spread, and their books have been translated into more languages than the Christian Faith. According to the Baha’i’s, their prophet, Bahá’u’lláh, was prophesied to present himself in the 1860’s as was written in the books of the Zoroastrians, Hindu, Old Testament, and Koran.

One very interesting aspect of the religion is that Bahá’u’lláh claimed that the growth of humanity had progressed well enough that there would be no need for an ordained priesthood anymore. He also proclaimed that all major wars and turmoil that has been brought on humanity have been caused by priests and politicians. Therefore, in the Baha’i faith, there is no organized priesthood permitted and no members are allowed to become elected politicians.

They select their representatives from the intimacy of their small groups that meet in their own homes. These selected individuals then meet regionally and select their regional representatives. Ultimately, their global representatives are selected to serve for defined terms with only a modest food and housing allowance. No campaigning by individuals is allowed during the selection process. It becomes an obligatory duty for the length of the term. In other words, the selected individuals will ask themselves “Why me?”

I can just imagine the potentials for any government if local everyday individuals were selected in this manner to lead their regions and nations with obligatory defined term lengths. What a day for humanity when the selected president will ask themself the question “Why me?” rather than “Why not me?”

REPLY: Yes, the Baháʼí Faith began in Iran as was the case with the Zorasters. The Baháʼí Faith was established around 1863 and spread to various parts of the Middle East. It has been subjected to ongoing persecution ever since its inception. It is a small religion that is estimated to have between 5 and 8 million followers.

The 1860s was a major turning point in religion. There was even the birth of the Christian Methodist Episcopal Church during this time period. The Seventh-day Adventist Church also began in 1863 and this is when the Jehovah’s Witnesses also began about 1870. The following decade saw initial movements that began during the 1860s take shape formally creating the Theosophical Society (Eastern Theosophy) by 1875, Ethical Culture in 1877, and the Church of Christ, Scientist (Christian Science) by 1879. It was a major period of a search for new religions.

Of course, it was religion and the objection to slavery that led to the American Civil War. The 1860s was a major turning point in religion