Posted 0riginally on Aug 9, 2024 By Martin Armstrong |
COMMENT #1: I’ve now been reading your work for close to Twenty Years. I’ve been to numerous conferences. From Philadelphia to San Diego to Orlando and you still amaze me
The me from 10 years ago would have thought the world would collapse on Monday as the media stated. Now I’ve learned(from you) to watch what actually happens instead of trying to predict.
I thank you ?? Regards,
JCL
COMMENT #2: Marty, I have been in these markets for 20+ years. Not as long as you, but long enough to see that a bunch of analysts are all claiming we are heading into a recession without any data. It is clear how many people are looking at your Economic Confidence Model but will never give you credit for anything. That reveals their character.
You are here for a reason.
Take care.
FA
RESPONSE: So many people just make forecasts based on opinion. Mainstream media would NEVER put me on the air because I would contradict their mainstay of putting out propaganda to get you to tune in again and again. Markets are propelled by energy. There is simply a finite level of energy that CAN be exerted in a single direction. It is the pendulum.
The swing down provides the short cover for the rally. Rally to a high, which will cause the energy to decline. NOTHING goes straight up or straight down. The 1987 Crash was the same thing. I said the market bottom was in place the very day of the low. As Larry Edelson said, people thought I was crazy. We called the high, the Crash, but also the low.
Here are our Energy Models. Note how energy was declining to a high, showing that you were running out of steam. Then, energy rose sharply with the decline. But look at the Monday low—the energy was subsiding. I try to teach people how to be an international hedge fund manager at these conferences. This is also why they are making a Hollywood movie about what I have done. They understand that there is a better way to run the world than always trying to manipulate things for self-interest. They are also doing a Documentary, the Forecaster 2024, showing all the forecasts they recorded 10 years ago and how they came true. They understand this is NOT MY PERSONAL OPINION!
I know a lot of people are looking at the Economic Confidence Model. Some plagiarize it, while others pay attention silently. This is NOT going to be the classic recession. There is a lot more behind this than meets the eye.
Posted originally on Jul 15, 2024 By Martin Armstrong
Confidence in the very structure of the nation has been shaken amid this private wave where all trust in the government has been lost. A new Pew Research Center poll found that 72% of Americans believe the United States – the land of the free – is no longer a good example of democracy.
Those 72% say that America was once a good example of a democracy for other nations to follow, with only 19% still trusting in its structure. Americans over 50 trust in democracy a bit more than younger generations (11% vs 4%) likely because they are less likely to face the new reality of our broken economy where the American Dream is no longer attainable.
Those most closely aligned to America in terms of economics are more likely to say the US is no longer a good example of democracy (Canada 67%, Japan 65%, UK 63%). Younger generations everywhere now believe America was never a good example of democracy as they have only seen the nation in a state of geopolitical upheaval.
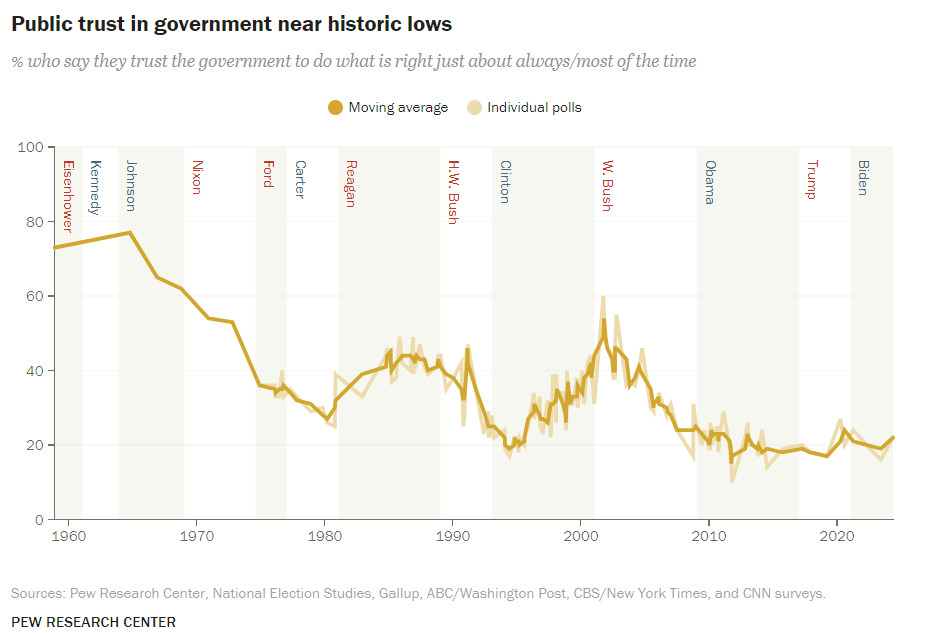
A separate poll with information from Pew Research Center, National Election Studies, Gallup, ABC/Washington Post, CBS/New York Times, and CNN surveys, Americans were if they trust the government. Trust heightened, in line with the ECM, in 1964 under President Johnson with a trust rating of 77%. Trust plummeted when President Nixon became the first president to resign in 1974, with the moving average then standing at 36%. Individual polls then showed confidence moving to a new low of 25% by the end of President Carter’s administration, in line with the economy as always.
Trust in government then peaked at the beginning of George W. Bush’s term in office, with individual polls rising to 60% in 2001 and overall stats hitting 54%. Now, 2001 marked the 9/11 terrorist attack on the Twin Towers that shook the nation at its core, spreading a wave of patriotism across the United States. Everyone trusted that the government would seek revenge and keep the nation safe from future attacks. We permitted countless laws to pass, like the Patriot Act, because we trusted the government to protect us.
By the end of George W. Bush’s term, no one knew what we were doing in the Middle East and were questioning the “weapons of mass destruction” premise. Individual polls plummeted from 60% to a mere 17% in 2008, with overall sentiments not faring much better at 24%. Trust in government has never surpassed 30% on either poll since.
The moving average of trust in the US government now sits at 22%. Politics have never been more divided. The majority of the country questions in the president is mentally fit to serve. Congress is blatantly corrupt. The coronavirus pandemic changed everything and shook the nation as badly as 9/11, but the people ran from government rather than towards it.
Our computer indicates the American economy subtly slipped into a recession, and things will worsen until 2028. We find this same phenomenon of trust in government declining globally and it is all in line with the Economic Confidence Model. Distrust will only grow as economic conditions worsen. By 2032, as indicated by the models, we will have a chance to rebuild and regrow at the end of the Sixth Wave, which will be the equivalent to the fall of ancient Rome.
Posted originally on Jul 4, 2024 By Martin Armstrong
Back in 2008, I named a report after what Margaret Thatcher had told me about politics. I began that report by writing:
Time is but a dimension that we divide up to mark its passing. Western thought, unfortunately, is linear, not dynamic. This has been the curse of Western understanding and knowledge. Time is but a cycle – a circle. Asians are raised with the idea of cycles leading to a more dynamic thinking process. Some see and feel cycles, and some see it as necessary and instinctively understand them. Lady Margaret Thatcher once commented to me that the Conservatives would lose the elections in Great Britain when John Major was running, she said – “It’s just time.”
Lady Thatcher came and spoke at our conference on cycles. She said.
Today’s British election is underway, and we will see a sweep where Labour will replace Conservatives, who have acknowledged that Labour appears headed for victory and urged voters not to hand the party a “supermajority.” Britain’s Prime Minister Rishi Sunak insisted “the outcome of this election is not a foregone conclusion.” However, in a message to voters on Wednesday, Sunak said that “if the polls are to be believed, the country could wake up tomorrow to a Labour supermajority ready to wield their unchecked power.”He urged voters to back the Conservatives to limit Labour’s power. The Conservatives have been more concerned about appeasing Anthony Blinken and the American quest to conquer Russia. To hell with the economy or the people. Britain was fully on board with the Globalists, which was precisely OPPOSITE of all the positions to retain independence from Europe, which were the core policies of Lady Thatcher.
I have done some interviews in Britain where the host reluctantly put me on the air because of my connection with Lady Thatcher and their obstinacy about even trying to understand her policies. Many regard her as the most hated Prime Minister, all because they were used to handouts. They claim that she destroyed Britain’s manufacturing industry, and her policies led to mass unemployment. That was absurd, for the world was engulfed in the crisis at the time – not just Britain.
I advised companies that wanted to get into the EU and needed skilled labor to place them in Britain, while I placed those that needed the best tax deals, like airlines, in Ireland. Thatcher had heard that there was this guy rearranging companies and wanted to meet me. She asked me why I placed industries in Britain compared to other European countries. I explained that the cost per employee in other regulations was 40% less in Britain compared to Germany at the time.
Others argued that she presided over 15% interest rates. Again, that was not unique to Britain; it was a global trend. Most of the complaints about Thatcher were based on their ignorance of global trends. No single country can reverse a worldwide recession, no matter who the politician might be. The very best you can do is minimize the volatility and depth of the decline.
I did feel the public would never understand her reasoning regarding the poll tax. She felt that if people had skin in the game, this would limit government waste. But the people, I said, are like dogs. They are satisfied with the scraps from your table, not about jumping on your table and eating the whole meal. Others complain that she sowed the seeds of NHS Privatisation. I think Russia proved, as did ancient Byzantium, that the government is INCAPABLE of running anything efficiently. Those who hated Thatcher seemed to want to be taken care of and had no interest in their country.
What the self-centered haters of Thatcher refuse to understand, no less acknowledge, is that she SAVED Britain. I remember she said if she walked across the Thames River, they would say it was because she did not know how to swim. The coup staged against her by John Major and others was to take Britain into the fantasy land of the Euro. Major took Britain into the ERM and overvalued the pound, which led Soros to make his fortune thanks to John Major and others.
She knew that Tony Blair would win long before there were polls. When I asked why, she told me, “It’s Just Time.” She understood cycles better than any Western politician I have ever met. So while the ignorant still hate Margaret Thatcher, they will now get to see what voting for self-interest will do with promises of more money.
The one thing I have learned from our computer is that if you turn the economy around with these Economic Confidence Model turning points, you will get political change. What is sweeping the world is that 60% of it is going to an election, and WHOEVER is in power is just being thrown out. The Globalists have been trying to take over everything, creating their dream of a one-world government headed by the United Nations with the elimination of our right to vote on anything. Their dream is a global dictatorship. Democracy must end as part of their agenda. It is refreshing to see Macron in trouble, as is Prime Minister Rishi Sunak. World leaders like Trudeau in Canada, Biden in the USA, and Ursula in the EU have a common goal – war against Russia at all costs and the creation of this one-world government bringing Democracy to an end. The people are responding regardless if they call themselves conservative, liberal, labour, or communist. Whoever is in power is taking the brunt of this global political shift.
Posted originally on Jun 21, 2024 By Martin Armstrong
Rather than being pesimistic, our future depends on understanding who is doing what. It has been the Neocons in the Biden Administration who have lived their entire lives hating Russians, and Victoria Nuland, Antony Bliken, and Merrick Garland are all Jewish who trace their roots to Ukraine and profess that their families suffered in the persecutions of Jews by the Russians. All three have weaseled their way to the top of the food chain, and with the absentee president, they have pushed the entire world to the brink of World War III. NOT A SINGLE member of Chongess will even dare to investigate what is happening. Nobody will stand up to defend our people or the future of our children and grandchildren.
The report is $35
The Democrats have flooded the country merely to retain power, and they do not charge about the people or the nation – it is just about retaining power. This 2024 will be a joke, and NOBODY will accept the outcome regardless of who wins. The days remaining in the like-expectancy of the United States are numbered. As I outlined in the special report on the Migrant Crisis, this will backfire on the Democrats, for the unskilled people they are flooding the country with will turn on Americans exactly as took place in ancient Rome when Emperor Valens did the same thing as Biden and opened the border. When they turned against the Romans, there was a huge battle, and even Emperor Vales was killed in that battle by the migrants.
The report is $10
I have laid out how the 2020 election was REALLY stolen – inside Congress, not by voting machines or people who counter votes twice. I have put this out for $10 because I fear they will do this again. Everyone would understand how it was really done using even COVID Rules that Pelosi imposed so not more than 53 people were allowed on the floor when any challenge must be debated before the full Congress. They may be preparing to use Bird Flu to support mail-in ballots, and the same scheme appears ready to replay.
The Global Positioning System (GPS) was launched on February 22nd, 1978. A nuclear explosion in the lower atmosphere would destroy all the satellites we use, even for targeting. Such a blast may even prevent future satellites from deploying for up to one year. The Neocons have their fake media out there saying Putin is desperate, and they have the audacity to say his nuclear weapons are old and would not operate. Everything they say is to make it sound that the West can easily defeat Russia.
Once upon a time, we had leaders who sought world peace. This book has a special place in my library. It was a great honor to have been called in by the Reagan Administration on economic concerns. I can tell you that the Neocons then OBJECTED to Reagan’s meeting with Gorbachev, and they advised him, “You can never trust a Russian.” If the Neocons ran the world, it would be in ashes by now. I have NEVER met people with hatred in their souls. They are consumed with hatred and should NEVER be allowed anywhere near the reigns of power.
All I can say – get off your ass. At least write to your PRETEND representative and ask why nobody is interested in peace anymore.
Posted originally on Jun 19, 2024 By Martin Armstrong
QUESTION: Mr. Armstrong, I don’t mean to be disrespectful, but it certainly seems obvious just how many governments are using Socrates. The head of Serbia has come out and said we could be in World War III in three months. Orban came out and said NATO was “getting closer to war” every week, and he refused to participate in the alliance’s long-term plan to aid Ukraine, which Budapest has called a “crazy mission.
My question is, do you think Socrates influenced the time for this?
FD
ANSWER: I understand what you mean. That is actually the same theory as to why they put me in prison to shut me up. They always assume that events can be influenced by merely forecasting them. They believe in random walks because they are incapable of seeing the patterns. They try to manipulate society by themselves, attempting to steer us through their hoops just as they have lied to start every single war starting with Vietnam. Yet, when they have constantly been wrong, and their Keynesian Economic Models are failing, all I have ever heard is that I have manipulated the world economy only because the forecasts were correct. That proved it was not the model, but my influence.
I have paid the price for my discovery, and so has my family. There are those who want to force the world to respond as they desire, and all I do is say here is the cycle, and this will be the outcome. They do not like that. This is the secret cycle as the New Yorker called it, because they do not teach cyclical theory in universities because we have to be able to manipulate the future.
I was turned off by formal education because, in real science and physics class, they said there is nothing that is random, but in economics class, I was told everything is random so they can manipulate us to create their perfect world. I figured someone was a liar.
I went with Einstein rather than the Marxists. Yes, at this stage, many governments, companies, and individuals around the world subscribe to our services. It is not that they do as the forecast states. Many who disagree still want to know what we are saying.
Many have come to realize that the forecasts are NOT my personal opinion. Real, intelligent people have realized that LONG-TERM forecasts are infallible because a single factor does not change the course of the trend. We are headed into war because we have chronic fiscal mismanagement, and they need war as a distraction and to provide the excuse to default, and then a new government gets to start fresh all over again. That becomes inevitable, but the trend is set in motion, and the government will NEVER reform to save the nation when they must relinquish power.
Most people DO NOT comprehend how forecasting works or the global economy within which we live. There is the short-term NOISE, such as the share market may be up 300 points today and then down 500 tomorrow. Some wish to try to judge you based on that nonsense. The Global Market Watch has demonstrated that there are tens of thousands of patterns that make the short-term appear to be random – but nothing is random, and only a fool makes such an argument. All the numerous short-term trends combine into a single voice, and that resounds loudly through the hall of time and circumstance. It is like politics. Raise taxes, and you get civil unrest. Just look at most revolutions – they are over taxation. Yet politicians will increase taxes always to retain their position of power, and that inevitably leads to revolution. All of the daily ups and downs do NOT alter the long-term trend for that is set in motion that stretches back decades that cannot be altered.
This is why our model is divided by TIME. You can be a 7-day bullish trend on the daily level that is no more than a minor reaction on the Weekly level. The long-term trend cannot be altered by a single event. It is forged in the furnace of life where everything from climate and war to economics and politics combine to make the trend. As they say, such people cannot see the forest because they are focused on a single tree.
Back at the 2011 World Economic Conference in Philadelphia, which you can see in the video, I stood up and warned that the War Cycle would shift in 2014, and that was indeed on target with the Ukrainian Revolution – Maidan of 2014. But in 2013, still one year in advance, I warned:
So many wars have occurred in Crimea since ancient times that the sum of all the parts enabled the computer to pinpoint Ukraine, where this would all begin. Here is a coin of Nero issued for his intervention into Crimea – the Bosporus at the time.
The LONG-TERM forecasts are much easier to do than where the Dow closes tomorrow. When I die, they should play one of my favorite songs – Sinatra’s My Way!I was lucky to see him live once at the Latin Casino in Cherry Hill, New Jersey. Indeed, I did it my way, and I would not change the past, for that is what has taught me what I know today.
Posted originally on Jun 6, 2024 By Martin Armstrong
COMMENT: Marty, I attended your Toronto Institutional session when the Bank of Canada had a table of 10 people. People would ask you what the central banks were looking at, and you would respond. Everyone then turned to see if they flinched. They were the best of times, as they say.
For us long-timers, it was no surprise that the Bank of Canada was the first to cut rates in turn with the ECM. I know you do not like to court the mainstream press, but one of these days, somebody has to have the guts to stand up and say that there is a business cycle.
Your legacy has made a difference. I share your goal to purge our governments of political manipulation that causes more harm to the people and the economy than anything else.
It was refreshing to see the Bank of Canada act with the ECM. You even put on the blog that June would be the opportunity for the central banks to cut rates. Well done, as always.
KW
REPLY: Yes, they were simpler days. It’s nice to see you are still active. Most of the major central banks know the Economic Confidence Model. It was good to see that the Bank of Canada acted in advance for the first time until waiting for the crash. It would be better if they could purge the fiscal side of these insane pretend experts like Janet Yellen and the Neocons. Then there will be a future worth leaving our grandchildren.
We now have universities inquiring about buying quantities of the books I have been publishing. It is great news that they are starting to introduce students to reality. I am working hard to finish the major book on the Economic Confidence Model, the New Yorker Magazine, called The Secret Cycle.
Posted originally on May 28, 2024 By Martin Armstrong
Economics is well known for rather unrealistic theories based upon fundamentally unsound principles, such as the assumption that all things remain equal. Reality parts with academics whenever such assumptions are drawn to a foregone conclusion. However, greater false assumptions, which go unnoticed, lie at the foundation of so many theories in economics – primarily the assumption of linearity.
In our thinking process, we all are trapped by the Aristotelian sequence of logic – if X takes place, then Y must follow. Unfortunately, we think linearly and, as such, most theories seek to embellish this very basic assumption. The financial world honestly wants to believe in simplistic notions. Raising interest rates and demand will subside along with inflation is one false linear assumption. Man prefers to believe in linear relationships and systems because anything beyond two variables becomes far too complex for rational thought processes.
Man’s natural tendency toward linear thinking has indeed created many heated battles. The arguments between supply and demand-side economics is one such example. Given the assumption of a linear economy, demand-side economists argue that the economy can be controlled through the manipulation of government spending and interest rates. In effect, demand-side economics seeks to use the consumer (demand) as a club to beat capital over the head. Yet these same demand-side economists claim that supply-side economics benefits the rich at the expense of the poor. Strangely enough, throwing the consumer out of work and causing higher unemployment to affect lower demand is the core of demand-side economics. It is hard to see how the demand side benefits the poor at the expense of the rich. The supply-side economist argues that there should be less government intervention in demand. Instead, the government should stimulate the economy by encouraging greater output through supply stimulation.
Both sides have identified two extremes within a non-linear system, even though their arguments, based upon a linear assumption, assume that the other is totally wrong. If we look at just the last 10 years of economic activity, we can clearly see changes within the infrastructure that provide a period when each form of economic management would indeed be appropriate.
Looking at the period 1976–1980, it would be difficult to label this period as anything other than an inflationary spiral led by demand. Raising interest rates would be appropriate under such conditions when demand flourishes wildly beyond its normal capacity. Hoarding and speculation were in full bloom. Therefore, one should employ “demand-side” economics when demand is, in fact, out of control.
Nevertheless, in the post-1986 era and particularly since the ’87 crash, speculation is hardly the issue. We do not find excessive demand leading to the hoarding of commodities, as was the case leading into 1980. Yet, governments around the world are still employing demand-side economics to curb inflation, which is being caused by real shortages in labor and commodities. Clearly, in this case at least, supply-side economics makes much more sense. If interest rates continue to rise, the world economy will be threatened by a sharp and severe recession. However, the shortages on the supply side in energy, agricultural, and base metals will not be corrected by raising interest rates. Higher interest rates will not cause the weather to return to normal. Higher interest rates will certainly not encourage miners to open new mines. Higher interest rates will also not cause a reversal in trend within the energy sector where exploration has been cut by more than 50% in the last two years.
Supply-side economics is as valid as demand-side economics. Everything within the system has a time and place because the system itself is non-linear. The chart provided illustrates our Theory of Non-Linear Intervention. This theory is very simple and based upon actual observation.
The standard economic assumption under demand-side economics is that raising interest rates will lower demand and inflation. Continually raising interest rates does not prevent inflation. At some point in the system, confidence breaks down, and higher costs in interest rates only add to the costs of production and doing business. Eventually, this spurs inflation instead of reducing it. They attempted to go to negative interest rates, trying to stimulate inflation by punishing people if they failed to spend their money. This attempt failed because they overlooked the simple fact that people will hoard when worried about the future.
The evidence of this is all the hoards of ancient Roman and Greek coins that reveal in times of uncertainty, people simply buried their money for a rainy day. The very basic assumption that the system is linear is obviously incorrect. The business cycle exists throughout all times and portrays the system as non-linear. If any effect is taken to extremes, the exact opposite effect emerges. This is the result of non-linear intervention. Each economy possesses a different infrastructure. Consequently, the threshold where interest rates will cease being anti-inflationary and transform itself into the catalyst of inflation resides at different levels in each economic system. Differences in the value of labor, taxation, political systems, and market mechanisms must be taken into account.
In conclusion, government intervention, which seeks to manage the economy in an efficient manner, always fails because they are conflicted with self-interest. They are the biggest debtor within society. Attempts to only manage the economy by demand-side economics ignore the free market entirely. Intervention cannot possibly work when government remains in the dark about how the economy even functions. They fail to comprehend the direction and cause of inflation or deflation. The first step is recognizing that there is a business cycle, the second is to accept that a cycle exists, and third, we merely try to prepare for the downturns exactly as David advised the Pharaoh – seven years of plenty v seven years of drought.
“I named my computer model after Socrates because the oracle of Delphi had said that he was the smartest man in Greece. He tried to prove the oracle wrong and the process proved it to be correct. He was put on trial and sentenced to death because he knew too much. My computer has taught me a lot in geopolitics, we had a major bank in Lebanon in the 1980’s and they asked if I could create a model on the Lebanese pound. I put the data in the computer and it came out and said their country would fall apart in 8 days. I thought something was wrong with the data. When I told the client, they asked me what currency would be best, and I said the Swiss Franc. Eight days later the civil war begn. Obviously they saw the movement of money themselves and came to me for the timing. The same thing happened with a client in Saudi Arabia who was a big shipper. He called me asking me what gold would do tomorrow because Iran was going to begin attacking shipping in the gulf. So once again, there was advanced information about war. By 1998, I understood how the computer was forcasting such events. I warned in June at our London conference that Russia was about to collapse. The London financial Times had snuck into the back of the room and reported that forecast on the front of their newspaper on June 27th 1998. Russia collapsed about 6 weeks later.”
Posted originally on May 24, 2024 By Martin Armstrong
In an interview on May 11, 2014, I explained on USAWatchdog that confidence always outweighs reality. “It’s basically what you believe. There have been all sorts of studies on fundamentals that say if interest rates go up, stocks go down. It is simply not true. The stock market has never peaked with interest rates twice in history. If you think you are going to make 25% in the market, you’ll pay 10% interest; but if you really think the market is only going to go up 10%, you won’t pay 10%. So, it’s always the difference between what you believe and reality.”
The people have lost all confidence in government. There were rumors of a “soft landing” from the Fed, but the situation can no longer be controlled by the central bank. Washington maintains that everything is stable as banks continue to fail and inflation rages on. There can be no price stability when war is at play. Government spending has reached a new high, as have taxes which are not counted in any major data report. I explained in 2014 that great empires all come crashing down after piling on massive debt. People believe hyperinflation would cause such a scenario, but debt is the major player. Once the government accumulates enormous debt, it targets its citizens aggressively. That is what we are seeing today.
So where should you put your money? I said in 2014: “One of the number one questions I get all the time is where do I put my money? If the banks can just take whatever they want now, there will be bail-ins rather than bail-outs. People are afraid. What do you do with the cash? So, people are buying things like real estate and stocks, just trying to get money out of the banking system.” Smart money has been trying to escape the banks for years. There was no incentive until very recently to park money in the banks due to artificially low rates. The hunt for taxation is causing people to flee from the banks. The downturn in government trust has caused everyone to run from government debt for fear that it will not be repaid.
I also explained that the Fed would only bail out deposits and had been asking institutions to change their models. “Everybody knows I advise some of the big institutions around, and I can tell you that they have told me directly that the Fed went to them and told them they will not be bailed out for proprietary trading. It will be only on deposits. That’s it,” I stated. “The Fed has been going around telling them, ‘hey, you better change your models.’ They don’t think it will be a flight to quality as it was before. You buy the long-term (Treasuries), and that saves you. They don’t think that’s going to happen. It’s quite interesting. . . . It looks like the long-term (Treasury bonds) is going to end up starting to rise.”
Sound familiar with the current situation? People have moved from the public sector into the private sector. We are well into a private wave, and the public will not go back to the public sector for many years to come. By that time, the government will have transformed into a new model that is far different from what we have today. My warning from 10 years ago was derived from the computer models, who never relies on mere opinion and are unable to factor in bias.
When I say that the computer is honing in on a new target or date, often, we must simply look at what unfolds on that target to understand the full forecast. We are waiting for the CONFIRMATION. The computer will give us that signal and we just have to go with the flow. It may be worse than trying to give a 5-year-old cough medicine. Yes, it tastes horrible, but it is necessary for the cure. The majority will not be able to make that transition thanks to their preconceived ideas and preconditioning. Many pilots who flew prop planes could never fly a jet because they could not make that transition to faster travel requiring quicker reaction times. This is the type of transition we face. We just have to abandon all prejudice and go with the markets. May 7 marked a major shift in the geopolitical landscape that ensures major conflicts with both Russia and China are on the horizon. I trust the trends in motion to forecast the future. As they say, the trend is your friend.
I have created this site to help people have fun in the kitchen. I write about enjoying life both in and out of my kitchen. Life is short! Make the most of it and enjoy!
This is a library of News Events not reported by the Main Stream Media documenting & connecting the dots on How the Obama Marxist Liberal agenda is destroying America