Constructing a Future


Future

Our models have been targeting 2018 for the last 30 years as the first potential year for a monetary crisis and reform. There was a shot that we could have doubled the Dow and everything would have bottomed on the first potential, such as gold in 2013 to 2014, and then turn up into that target. But the markets have been dragging this affair out so long that it looks like this is the beginning rather than the end point, and the real chaos is just extending into the next 8.6-year cycle. This is why we have the Reversal System, for it provides the numbers we have to achieve to confirm the trend. Just as we missed the 17800 on the Dow for the close of May, everything happens for a reason.

The vast majority remains bearish on the Dow, and, of course, the gold promoters always say the dollar is worthless, but their forecasts have not changed for decades. The Dow has all these people claiming it is overvalued and has to crash. Then we have Fed watchers who just focus on domestic numbers and ignore the entire world trend.
It is clear that everything is within a staging position in preparation for something really big. While so many say this is the end of the world and everything will go to zero, such events have never corresponded to their scenarios in history.

The most likely course of action has not changed. When confidence in government collapses among the GENERAL MASS PUBLIC, everything will breakout. Listening or convincing oneself about fiscal mismanagement of government is nice, but the general population is what counts. They are the movers and shakers. We merely jump to their actions.

Reversals TimingSo the computer gives us the numbers and the time. They simply have to be elected to confirm a trend. All I can do is articulate the points and then say here are the points and the time.

What we are facing is nothing anyone has ever experienced. So it is not going to be easy to come up with some “gut feeling” or opinion that matters. Whatever we “think” will or will not happen is irrelevant. Everything is changing. Financial analysts are failing everywhere. Hedge funds are losing money. The only way to trade is with something definitive without the personal opinion.

The days of searching for some guru who is never wrong from an opinion perspective are gone and only fools seek such ideals. We are heading into the eye of a financial storm that will topple governments. The future is being constructed before our eyes if we wake up and just look. The hard heads always lose everything because they are too stubborn and incapable of adjusting their investment strategy. Those looking to buy growth or value in equities will also lose their shirt for this is not a normal trading affair.

The Supreme Court Just Created a Full-Blown Police State – The End of the USA Cannot Be Far Behind


US Supreme Court

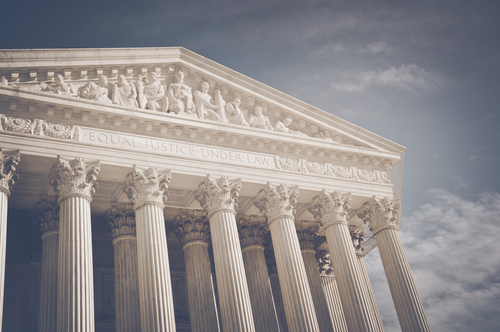
The Supreme Court ruling in Utah v Strieff awarded the police total freedom to stop any citizen, at any time, to do whatever they desire. The Supreme Court determined that the “poisonous fruit” of a police officer’s stop of a citizen can be used against them at trial. This has wiped out, in reality, any constitutional protection you thought you had. This is a sad day for the United States, for the Supreme Court has officially created a full-blown police state and clearly has no intention of honoring why this nation began the entire American Revolution —  to prevent illegal searches that allowed the king to look for anything he could use to prosecute citizens.

The Supreme Court ruled that even though the officer had initially violated a person’s rights (in other words, the Constitution) the officer’s conduct was “at most negligent” and the result of “good-faith mistakes.” This language is a wink and nod to the police who only have to claim they made a mistake that was not intentional and they walk free. We have witnessed police outrageously murder citizens, but the police officers involved are usually not charged. Now, with this decision, the United States has become exactly as Ukraine stood before the people revolted.

A friend of mine from Ukraine came to the states before the last revolution. When they would see a police officer, they would tense up and try to avoid them at all costs. At home, the police were the criminals. They would shake you down, abuse you, and there was simply no rule of law. The Supreme Court, as of yesterday, has committed suicide.

Otis-James

In February 1761, James Otis, Jr. (1725–1783) argued brilliantly against the Writs of Assistance that was authorized in 1660 but became an instrument of tyranny in 1758 in the American colonies as a means to raise taxes. For nearly five hours, Otis made a brilliant oration in court against the Writs, but he lost the case, for what judge would ever rule against his master? John Adams later wrote that “the child independence was then and there born, [for] every man of an immense crowded audience appeared to me to go away as I did, ready to take arms against writs of assistance.” This spirit of resistance appears to rise roughly every 51.6 years, albeit at different intensity.

This very power to arbitrarily search anyone sparked the American Revolution. No taxation without representation followed, but the inspiration was the right to be free and the Supreme Court just took away. The police no longer have restraint. This is the final stage of how empires, nations, and city-states collapse when there is no rule of law. Once the state elevates itself above the people, the end is not far behind. The dissenting words of Justice Sonia Sotomayor reflect the dire state to which the United States has degenerated.

Sotomayor Justice

Scalia would have joined Justice Sotomayor on this one, and if he were still alive, he would have tipped the scale and protected our liberty. With Scalia gone, who was a strict constructionist, there is little hope left in the Supreme Court. Justice Sonia Sotomayor wrote, “Even if you are innocent, you will now join the 65 million Americans with an arrest record and experience the ‘civil death’ of discrimination by employers, landlords, and whoever else conducts a background check.”  She concluded, and I must agree:

By legitimizing the conduct that produces this double consciousness, this case tells everyone, white and black, guilty and innocent, that an officer can verify your legal status at any time. It says that your body is subject to invasion while courts excuse the violation of your rights. It implies that you are not a citizen of a democracy but the subject of a carceral state, just waiting to be cataloged.

We must not pretend that the countless people who are routinely targeted by police are “isolated.” They are the canaries in the coal mine whose deaths, civil and literal, warn us that no one can breathe in this atmosphere. They are the ones who recognize that unlawful police stops corrode all our civil liberties and threaten all our lives. Until their voices matter too, our justice system will continue to be anything but.

Central Banks Made Government Debt the Riskiest Debt of All Time!


End of Everything

The central banks have risked it all and lost. They have reached the point of no return. The Fed decided not to raise rates, which are desperately needed to prevent a collapse in pensions and insurance companies, and merely froze like a deer in headlights. The superficial analysts who think lower rates are good for the stock market are blinded by their own stupidity. The theory that low rates will encourage people to buy stocks is brain-dead and demonstrates that these people are incapable of comprehending how the economy functions.

CALLMONY-MA

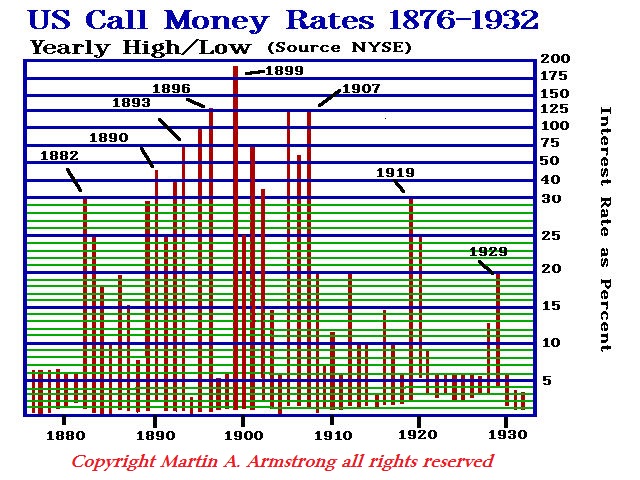
We have taken simple correlations of interest rates and the stock market and discovered something in plain sight. The market has NEVER peaked with the same level of interest rates in history. WHY? It is not the empirical level of interest rates that matters, rather it is the rate of interest that is a factor of expected inflation. Therefore, if the expectation of gain is greater than the rate of interest, there is profit in borrowing. If the expectation is below the rate of interest, then the rate must decline. Consequently, assuming that simply raising or lowering rates will reverse the trend is primitive and lacks any analysis whatsoever.

The central banks have gone way too far and are now trapped. They do not have the ability to influence the economy anymore for they are loaded with government debt that will default. They have converted government bonds into one of the riskiest asset classes of all time.

More and more of our institutional clients (pensions & insurance) are bailing out of government bonds and switching to corporate. Why? No major corporate debt becomes worthless. One was audited by S&P and they remarked that they were taking on more risk. They conducted their own studies to verify what we have been saying and found no corporate defaults, but countless government defaults and partial defaults. In the few rare cases of a default, you receive a payout after liquidation. In the case of government debt, you have something to frame and that is all. Government debt is unsecured and since they have the guns and the armies, you cannot force them to pay anything.

Some insurance companies have come out and stated publicly that they are selling government debt and moving to corporate. Swiss Re AG moved more of its investments into corporate debt as conceded by its chief investment officer who said, “If you’re looking for a bubble, here you go…With government bonds, you’re not adequately compensated for the risk you’re taking.”

We have been in meetings with pension funds. Here too, we find the same response. They are starting to shift. Government debt has become a time bomb. A simple 1% rate hike will be devastating to bond values and blow the budgets of government sky-high.

The European Central Bank has created a total mess of the European banking system. Negative interest rates have been devastating. Now in the Middle East, the National Bank of Abu Dhabi and First Gulf Bank PJSC are exploring a potential merger to create the largest lender in the Middle East. But forget the fluff — banks do not merge unless there is a problem. Rumors behind the curtain say First Gulf Bank PJSC is in trouble.

Negative interest rates have destroyed much of the economy. The rise in regulations and taxes have combined to create the weakest recovery in the United States post-Great Depression. This is not going to end nicely. It is only a matter of time before the general public begins to see the real crisis, and then everything will explode in their faces.

Analysis of Global Temperature Trends, May, 2016, what’s really going on with the Climate?


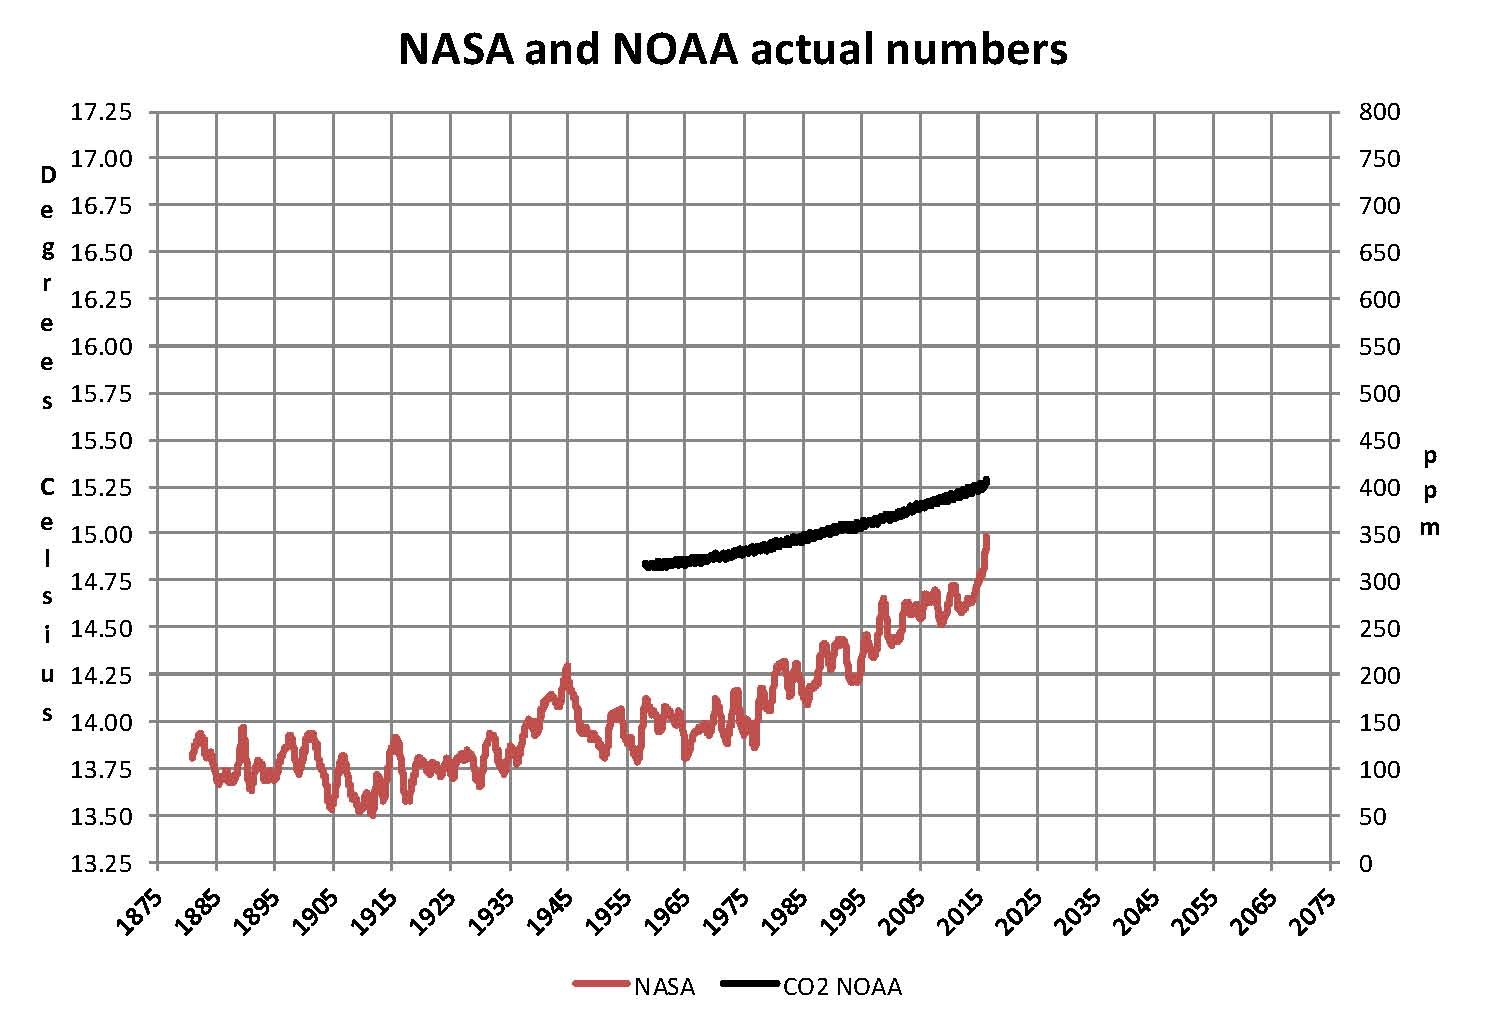
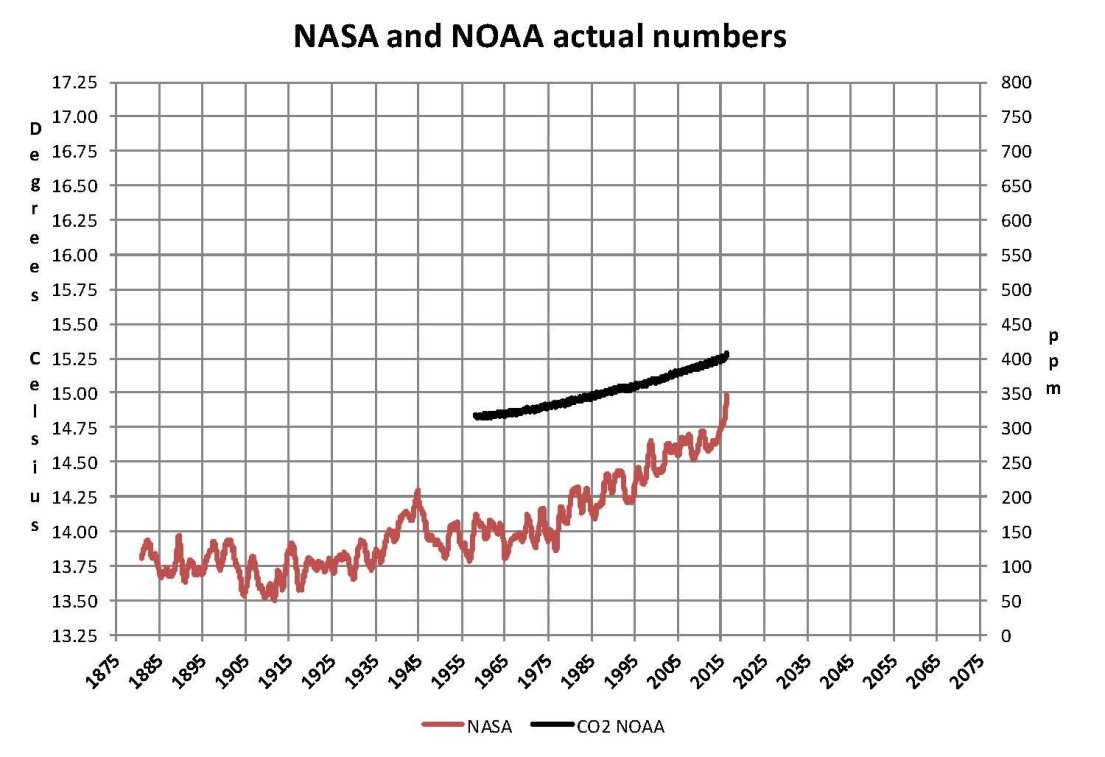
The analysis and plots shown here are based on the following two data series. First NASA-GISS estimates of a global temperature shown as an anomaly (converted to degrees Celsius) as shown in their table Land Ocean Temperature Index (LOTI) and shown in the following Chart as the red plot labeled NASA. This plot is shown as a twelve month moving average to minimize the large monthly swings and better show trends the scale for the temperatures is on the left. Second NOAA-ESRL Carbon Dioxide (CO2) values in Parts Per Million (PPM) which are shown in the following Chart as a black plot labeled NOAA. This plot is shown exactly as the data from NOAA is presented and not as a moving average the scale for CO2 is shown on the right.

NASA published data as stated in the first paragraph is shown as an anomaly, but what is a temperature anomaly?  An anomaly is a deviation from some base value normally an average that is fixed. There were two problems with the system that NASA picked which were number one there is no “actual” global temperature and two since climate is a variable there cannot be a real base to measure from. NASA known for its expertise back in the day thought it could get around these issues and created a system to do so. First they developed a computer model which took readings from all over the planet and made adjustments to them called homogenization and came up with the estimated global temperature. Second they picked the period 1950 to 1980 (30 years) and averaged the values and came up with 14.00 degrees Celsius and make that their base.  Then they took that temperature and subtracted the base from it which gave them the anomaly. The problem is that both the base and the anomaly are arbitrary.
NASA 01

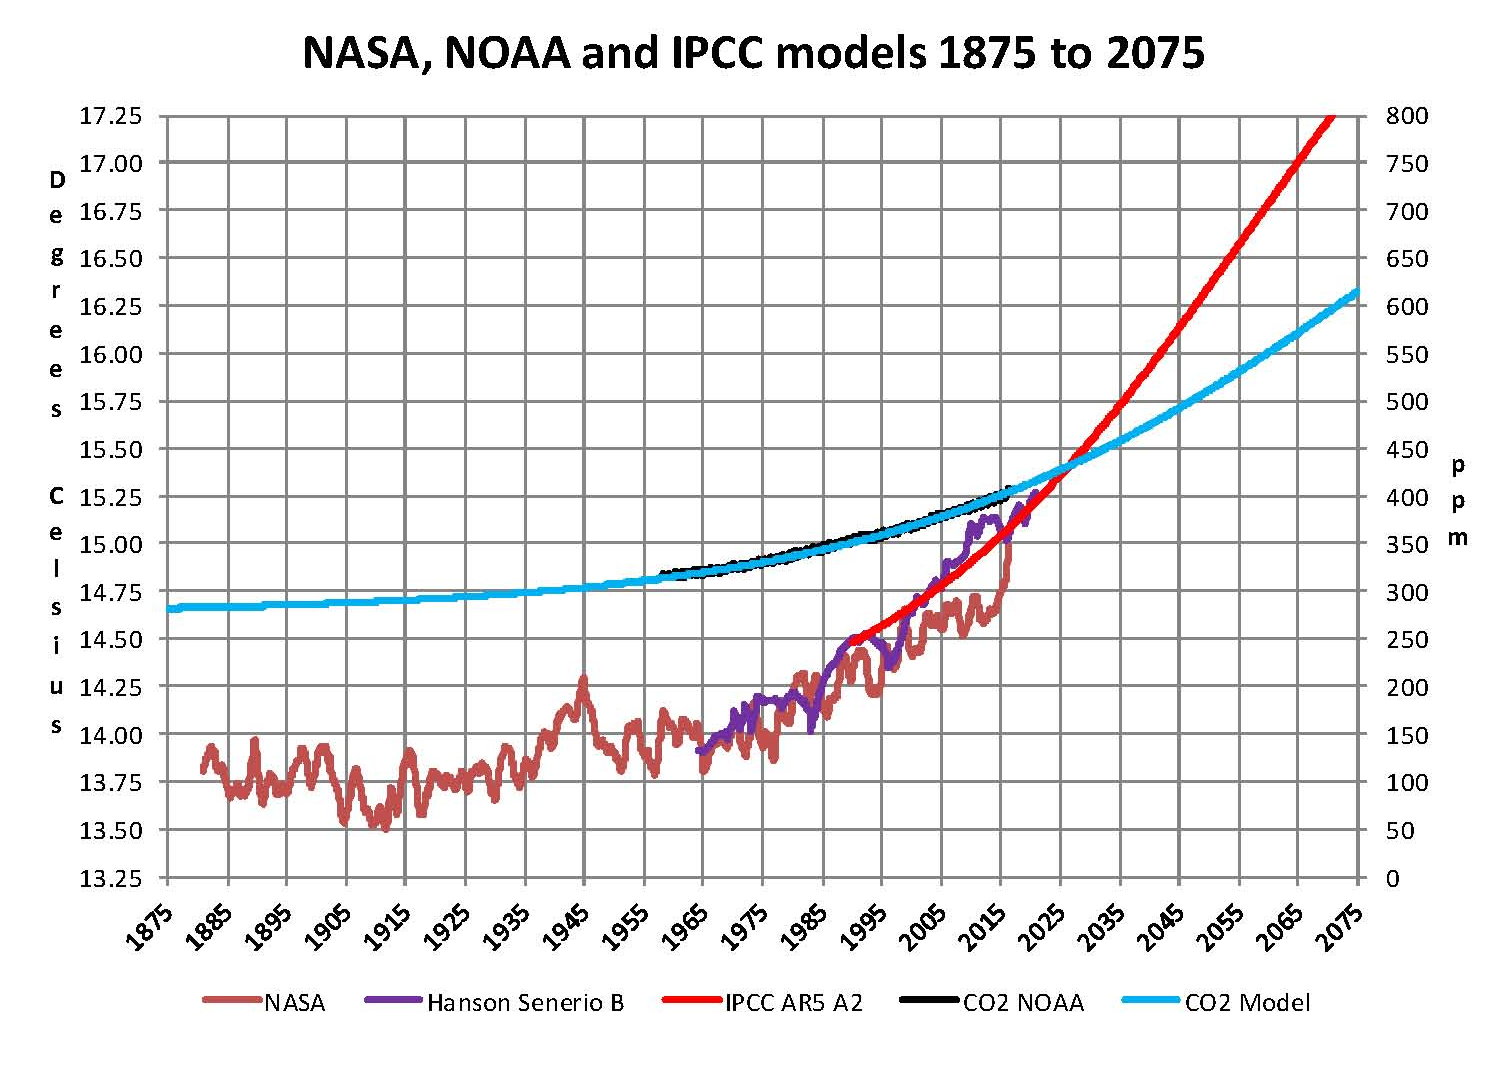
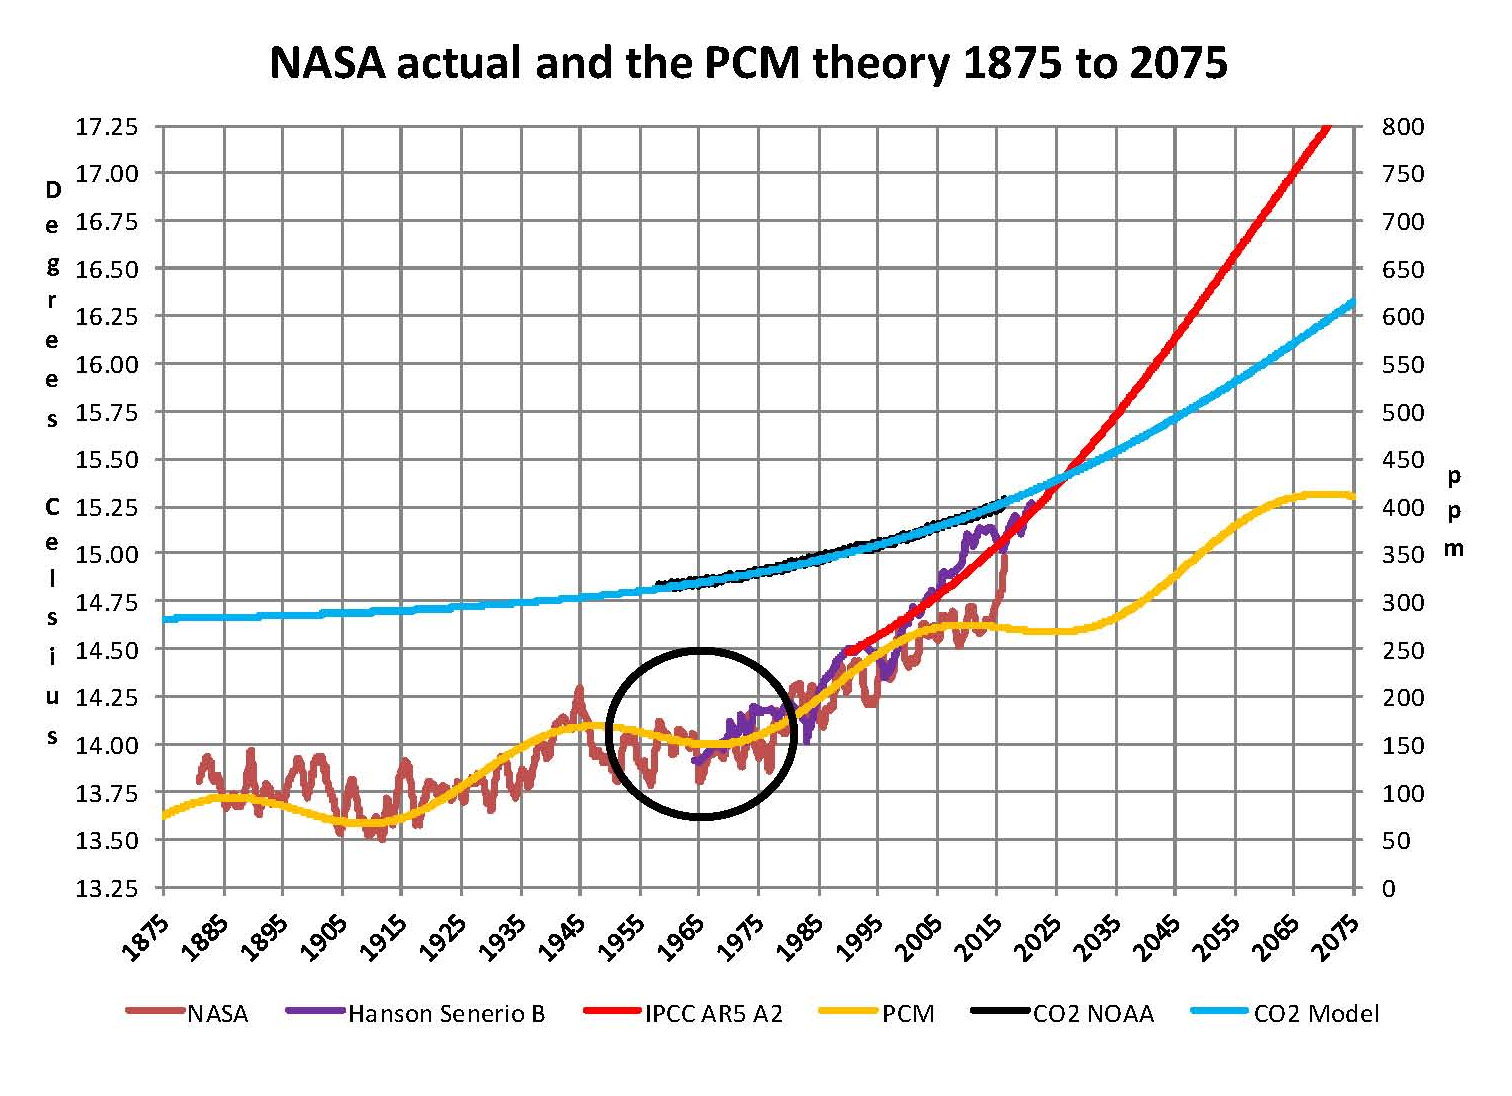
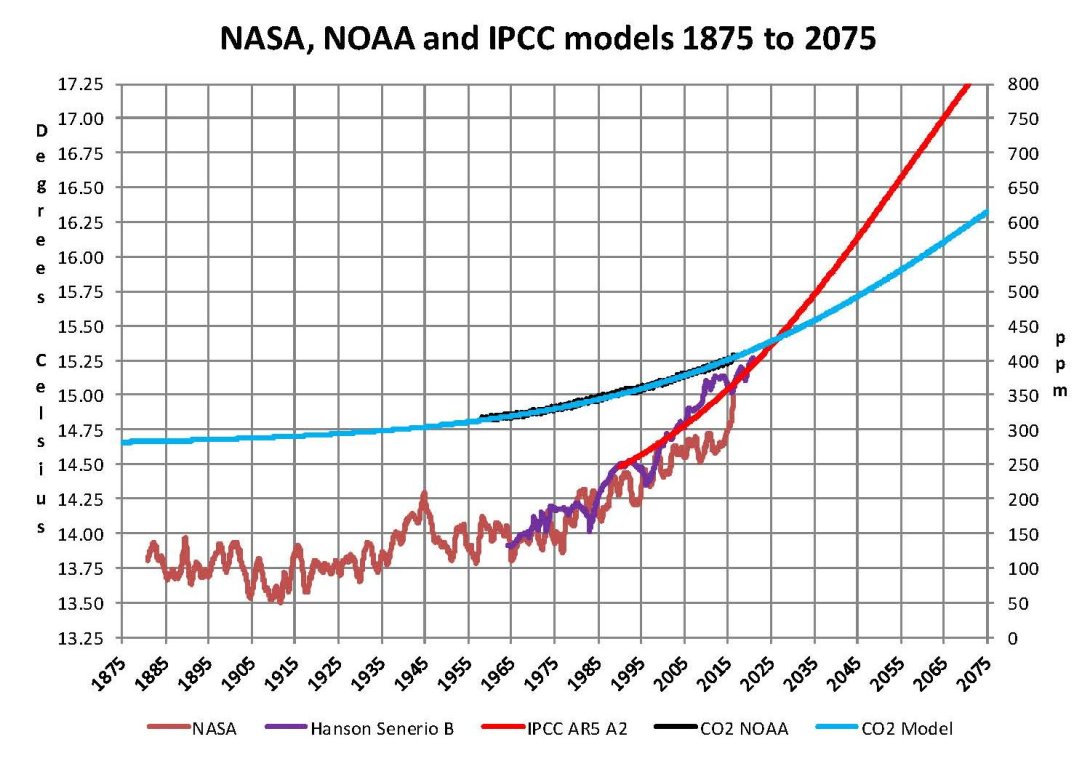
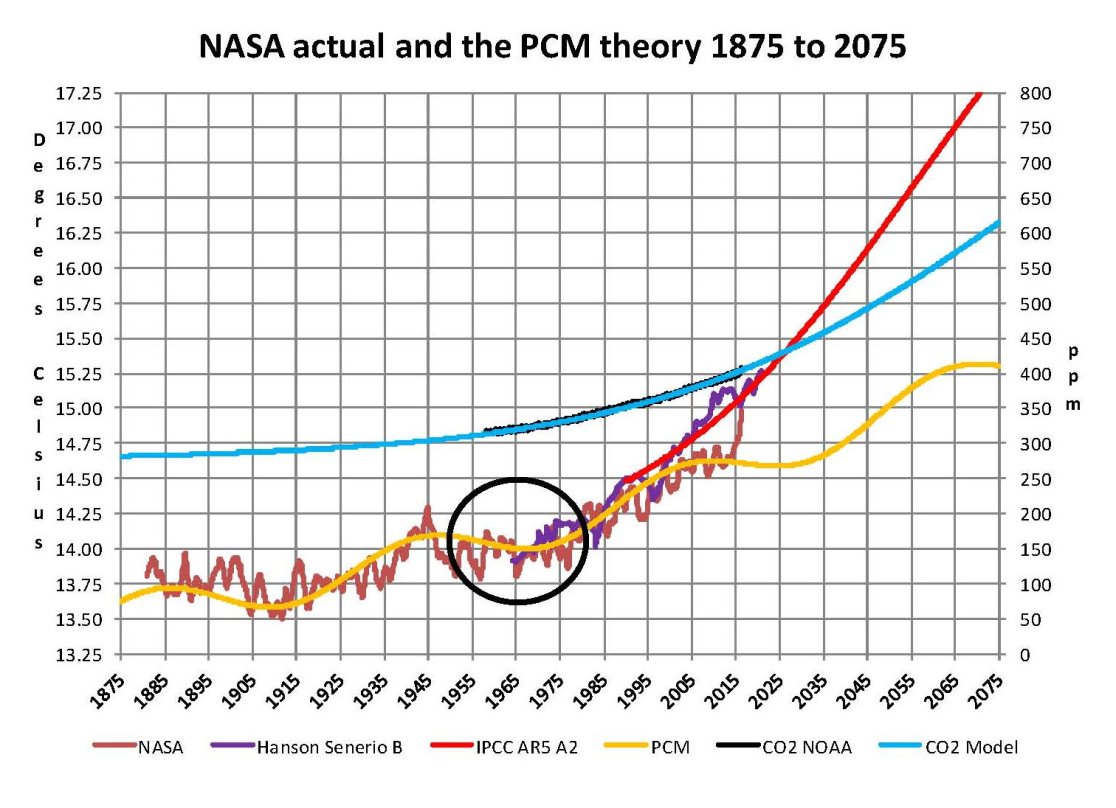
Now that we have a base to work with we are going to add to the previous Chart three things. The first is a trend line of the growth in CO2 since that is the entire basis for climate change according to the government through NASA and NOAA. That plot is superimposed over the black plot of the actual NOAA CO2 values as the cyan line labeled as the CO2 Model and one can see there is a very good fit to the actual NOAA values so there should be no dispute about its validity.  This plot allows us to make projections as to future global temperatures according to the science. The second added item is James E. Hansen’s Scenario B data, which is the very core of the IPCC Global Climate models (GCM’s) and which was based on a CO2 sensitivity value of 3.0O Celsius per doubling of CO2. This plot is shown here in lavender and is part of a presentation that Hansen showed to congress in 1988 when the UN was about to set up the International Panel on Climate Change (IPCC) and this plot is labeled as Hansen Scenario B which Hansen stated was the most likely to happen based on his theories’.  The third item is the current plot of the most likely temperature of the planet based on the growth of CO2 published by the IPCC. This plot is shown in Red and is labeled as IPCC AR5 A2 as that is the table where the data was found. This plot is a GCM computer projection of the planets temperature based to the complex relationships developed on the levels of CO2 by the IPCC through NASS and NOAA.

It can be seen in this Chart that the lavender plot and the Hansen plot are very close from 1965 to around 2000 after that, from 2000 to 2014, there is a very large and growing deviation reaching close to .5 degrees Celsius in 2014, which is not an insubstantial number.  Also of note is that there doesn’t seem to be a good correlation between the growth in CO2 and the increase in the planets temperature. The CO2 is going up in a log function and the Temperature was going down in a log function until recently where it reversed and is now going up in a log function. That major change in direction that occurred in 20014 is the subject of this paper.
NASA 02

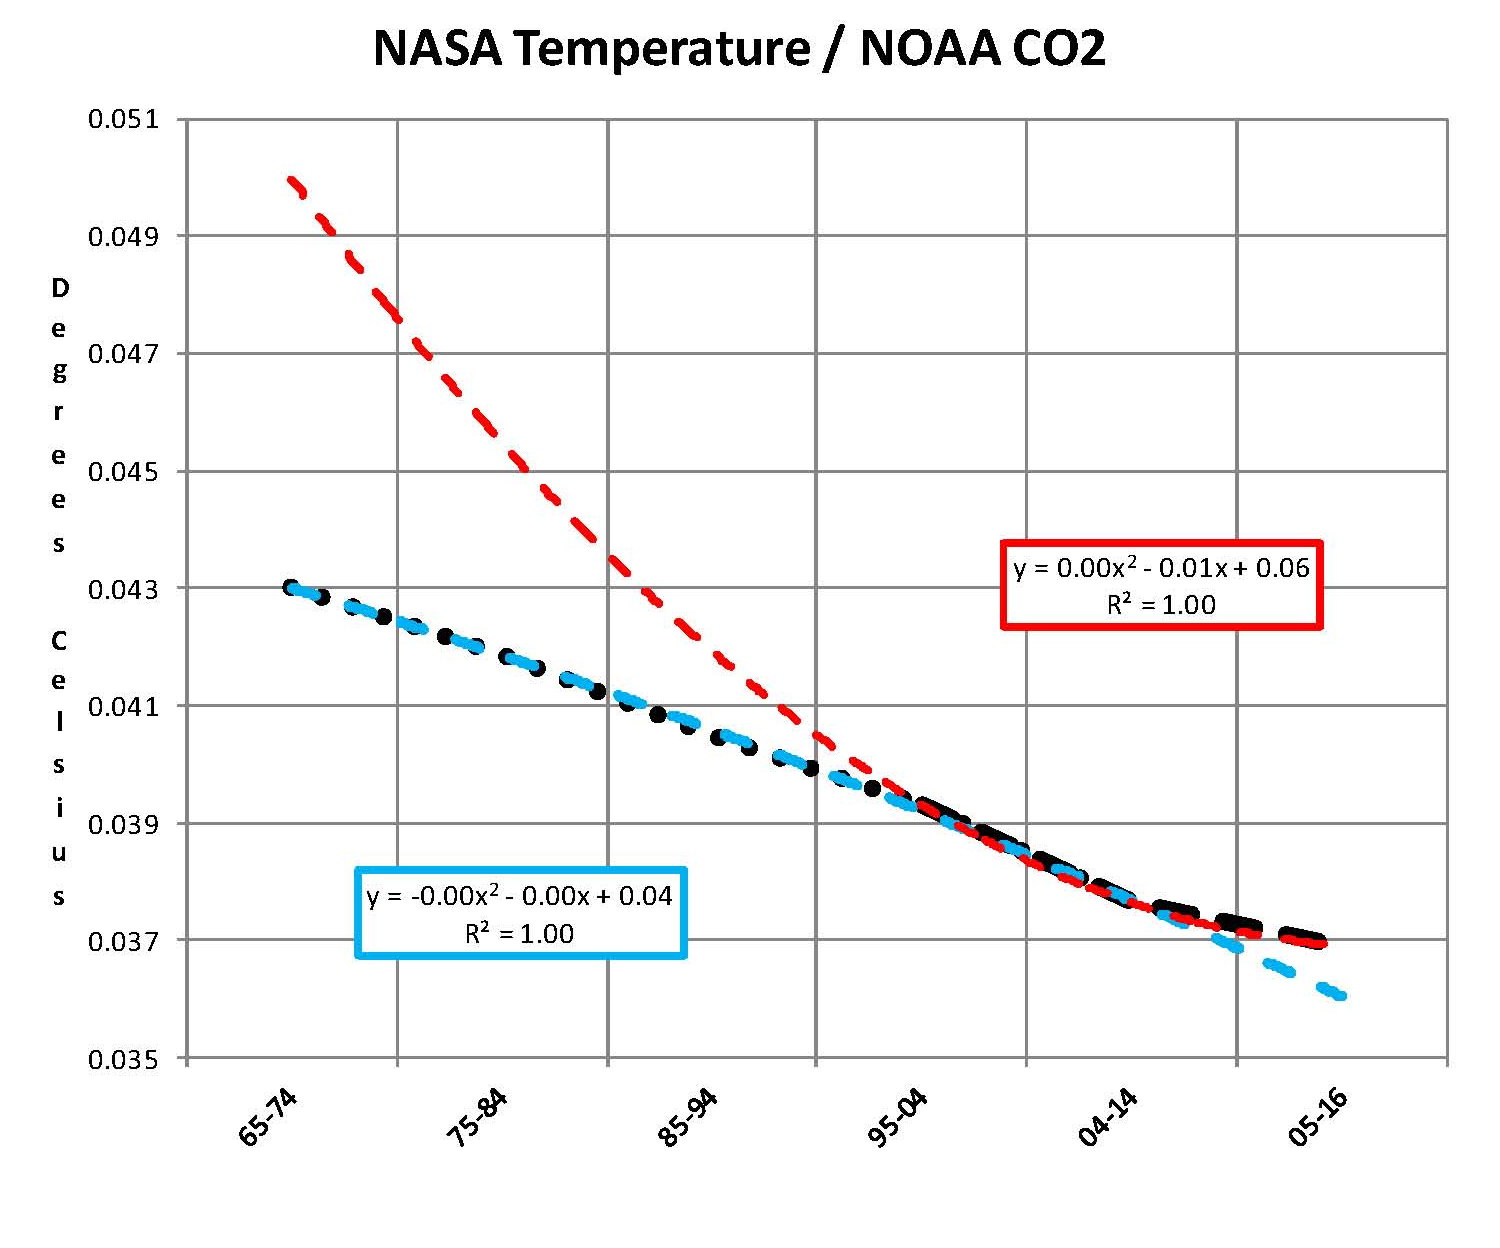
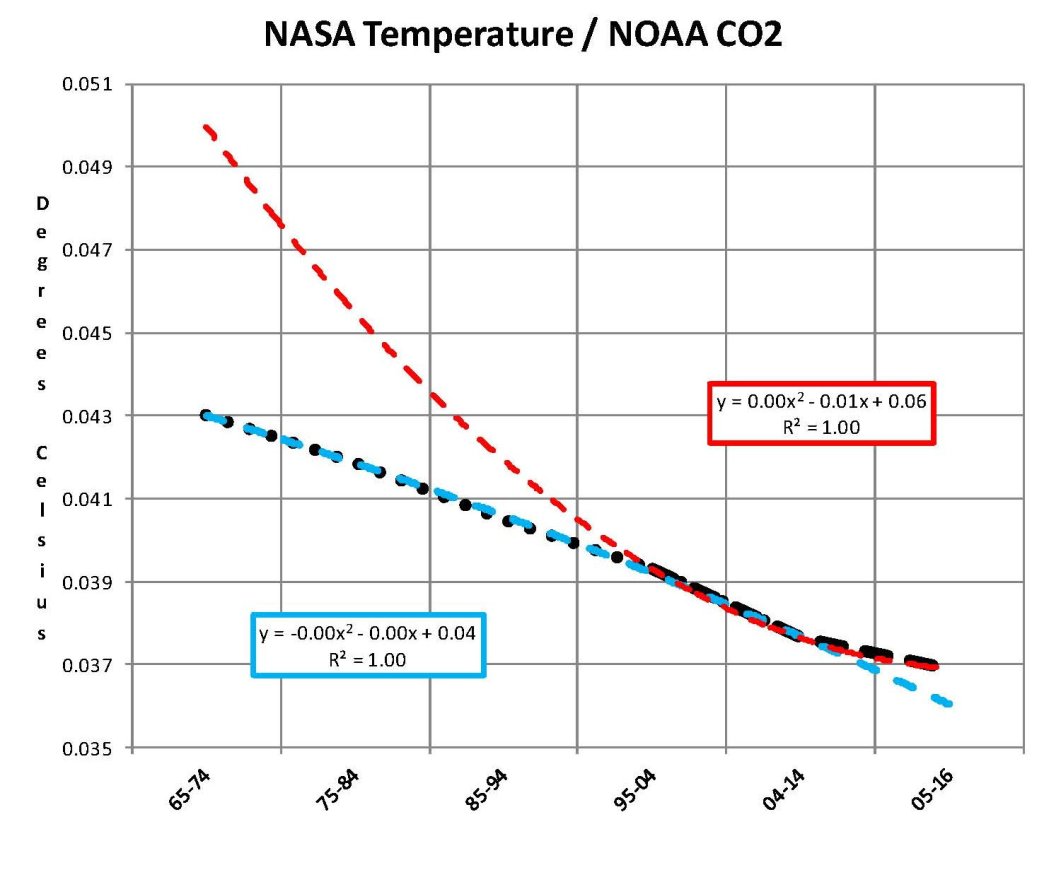
The next Chart is developed from the raw data from NASS and NOAA as shown in the first Chart.  This plot was made first by adding ten years blocks of temperature and CO2 as indicated in the Chart and diving by 120 to give an average for each.  Then the average Temperature was divided by the average CO2 to give degrees of temperature increase per PPM of CO2. After that was plotted it appeared that there were two different curves the first was from block 1965-1974 through block 2004-2014 shown as Black Dots and the second was from block 1995-2004 through block 2005-2016 shown as Black Dashes. When trend lines were added they were both almost perfect fits to the raw data and so you cannot see the data points  very well on the Chart.  These blocks were picked to represent the entire period of time where we had both NASA temperature data and NOAA Co2 levels.

On the following Chart are two sets of color coded information. The first is Cyan plot and the Cyan box with the equation in it along with the R2 value 0f 1.0 are for the first series from block 1965-1974 through block 2004-2014. The other is the Red plot and the Red box with the equation in it along with the R2 value of 1.0 which are for the first series from block 1965-1974 through block 2004-2016. We can speculate on how this change has happened but it cannot be said that the plot change is not real; however additions data over the next few years will be required to actually prove that something has changed.

In summary the Cyan data set indicates a diminishing effect of CO2 on global temperature for about 54 years and the Red data set represents an increasing effect of CO2 on global temperature for the past 2 years. Since both data sets have an R2 value of 1.00 the trend lines cannot be in question.
NASA 03

Before we get into a possible explanation to the drastic change from the Cyan data to the Red data that occurred in 20014 we need to consider other factors than CO2 on Climate change.  The fault that occurred in the work that was done in the 1980’s was in assuming that there was an optimum or constant global temperature and therefore any change that was being observed was from the increasing amount of CO2 in the atmosphere.  There may have been correlation but it was never proved that there was causation (high R2 value) between CO2 and global temperatures. With that assumption which limited options we moved from true science into the realm of political science.  True science has an open mind and finds relationships that work in matching observations with predictions.  Political science changes history and/or facts to match the desires of the politicians. Since the politicians control the money political science is what we get; which means that what we get may not be technically correct.

A decade ago when I started looking at “climate” change the first thing I did was look at geological temperature changes since it is well known that the climate is not a constant; I learned that 52 years ago in my undergrad geology and climatology courses in 1964. The next paragraph explains currently observed patterns in climate related to this subject.

Ignoring the last Ice Age which ended some 11,000 years ago when a good portion of the Northern hemisphere was under miles of ice the following observations give a starting point to any serious study on the subject. First, there is a clear up and down movement in global temperatures with a 1,000 some year cycle going back at least 3,000 to 4,000 years; probably because of the apsidal precession of the earth’s orbit of about 20,000 years for a complete cycle. However about every 10,000 years the seasons are reversed making the winter colder and the summer warmer in the northern hemisphere. 10,000 years from now the seasons will be reversed. Secondly, there are also 60 to 70 year cycles in the Pacific and the Atlantic oceans that are well documented. These are known as the Atlantic MultiDecadal Oscillations (AMO) in the Atlantic and as La Nina and El Nino in the Pacific. Thirdly, we also know that there are greenhouse gases such as carbon dioxide that can affect global temperatures. Lastly the National Academy of Sciences (NAS) estimated that carbon dioxide had a doubling rate of 3.0O Celsius plus or minus 1.5O Celsius in 1979 when there were only two studies available and one for sure and maybe both were not per reviewed.

The result of looking objectively at the three possible sources of global temperature changes was a series of equations based on these observations that when added together produced a sinusoidal curve that seemed to follow NASA published temperatures very closely.  Since this curve was based on observed temperature patterns it was called a Pattern Climate Model (PCM) which has been described in previous papers and posts on my blog and since it is generated by “equations” many assume it is some form of least squares curve fitting, which it is not. It does seem to be related to ocean currents.

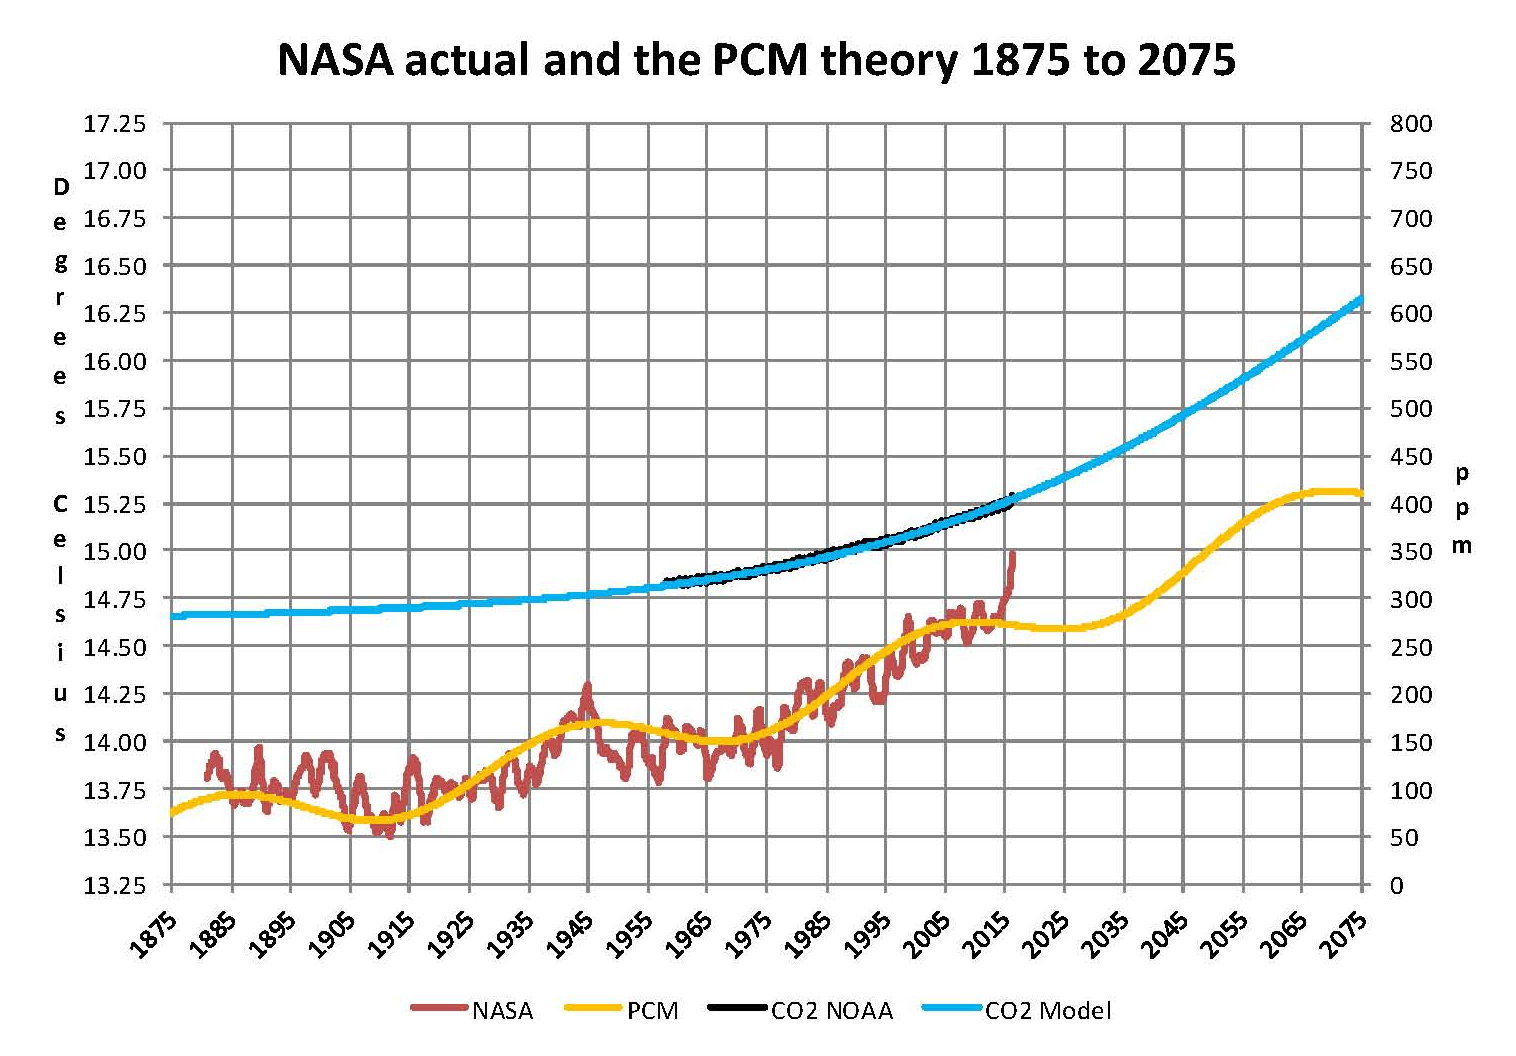
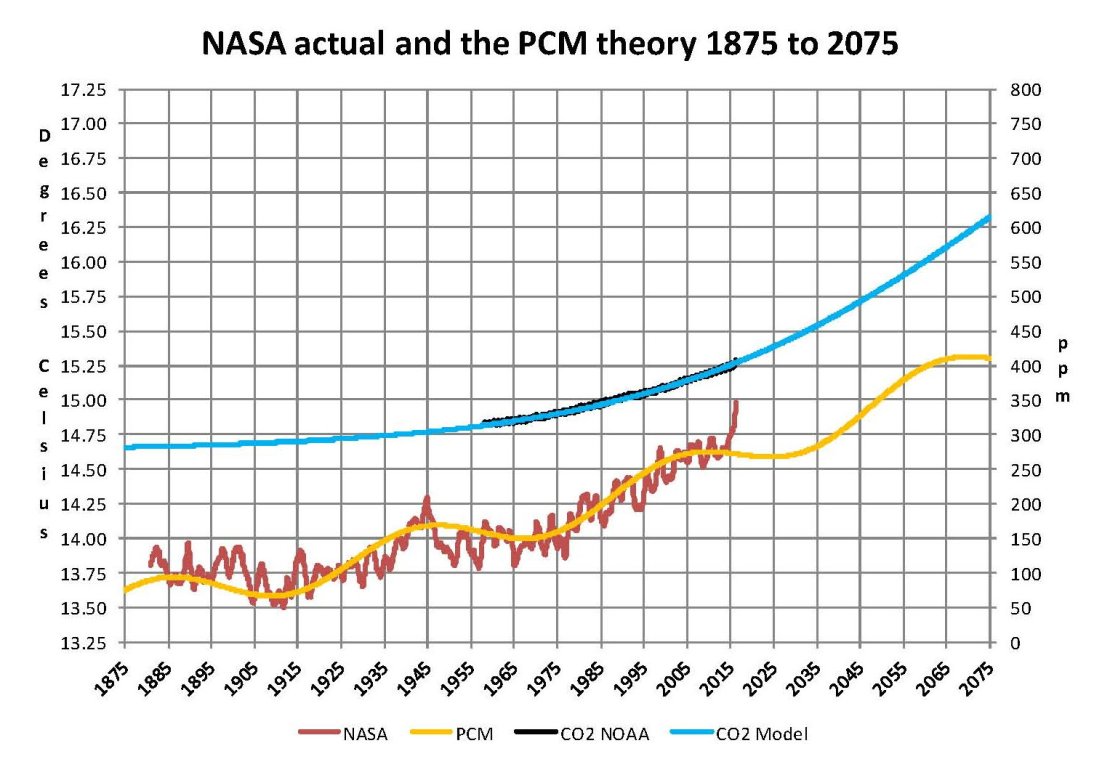
As can be seen in the following Chart the PCM there is a 69.1 year cycle that moves the trend line up and then down a total of 0.29O Celsius and we are now in the downward portion of that trend (-.01491O C per year) which will continue until around ~2035.  This short cycle is clearly observed in the raw NASA data in the LOTI table going back to 1880. Then there is a long trend, 1036.7 years with an up and down of 1.65O Celsius (.00396O C per year) also observed in the NASA data. Lastly, there is CO2 adding about .0079 degrees Celsius per year so they all basically wash out at -.0039 O C per year, which matches the current holding pattern we are experiencing. After about 2035 the short cycle will have bottomed and turn up and all three will be on the upswing again.  Note: the values shown here are only representative as the actual model uses many more places than what are shown here.

When using the 12 month running average for global temperatures up until 2014 the PCM model was within +/- .01 degrees of what NASA was publishing in their LOTI table since the early 1960’s as shown in the next Chart. Further the back projection of the PCM plot matched historical records and global temperatures going back past the time of Christ. It should also be consider that geologically CO2 levels have reached levels many times that of the current 400 ppm without destroying the planet so the current hysteria over the current small numbers can only be explained by political science not real science.
NASA 04

The nest step in this analysis is to put all of the known data and projections into one Chart which will contain: NASA’s table LOTI global temperature estimates, NOAA’s actual CO2 values, the CO2 model projections, the PCM model global temperature plot, Hansen’s Scenario B 1988 global temperature plot, and lastly the IPCC AR5 A2 global temperature plot. With that done we can look at the results and try to make some sense of what is going on with the various arms of the federal government that are promoting that carbon based fuels be eliminated since they are responsible for the global temperature level  going up.  As previously started when the government pours money into the sciences the sciences respond with technical papers the support the governments views, this is what is call political science verses real science as was done prior to the 1980’s; money talks and BS walks as everyone on the street knows.  This Chart views a good overview of the current situation showing all the facts and all the projections.

This Chart contains no manipulation of the data and the only change that was made was to convert the NASA anomalies back to degrees Celsius to make it more readable to lay people.  This is only a change in units and has no bearing on the look.  A subject not broached here is that of the NASA homogenization process itself and the base period from 1950 to 1980. The portion in the black circle contains the NASA base period of 14.00 degrees Celsius and the reason it’s brought up here is that the Homogenization process causes the global temperatures to move around since the entire data base all the way back to 1880 is recalculated.  But since the base has to stay at 14.00 degrees Celsius the program must be set to not allow changes in that period of time. I’m sure the programmers have fun with that. Prior work here has shown how this creates a teeter totter effect with the data plots, some of which have recently been significant.
NASA 05

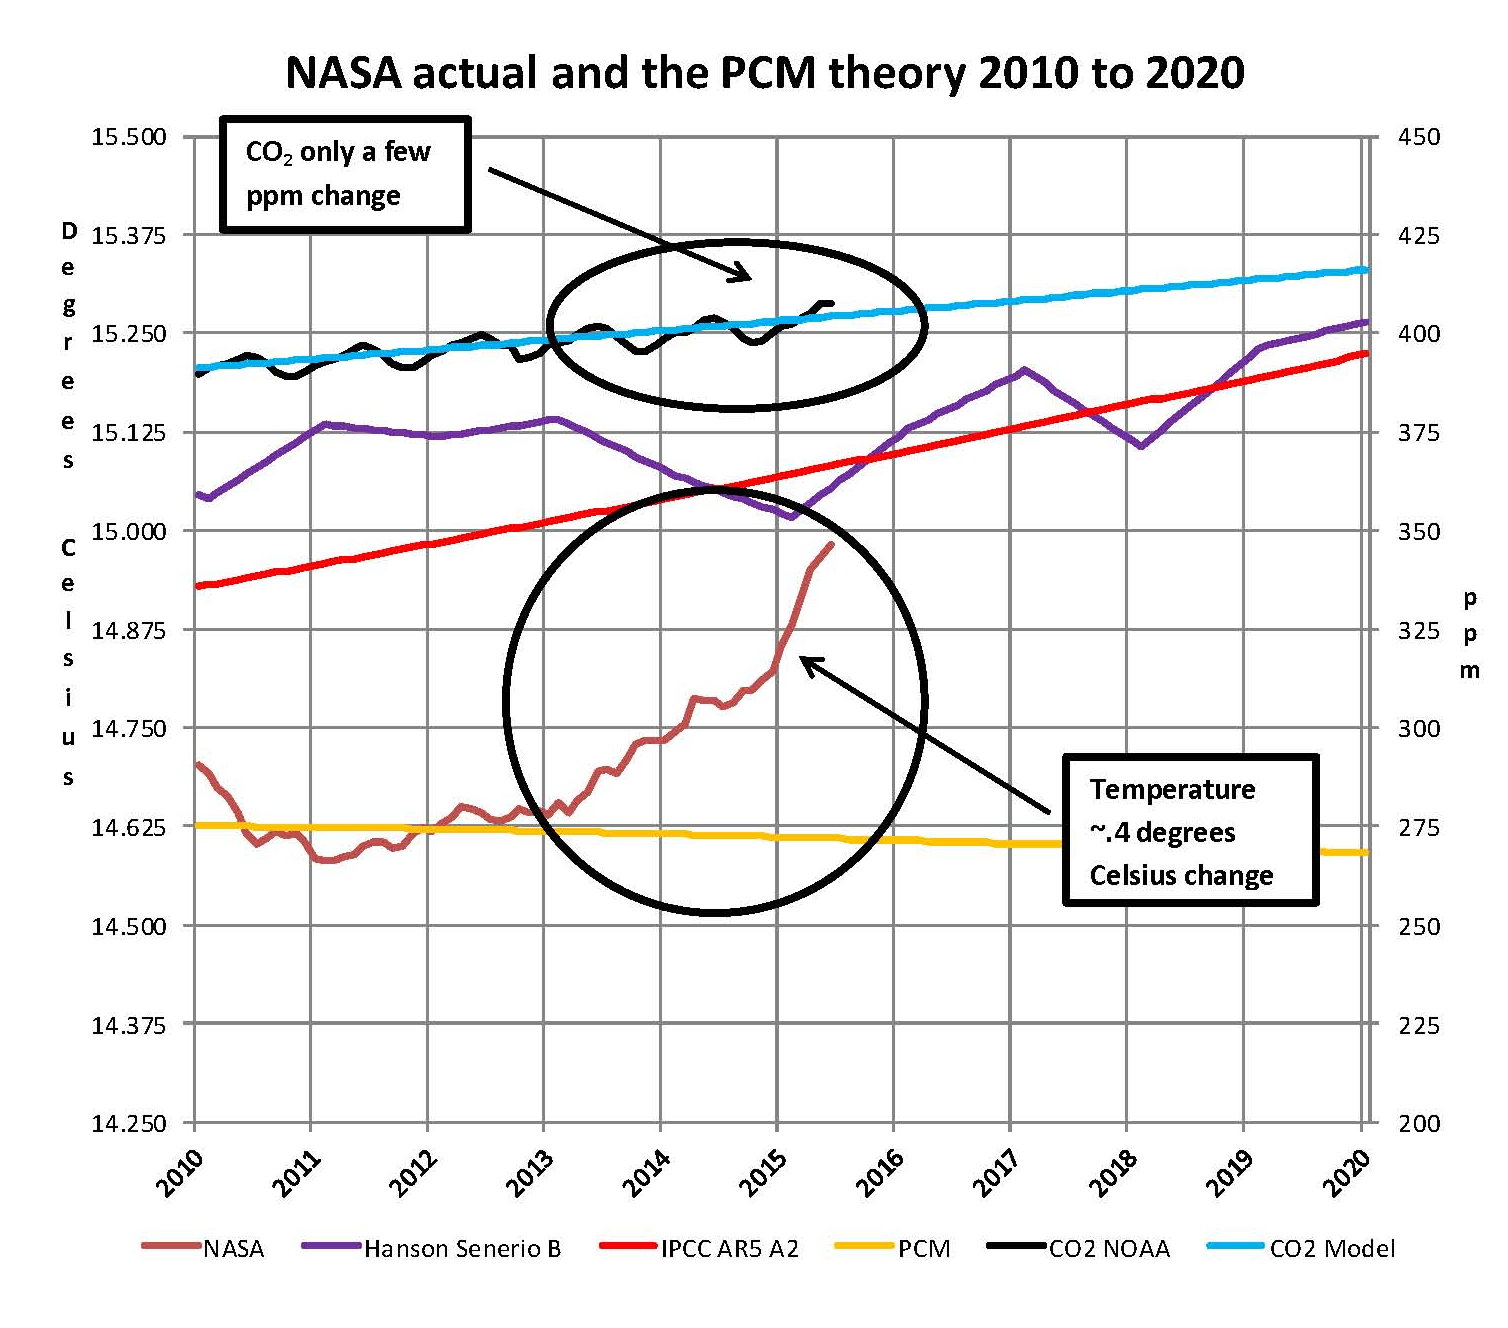
The next Chart will be a look at the period from 2010 to 2020 so we can see the detail of the past few years where a change in CO2 of only a few ppm has caused a major change in the global temperature way beyond anything previously shown in any published NASA data. There are two black ovals on the Chart one at the top of the Chart which is a black oval around the CO2 levels for 2014, 2015 and part of 2016 and it’s very obvious that there has been very little change, maybe 4 ppm or about 1%. Then at the bottom of the Chart is another black oval around the NASA global temperature levels for 2014, 2015 and part of 2016 and its very obvious that there has been a very large change, maybe .33 degrees Celsius or about 2.2%. There has never been such a large increase in temperature from such a small increase in CO2.

By contrast the previous comparable period of the last part of 2010 through 2013 shows about the same for CO2 at 1.1% but only a .2% increase for global temperature, basically flat. Worse it appears that this upward trend will continue as these values are based on a 12 month moving average and the current values being published by NASA have been very high for the past 6 months and so I would expect the NASA plot to be well over 15.00 degrees Celsius within a few months.  In looking at the raw data for September 2015 and October 2015 there is a jump of about .25 degrees Celsius that is a very large number for one month and as we have shown here in a previous chart not reasonable at all and a perfect example of political science.


NASA 06

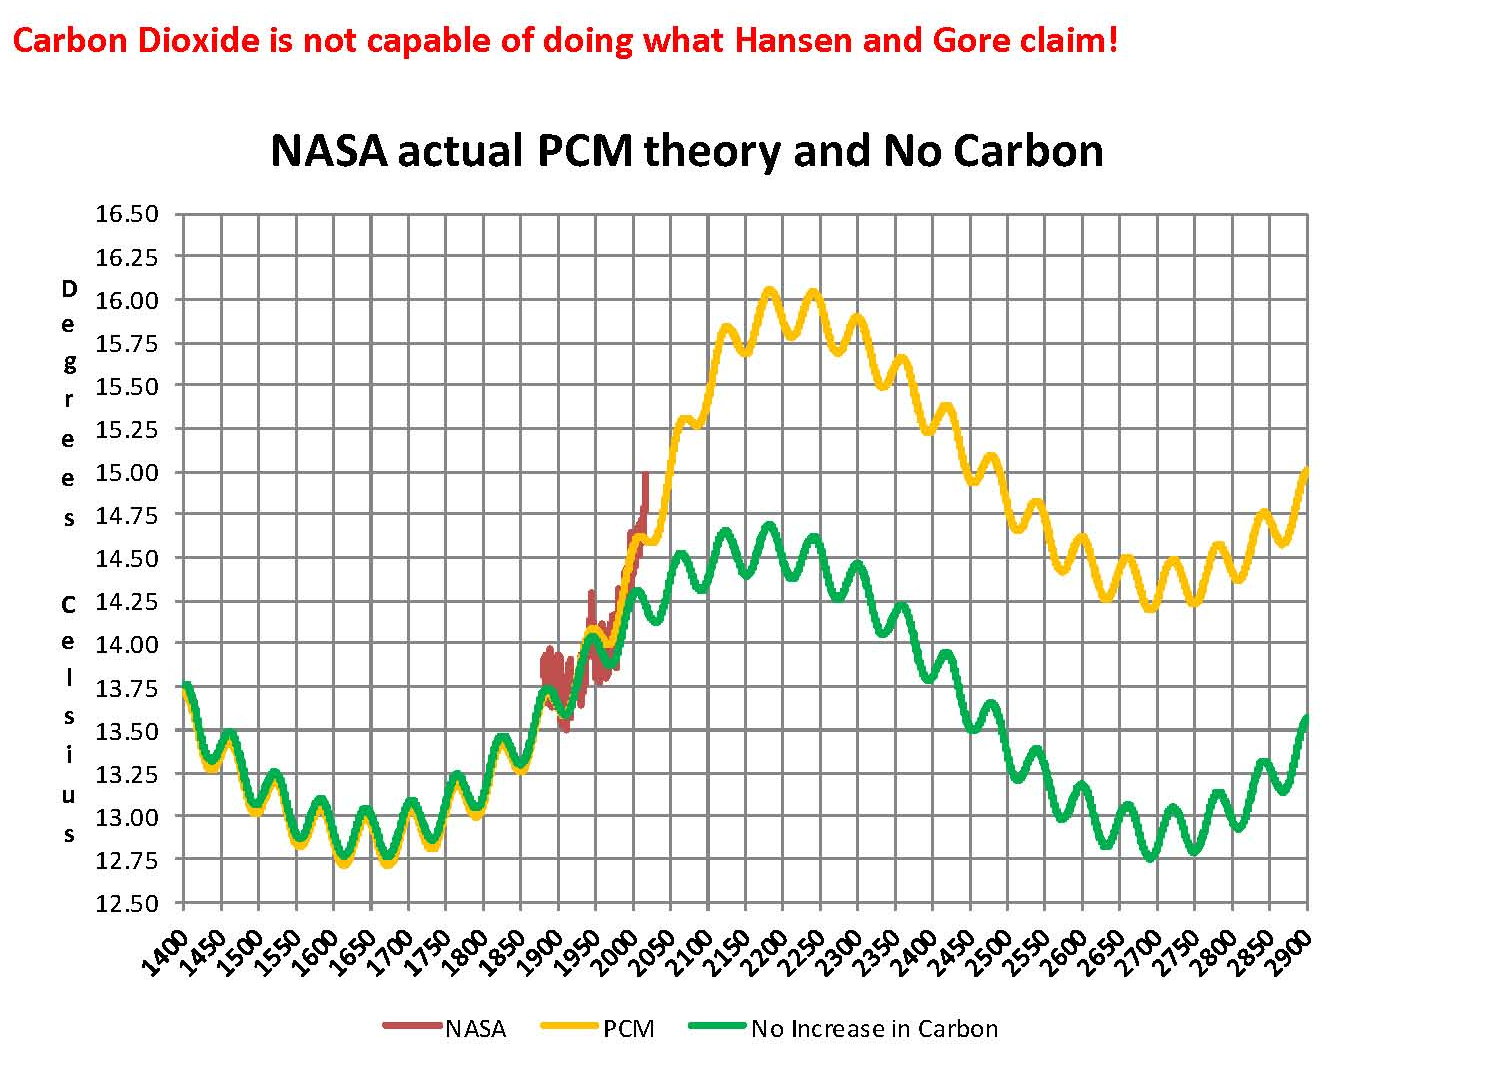
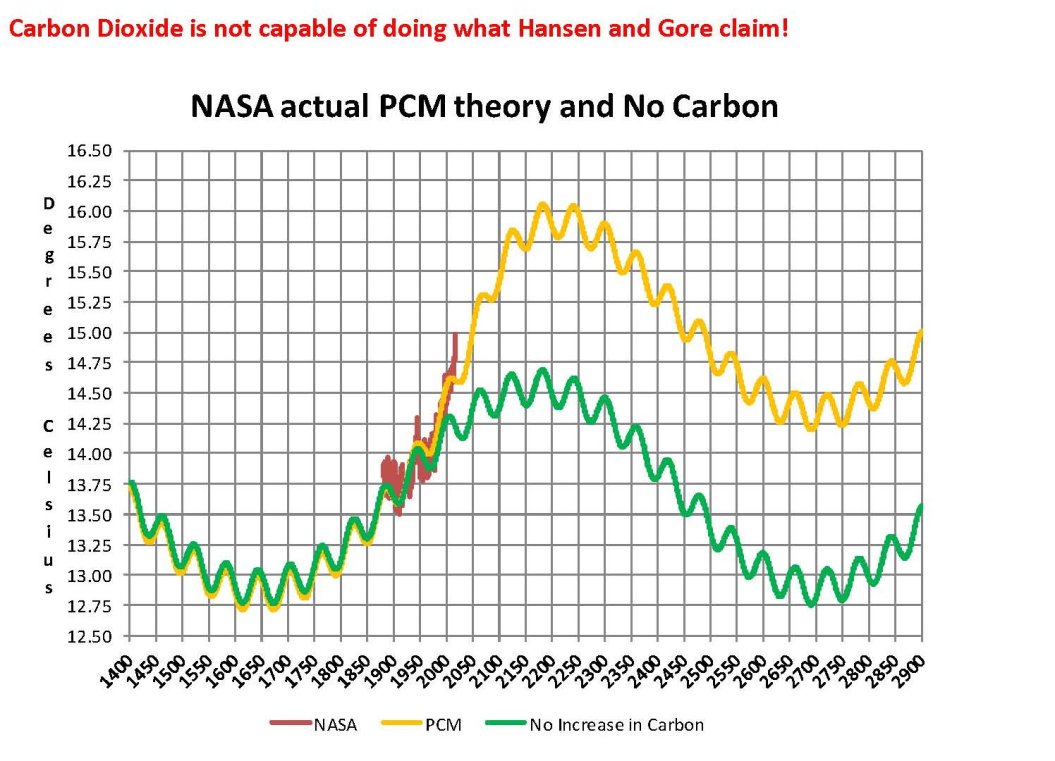
Lastly, the next chart shows what a plot of the PCM model, in yellow, would look like from the year 1400 to the year 2900. The plot matches reasonably well with history and fits the current NASA-GISS table LOTI data, in red, very closely, despite homogenization.  I understand that this model is not based on physics but it is also not curve fitting. It’s based on observed reoccurring patterns in the climate. These patterns can be modeled and when they are, you get a plot that works better than any of the IPCC’s GCM’s. If the conditions that create these patterns do not change and CO2 continues to increase to 800 ppm or even 1000 ppm than this model will work into the foreseeable future.  150 years from now global temperatures will peak at around 15.75 to 16.00 degrees C and then will be on the downside of the long cycle for the next 500 years.  The overall effect of CO2 reaching levels of 1000 ppm or even higher will be about 1.5 degrees C which is about the same as that of the long cycle.  The Green plot on the Chart shows the observed pattern with no change in CO2 from the pre-industrial era of ~280 ppm.
NASA 07

The purpose of this post is to make people aware of the errors inherent in the IPCC models so that they can be corrected. 

The Obama administration’s “need” for a binding UN climate treaty with mandated CO2 reductions in Europe and America was achieved as predicted at the COP12 conference in Paris in December 2015. To support this endeavor NASA was forced to show ever increasing global temperatures that will make less and less sense based on observations and satellite data which will all be dismissed or ignored.  Within a few years the manipulation will be obvious even to those without knowledge in the subject, but by then it will be to late the damage to the reputation of science will have been done.


Sir Karl Raimund Popper (28 July 1902 – 17 September 1994) was an Austrian and British philosopher and a professor at the London School of Economics. He is considered one of the most influential philosophers for science of the 20th century, and he also wrote extensively on social and political philosophy. The following quotes of his apply to this subject.

If we are uncritical we shall always find what we want: we shall look for, and find, confirmations, and we shall look away from, and not see, whatever might be dangerous to our pet theories.

Whenever a theory appears to you as the only possible one, take this as a sign that you have neither understood the theory nor the problem which it was intended to solve.

… (S)cience is one of the very few human activities — perhaps the only one — in which errors are systematically criticized and fairly often, in time, corrected.

Approaching Britain’s Final Hour of Independence


FIC-Y 6-19-2016

The FTSE share market index for London has long reflected the problem with the EU. Despite the lies and propaganda that the EU has been some great miracle for Britain, the low in the FTSE took place in 1974. There was a fierce bear market in the FTSE which fell into a sharp low AFTER joining the EU reflecting more regulation and an oppressive external government imposed upon the British. It was actually Margaret Thatcher who reversed the fortunes for Britain and we see the share market exploded with her economic reforms, but that would be stopped by Tony Blair. The rally which unfolded in the FTSE lasted for 25 years until 1999. That is when Gordon Brown sold the British gold reserves. Tony Blair became Prime Minister in 1997 until 2007. That shift to Labour resulted in the stagnation of the British economy reflected within the price action of the FTSE which has never been able to close higher than 1999 ever since.

British GDP Growth since 1949The FTSE made a new intraday high in 2015, however, it has not been able to close above the 1999 high for the past 17 years. This is two 8.6 year cycle durations warning that we should now begin to breakout to the upside during this next cycle, but why is the real question. The answer brings into focus the primary mover behind such a rally. This implies that the pound will FALL sharply. That may indeed be the result of Britain surrendering its independence to be ruled by the EU where it has lost 72 objections every time so far. The FTSE will rally as the only domestic means of a hedge against the government. The stock market will rise simply because people will park money in equity rather than banks or trust the currency. If Britain does not leave the EU, its currency will collapse as will the euro.

The EU even stole the British waters away from their fisherman. Britain has always been looked down upon from Continental Europe in private meeting I have ever had for decades. Britain has also been seen as an outsider and resentment has run rather deep simply because the English language became the main language in world commerce. Even in air traffic control, pilots flying internationally must speak English.

We can see the technical resistance stands at 65330 and technical support lies at 49751. This pattern is a holding pattern of stagnation. It has reflected the overall economic decline Britain has endured ever since joining the EU back in 1973.

There is little hope that Britain can be save from the EU. The vote is likely to be fixed because if Britain left, the EU would collapse. There is far too much at stake for career politicians. In such conditions, there is no limit to their machinations behind the curtain. I will reveal some of that this week as we approach Britain’s final hour of independence.

Sometimes You Just Have to Go With the Flow When Nothing Flows


Todd River Regatta
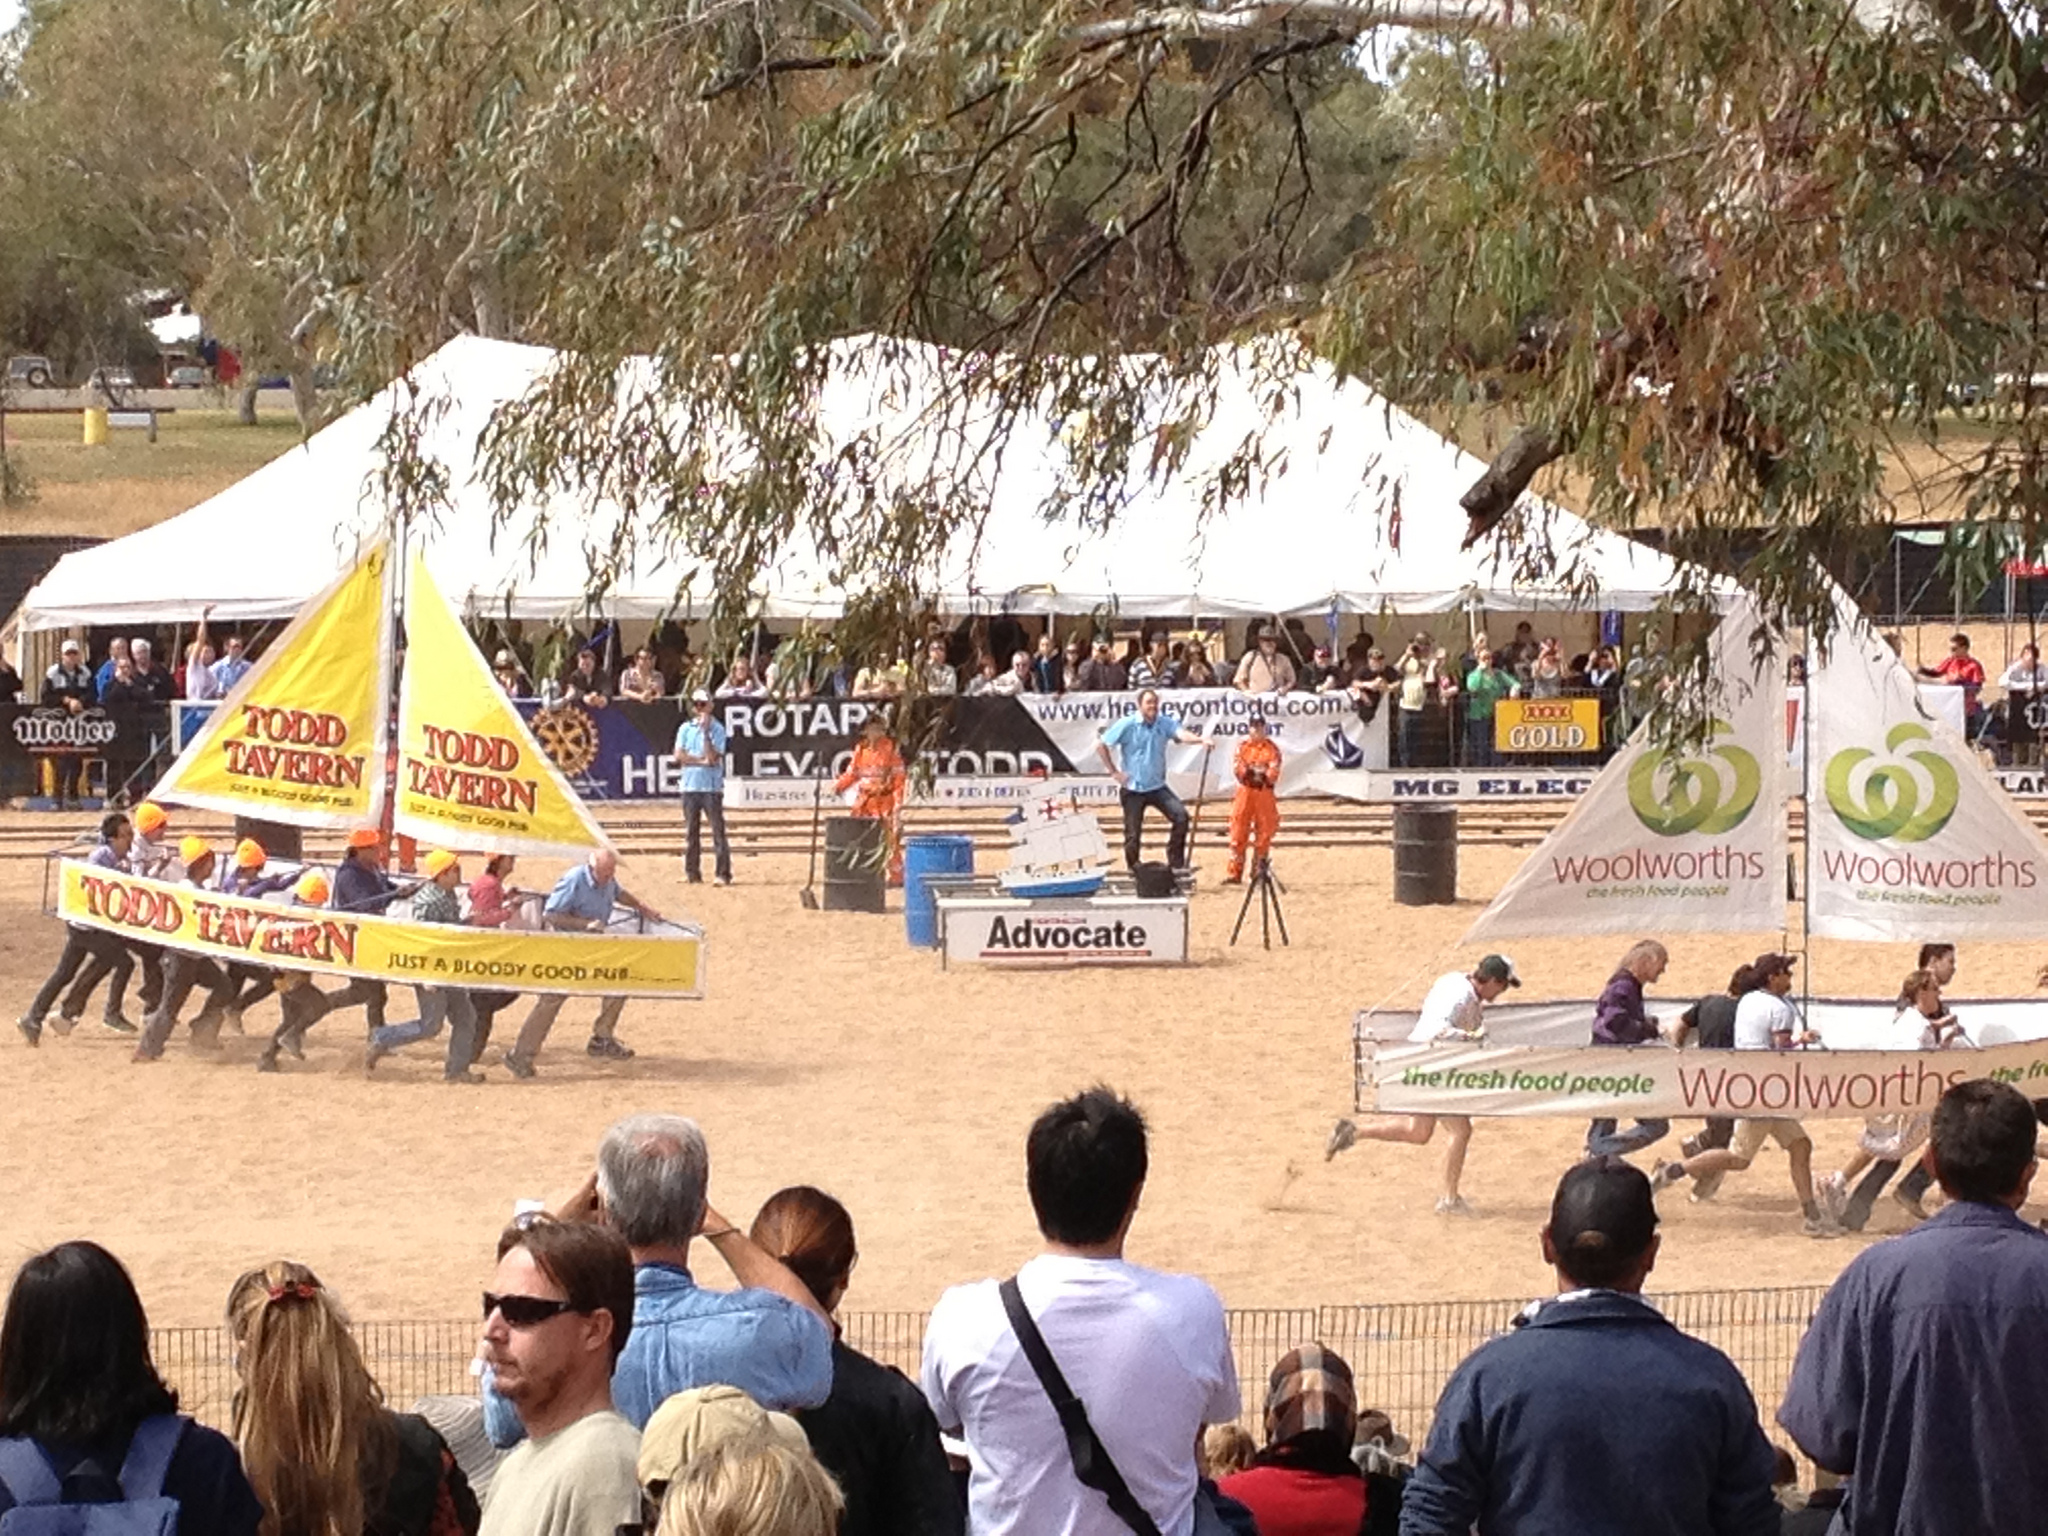
Australia-OutbackThe central banks are clueless and have no control over the economy. This whole thing reminds me of Australia. I loved going into the Outback, driving through rivers, and seeing ant hills that were taller than the Jeep. I was invited to go to the Todd River Regatta in the middle of the desert. I thought it was a joke. They said, “No mate! Come on!”

Armstrong Palm Valley Australia


I was perplexed at first. How can you have a regatta in the middle of a desert? Well, only Australia could figure that one out. They raced in pretend boats down an ancient river bed where no white man has ever seen water flow. It was good fun. I actually joined in on the camel races.

We have the same thing going on now in politics and finance — just living the dream. Negative interest rates punish savers, and bankrupt pensions are creating a collapse in socialism that threatens civil unrest on a grand scale. Then we have politicians raising taxes and creating mountains of regulations that nobody can figure out without a lawyer and an accountant. They are brain-dead and it is impossible for them to figure out why small businesses are not expanding to create jobs. Duh!

Tariffs – Labor – Consumer


Union Strike - r


QUESTION: If Donald trump issues a tariff on countries like china will that cause the price of goods from china to go up in price?? Also is he correct by saying it will bring jobs back to the united states by doing this? Would overall implementing a tariff a good thing or is it a bad thing.

ANSWER: It would not work and it would have a negative impact. Most people do not realize that China deals with Europe more than the U.S. does. For 2015, the U.S. sold 116,186.3 billion to China and bought 481,880.8 billion from China. People complain about sending jobs overseas, but no one ever talks about the fact that it reduces costs for consumers. To subsidize jobs, consumers need to pay higher prices. The better model is to improve one’s skills to rise in value for employment. It is a national’s comparative advantage. Yes, we have lost the low-level manual labor jobs to countries overseas that were not unionized or overvalued for the skill they presented. The key to advancing is to keep pace with changes. As a programmer, if you refused to learn new skills, you would be obsolete and only able to code in DOS, which is not even in any Windows platform. Who would hire you?

Added Note from Centinel2012: In principle Marty is correct but Trump is also correct as one must also consider the money flows and China is buying the US (Treasuries) with cheap goods; at some point they will own the federal government and we will then be as colony of China.

A Reader’s Comment on the Problems with Safe-Deposit Boxes


Safe Deposit Box

COMMENT:

I am an attorney in Texas. We have been advising clients NOT to use safe deposit boxes for years. Examples are:

We had a client involved in a multiparty suit. I got a court order and sent somebody over to a decedent’s safe deposit box with witnesses and a video camera. The bottom of the box was covered in diamonds. It was closed and locked. When the suit settled, an attorney for the lead clients didn’t think to repeat this process when an opposing party, the sole holder of a key and legal access to the box, turned over the key. This individual was an international jewelry company employee who retired early, the week of the settlement.

The box had no diamonds. Not one. The bank’s log book was missing pages for the relevant dates. The bank was immune from suit under federal law. The key holder walked after expensive litigation. Insufficient evidence. So you are largely out of luck, if your box turns up empty.

Then there was the S&L crisis. One closed branch had a security guard, by bankruptcy court order, who let people into their boxes 5 days a week. But the security alarm company had turned off the alarms. One Monday, the guard showed up and there was water trickling out of the vault door. Sprinklers had been running all weekend, filling the vault and the boxes. Again, the box holders were out of luck. Gold and jewels were fine, but legal documents, paintings, photos, watches, electronics, collectables made of paper or other water sensitive materials, etc. were damaged or destroyed. No recourse. I hope nobody had an original copy of the Declaration of Independence there.

In the 1930s, boxes were systematically drilled by government officials looking for illegal gold. No warrants, as we understand them. Countless claims of government agent looted boxes were ignored. How do you prove what was in it? Recall, we had a video of the contents of a box, and only one person could legally access it, and there was always a security guard to stop unlawful access and the lead litigants still lost.

Finally there is a splendid movie called the Bank Job. It portrays a true story about a bank in London which had its safe deposit vault breached. Really incredible, true story, but one takeaway was that hundreds of box holders refused to identify what had been stolen from their boxes, or reclaim their treasures that were recovered.

So the government suspicions about illegal storage of ill gotten gains are obviously often true. We tell our clients not to use storage controlled by government regulated financial institutions and instead to find private, secure, fireproof and waterproof means of storing things of value. This is probably the same story as the buried Roman coin stories. Every government becomes organized crime, eventually, if they didn’t start that way in the first place.

BTW, a fireproof safe is of little value if it has perishable items and fire suppression, or flood, or plumbing leak water gets into it. And a second safe with some valuables is useful for home invasion purposes. Faux jewelry, some cash, gold coins and convincing some copies of things like wills and insurance policies are good. If they hold a gun to your family’s head and demand that you open your safe, having an offsite second one is handy. BTW, the Russians are returning to typewriters without computers for their most sensitive operations. Stealing filing cabinets full of paper is much harder than filling a flash drive, as Snowden has demonstrated

Wayne Swan Rewrites History to Support Living Off of Other People’s Money


USA GDP 1960 - 2012

It is truly amazing how biased socialists are to the point that they just want to rob anyone who has more than they do and rewrite history to further their political agenda. Wayne Swan, former deputy prime minister of Australia, wrote a political piece for the Guardian that is total rubbish with the heading: “Cutting corporate tax won’t create jobs. It’s yesterday’s solution to our problems.” Swan boldly proclaims that the tax reductions of Reagan and Thatcher did nothing.

Here is the real economic growth of the USA since 1960. You will notice a sharp rally when Reagan cut the taxes. In fact, Reagan created more jobs and revenue by lowering taxes. The pretend “trickle-down economics” these people hate so much actually worked. Obama raised taxes, and he will go down in history for having the lowest economic growth rate of any American president.

Facts and evidence do not matter to socialists. They always support their ideas with fiction to justify robbing other people’s money

The Accountability Act


White House

A lot of people have asked what my platform would be if I ran for president. Aside from eliminating the income tax and imposing term limits upon Congress (one time and you are out), I would champion the Accountability Act.

The Inspector General’s report clearly shows Hillary should be charged under 18 U.S. Code § 2071, which states that the concealment, removal, or mutilation of government documents carries a three-year term of imprisonment and/or fine. Section B also states anyone found guilty “shall forfeit his office and be disqualified from holding any office under the United States.” This wording is very clear, but the executive claims “discretion” to charge whomever they desire. If it were Trump they would charge him, but Hillary gets a free walk.

I would create the Accountability Act where anyone who misleads or lies to government in any way forfeits all pensions and must leave all government jobs, even as a dog catcher.

I would spin off the Office of Inspector General from the executive branch and restore them as a Roman Tribune, which would mean they could prosecute anyone in government without president approval since that would include him.