The analysis and plots shown here are based on the following: first NASA-GISS temperature anomalies (converted to degrees Celsius so non-scientists will understand the plots) as shown in their table LOTI, second James E. Hansen’s Scenario B data, which is the very core of the IPCC Global Climate models (GCM’s) and which was based on a CO2 sensitivity value of 3.0O Celsius, lastly, a plot based on an alternative climate model designated ‘PCM’ based on a sensitively value of 0.65O Celsius.
Note: I am making a revision to my model based on some new information that will make my climate model more accurate; even with the NASA/NOAA data manipulation which is in full force now. I expect to have this work completed by the next post for January 2016 data. This change has been completed and this paper uses the new a revised model. This change was to link the developed patterns to multiples of Pi which did in fact make an improvement and reduced errors from NASA observations.
An explanation of the alternative model designated, PCM, is in order since many have interpreted this PCM model as a statistical least squares projection of some kind. Nothing could be further from the truth. A decade ago when I started this work the first thing I did was look at geological temperature changes since it is well known that the climate is not a constant; I learned that in my undergrad geology and climatology courses in 1964.
The following observations give a starting point to any serious study. First, there is a clear movement in global temperatures with a 1,000 some year cycle going back at least 3,000 to 4,000 years; probably because of the apsidal precession of about 21,000 years for a complete cycle. However about every 10,000 years the seasons are reversed making the winter colder and the summer warmer in the northern hemisphere. 10,000 years from now the seasons will be reversed. Secondly, there are also 60 to 70 year cycles in the Pacific and the Atlantic oceans that are well documented. Lastly we also know that there are greenhouse gases such as carbon dioxide. The National Academy of Sciences (NAS) estimated that carbon dioxide had a doubling rate of 3.0O Celsius plus or minus 1.5O Celsius in 1979.
The core problem with the current climate change theory is that the IPCC still uses the NAS 3.0O Celsius as the sensitivity value of carbon dioxide and a number in that range is required to make the IPCC GCM’s work. The problem with using this value is it leaves no room for other factors and hence the need of the infamous hockey stick plots of the IPCC from Mann, Bradley & Hughes in 1999. The PCM model is based on a much lower value for carbon dioxide consistent with current research that places the value between 0.65O and 1.5O Celsius per doubling of carbon dioxide. If the long and short movement in temperatures and a lower value for carbon dioxide are properly analyzed and combined a plot that matched historical and current (non manipulated) NASA temperature estimates very well can be constructed. This is not curve fitting.
The PCM model is such a construct and it is not based on statistical analyses of raw data. It is based on creating curves that match observations (which is real science) and those observations appear to be related to the movement of water in the world’s oceans. The movements of ocean currents are well documented in the literature. All that was done here was properly combine the separate variables into one curve which had not been previously done, to my knowledge. Since this combined curve is an excellent predictor of global temperatures unlike the IPCC GCM’s, it appears to reflect reality a bit better than the convoluted IPCC GCM’s, which after the past 19 years of no statistical warming have been shown to be in error.
Now, to smooth out highly erratic monthly variations a 12 month running average is used in all the plots. This information will be shown in four tables and updated each month as the new data comes in about the middle of the month. Since no model or simulation that cannot reasonably predict that which it was design to do is worth anything the information presented here definitively proves that NASA, NOAA and the IPCC just don’t have a clue.
Note, starting in late 20014 and continuing to the present NASA has made major changes to the way they calculate the values used in their table LOTI. These changes have significantly increased the apparent global temperatures (political reasons) and these changes are not supported by satellite data; so they are probably not real. For example in the report issued in April 2010 the following temperatures were reported March 2002 102, January 2007 108. The January 2016 report shows March 2002 90, January 2007 95 and January 2016 as 111 but was it and will it say there? This paper uses the questionable NASA data since it is all that is available at this time. Prior to this “change” the PCM plot showed almost no error for NASA data as can be seen in the plots posted here last year.
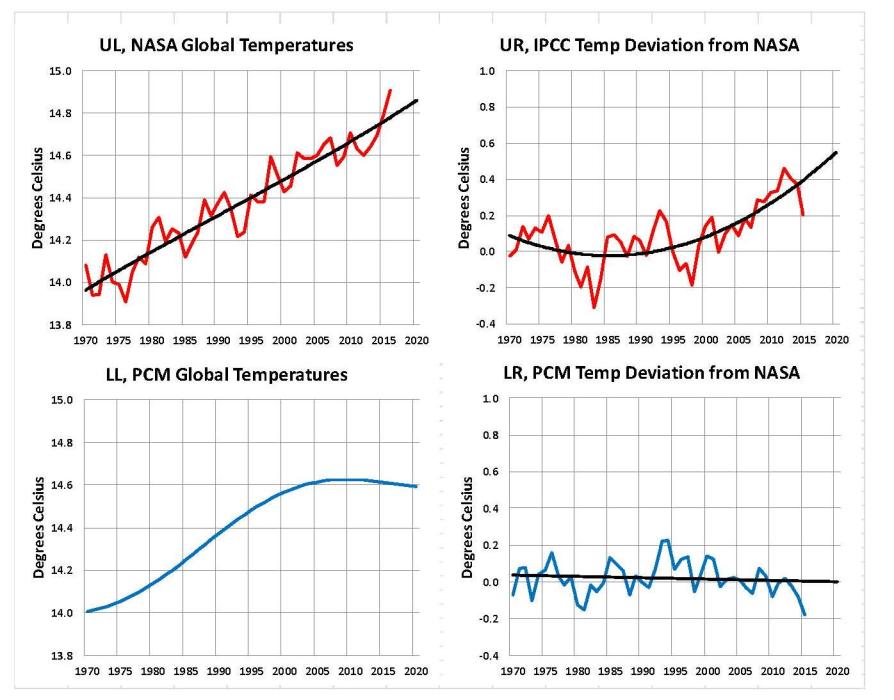
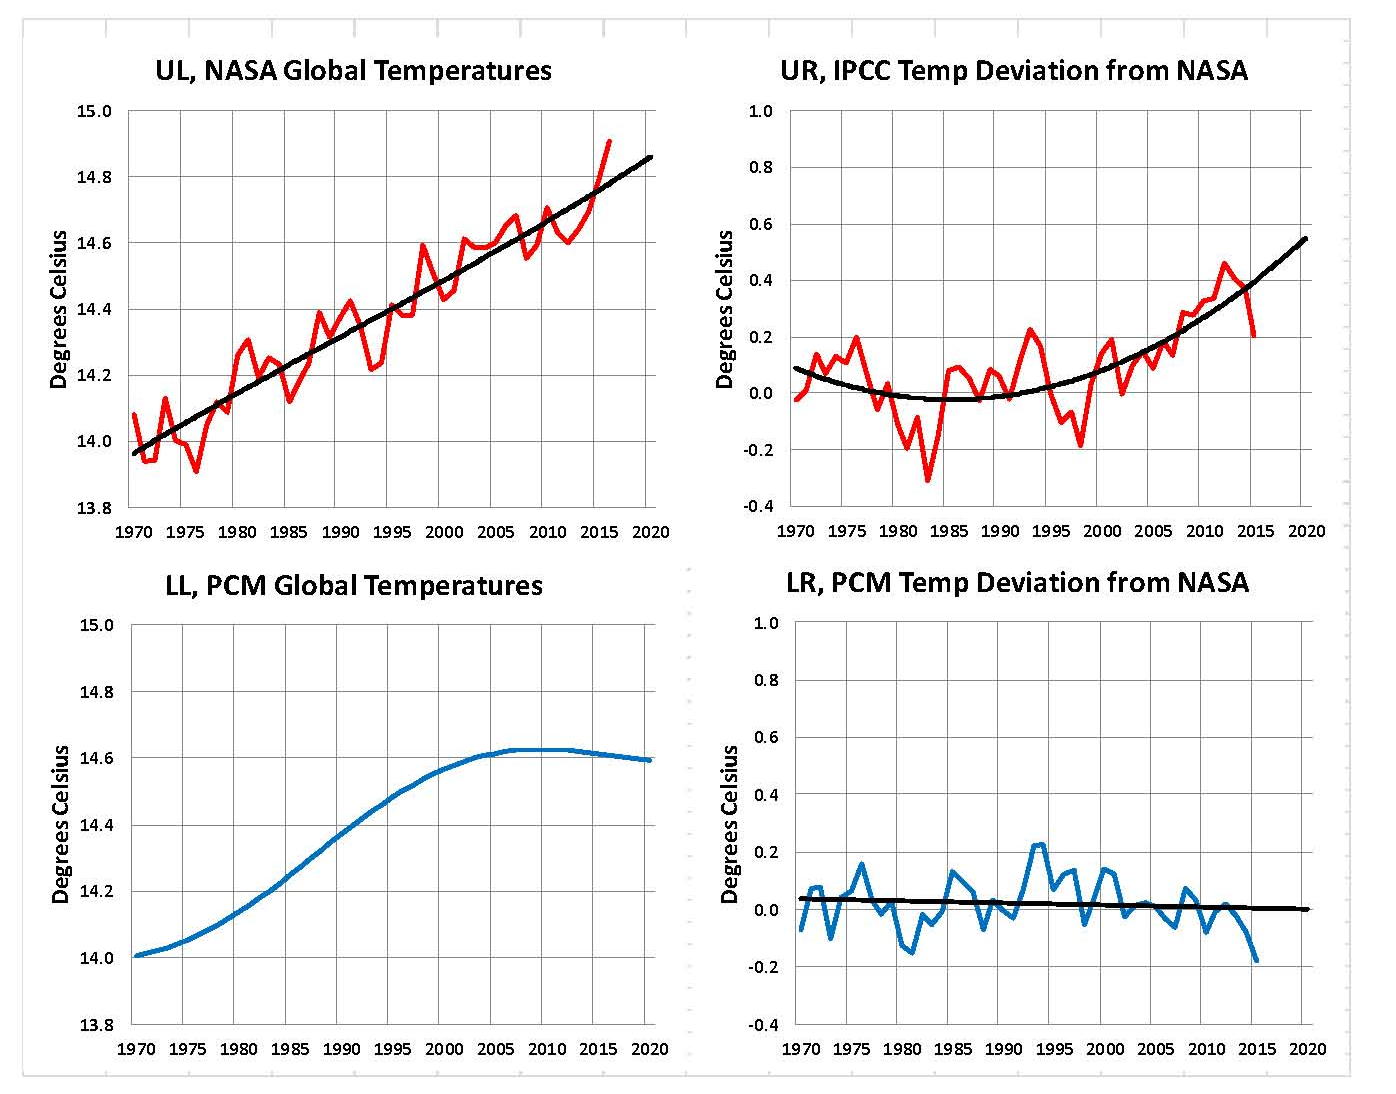
The first plot, UL is a plot of the NASA temperature anomaly converted to degrees Celsius and shown in red with a black trend line added. There has been a very clear reversal in the upward movement of global temperatures since about 2001 and neither the UN IPCC nor anyone else has an explanation for this 13 years later. Since CO2 has continued to increase at what could be argued an increasing rate, this raises serious doubts about the logic programmed into all the IPCC global climate models.
The next plot UR, also in red, shows the IPCC estimates of what the Global temperature should be, based on Hansen’s Scenario B, with the NASA actual temperatures’ subtracted from them. Therefore this plot represents a deviation from what the Climate “believers” KNOW what the temperature should be; with a positive value indicating the IPCC values are higher than actual and a negative value indicating the IPCC values are lower than actual, as measured by NASA. A black trend line is added and we can clearly see that the deviation from expected is increasing at an increasing rate. This makes sense since the IPCC models project increased temperatures based primarily on the increasing level of CO2 in the earth’s atmosphere. Unfortunately, for them, the actual temperatures from NASA are trending down (even as they try to hide the down ward movement with data manipulation) since other factors are in play, therefore each year the gap between them widens. Since we have 13 years of observations’ showing this pattern it becomes hard to justify a continuing belief in the IPCC climate models, there is obviously something very wrong here.
The next plot LL shown in blue is based on the equations in the PCM climate model described in previous papers and posts here and since it is generated by “equations” a trend line is not needed. As can be seen the PCM, LL, there is a 69.1 year cycle that moves the trend line up and then down a total of 0.29O Celsius and we are now in the downward portion of that trend (-.01491O C per year) which will continue until around 2035. This short cycle is clearly observed in the raw NASA data in the LOTI table going back to 1868. Then there is a long trend, 1036.7 years with an up and down of 1.65O Celsius (.00396O C per year) also observed in the NASA data. Lastly, there is CO2 adding about .007O Celsius per year so they basically wash out at -.0039 O C per year, which matches the current holding pattern we are experiencing. After about 2035 the short cycle will have bottomed and turn up and all three will be on the upswing again. These are all round numbers shown here as representative values.
The last plot LR in blue uses the same logic as used in the UR plot, here we use the PCM estimates of what the Global temperature should be with the NASA actual temperatures’ subtracted from them. A positive value indicates the PCM values are higher than actual and a negative value indicates the PCM values are lower than expected. A black trend line was added and it clearly shows that the PCM model is tracking the NASA actual values very closely. In, fact since 1970 the PCM model has rarely been off by more than +/- 0.1 degrees Celsius until the last few months where the manipulation showed up and has an average trend of almost zero error, while the IPCC models are erratic and are were approaching an error rate of over +0.4O C above expected until the last few months.
Note: Since I first started posting this monthly analysis a year and a half ago NOAA and NASA were directed make the global temperatures fit the political narrative that the planet was over heating and something drastic need to be done right now. The problem was as shown in this analysis the “real” world temperatures were not at the level that the IPCC GCM’s said they should be. Major adjustments to the data have been made that give the illusion that temperatures are going up even though they are not. However, as this analysis shows even with the manipulation that has destroyed all credibility from NOAA and NASA they cannot get the global temperatures even close to what their false theory claims they should be.
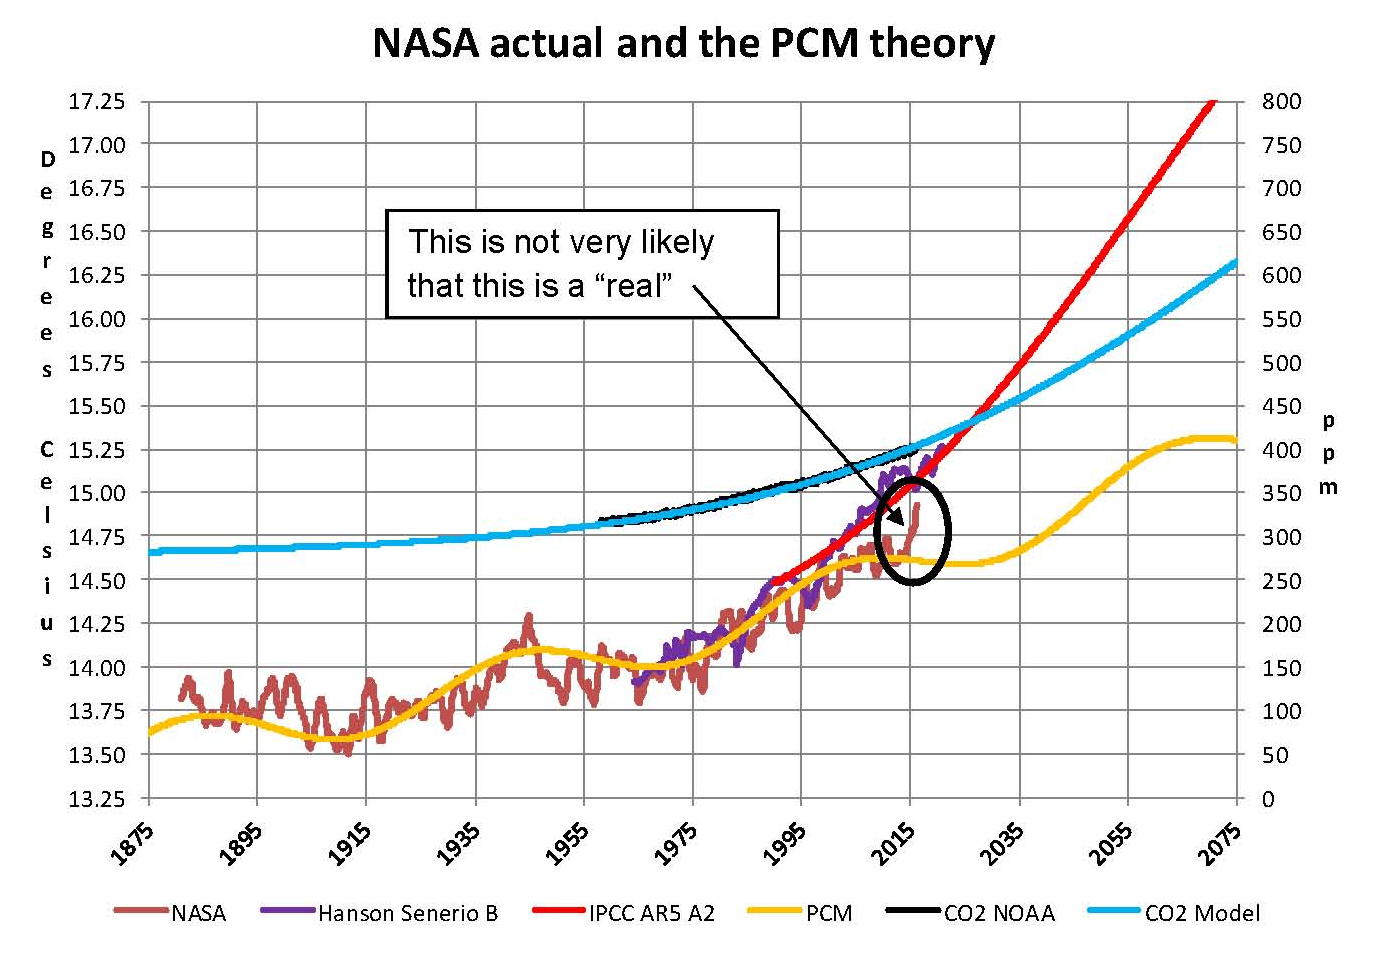
The next Chart shows the PCM model and all the various government plots related to climate change from 1875 through 2075. Clearly within the next dozen years we will know one way or the other which kind of climate model works. One based on observations and the other based on questionable science. There is no disrespect meant against the real climate scientists that have been marginalized this disrespect is meant for the political scientists who are the worst kind as they work for money not for the truth. Unfortunately, over the past year NASA has been directed by the current administration to make the global temperature match what the IPCC climate models predict it should be; therefore we see the very odd plot in the oval in the following Chart.
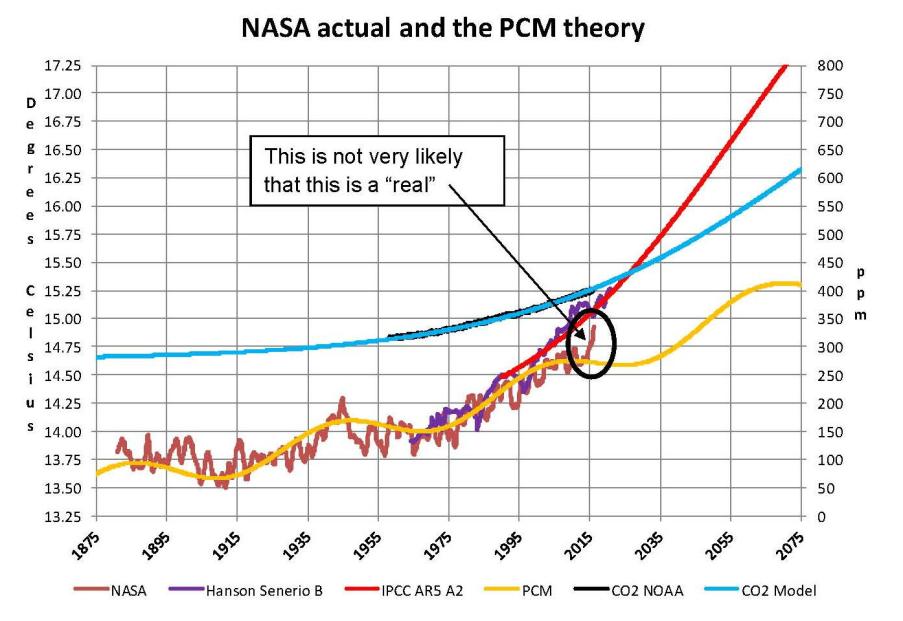
In summary, the IPCC models were designed before a true picture of the world’s climate was understood. During the 1980’s and 1990’s CO2 levels were going up and the world temperature was also going up so there appeared to be correlation and causation. The mistake that was made was looking at only a ~20 year period when the real variations in climate move in much longer cycles. Those other cycles can be observed in the NASA data but they were ignored for some reason. By ignoring those trends and focusing only on CO2 the models will be unable to correctly plot global temperatures until they are fixed.
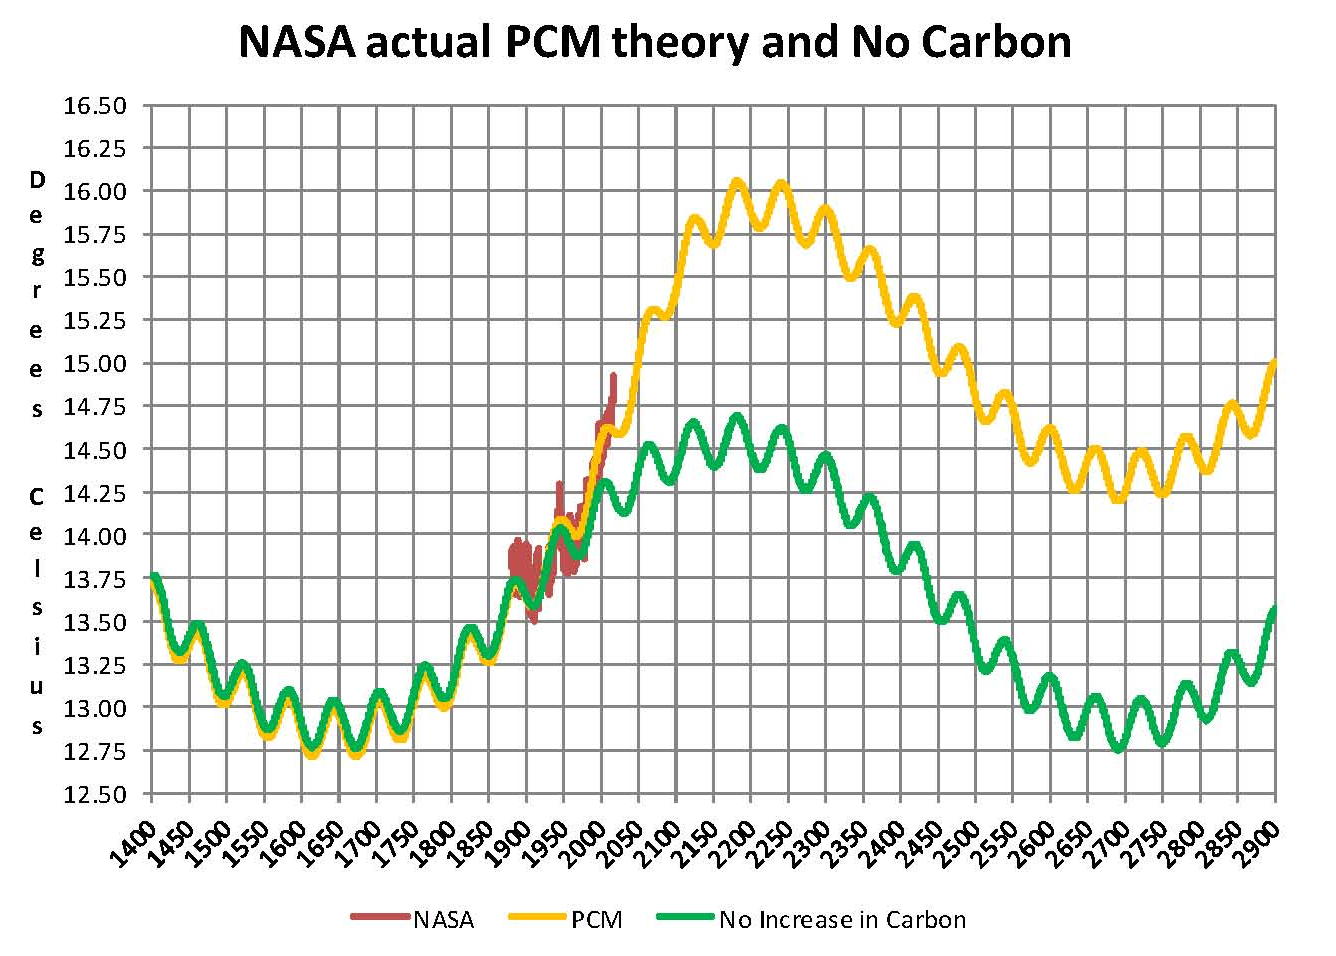
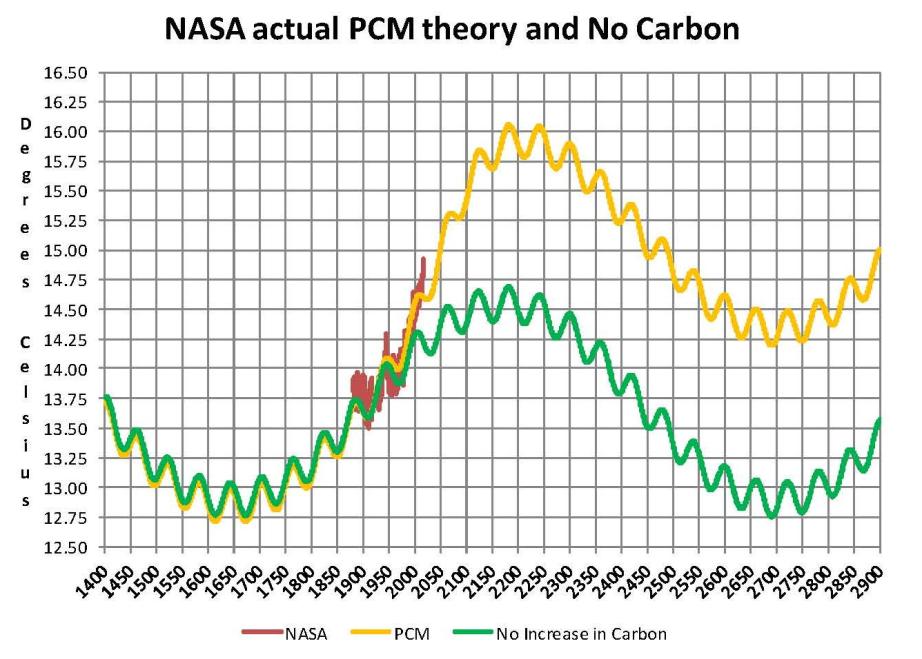
Lastly, the next chart shows what a plot of the PCM model, in yellow, would look like from the year 1400 to the year 2900. The plot matches reasonably well with history and fits the current NASA-GISS table LOTI data, in red, very closely, despite homogenization. I understand that this model is not based on physics but it is also not curve fitting. It’s based on observed reoccurring patterns in the climate. These patterns can be modeled and when they are, you get a plot that works better than any of the IPCC’s GCM’s. If the conditions that create these patterns do not change and CO2 continues to increase to 800 ppm or even 1000 ppm than this model will work into the foreseeable future. 150 years from now global temperatures will peak at around 15.75 to 16.00 degrees C and then will be on the downside of the long cycle for the next 500 years. The overall effect of CO2 reaching levels of 1000 ppm or even higher will be about 1.5 degrees C which is about the same as that of the long cycle. The Green plot shows the pattern with no change in CO2 from the pre-industrial era of ~280 ppm.
Carbon Dioxide is not capable of doing what Hansen and Gore claim!
The purpose of this post is to make people aware of the errors inherent in the IPCC models so that they can be corrected.
The Obama administration’s “need” for a binding UN climate treaty with mandated CO2 reductions in Europe and America was achieved as predicted at the COP12 conference in Paris in December 2015. To support this endeavor NASA was forced to show ever increasing global temperatures that will make less and less sense based on observations and satellite data which will all be dismissed or ignored. Within a few years the manipulation will be obvious even to those without knowledge in the subject.
Sir Karl Raimund Popper (28 July 1902 – 17 September 1994) was an Austrian and British philosopher and a professor at the London School of Economics. He is considered one of the most influential philosophers for science of the 20th century, and he also wrote extensively on social and political philosophy. The following quotes of his apply to this subject.
If we are uncritical we shall always find what we want: we shall look for, and find, confirmations, and we shall look away from, and not see, whatever might be dangerous to our pet theories.
Whenever a theory appears to you as the only possible one, take this as a sign that you have neither understood the theory nor the problem which it was intended to solve.
… (S)cience is one of the very few human activities — perhaps the only one — in which errors are systematically criticized and fairly often, in time, corrected.

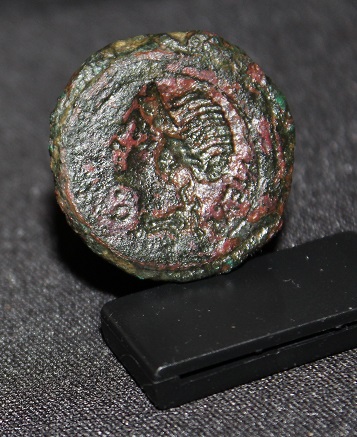
 It might surprise many, nonetheless, governments have routinely spent more than they take in from taxes. In ancient times, governments simply minted more coins to fund their operations, they did not generally borrow. Some Greeks borrowed from the temples to fund wars and did default. However, typically, tax revenues amounted to only about 80% of expenditure. Records have survived as well as dies from which coins were struck. Pictured here, you will see an actual Roman die from the Republican period which has survived. Each die was hand carved so we can distinguish between dies and as such, the fact that the average number of coins produced before a die breaks is about 15,000. Here is a coin struck from this issue that this die represents. Since we can catalogue the number of known dies, we then can reasonably estimate the annual production of money in the Roman Republic as well as the Imperial era.
 The above chart demonstrates the annual production of coinage during the Roman Republic 155-66BC. We can differentiate periods of contraction (deflation) from inflation. We can see that some periods were clearly deflationary and there emerged a shortage of money at times. The Roman Emperor Tiberius, who followed Augustus in 14AD, was notoriously frugal. We find private coinage appearing as tokens to make up the difference for such periods of deflation.
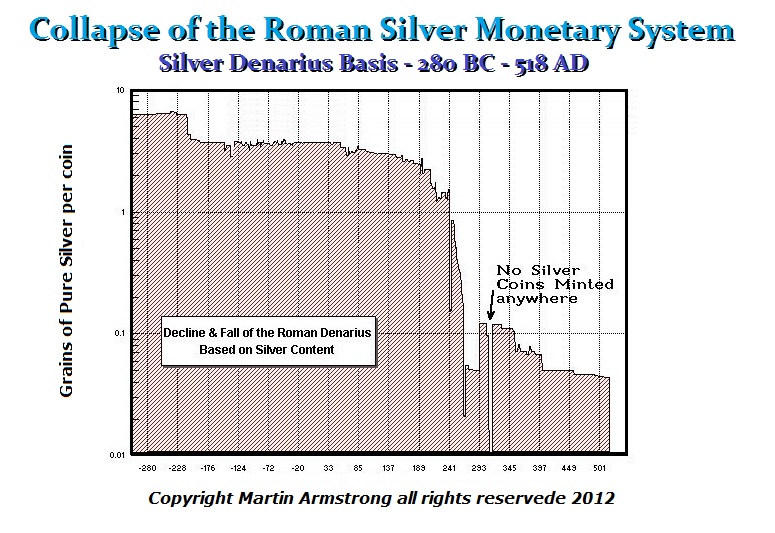 If we then can ascertain the annual production of coinage with a reasonable degree of accuracy, adding up those annual production figures will give us a look at the total money supply. We are then able the also reasonably ascertain that the Roman government collected only about 80% of its total expenditure from taxes. The rest was not borrowed, but simply produced.


 ANSWER: Unfortunately, the two go hand-in-hand. George Orwell simply too the past and laid out what government ALWAYS gravitates toward – total control. We live in a delusion with our brains filled with propaganda. Over the years, I have encountered comments from people who ask why would you want to live outside the USA? We are the greatest nation on earth! I typically reply, have you ever traveled outside the country? The response is telling: No. What’s the point? Perhaps I am the doubting Thomas. I went through Check-Point Charlie into East Germany before the Wall Fell because I really wanted to see what was true and what was false. You cannot just accept the indoctrination of society and it is systemic.