Inverted Yield Curve


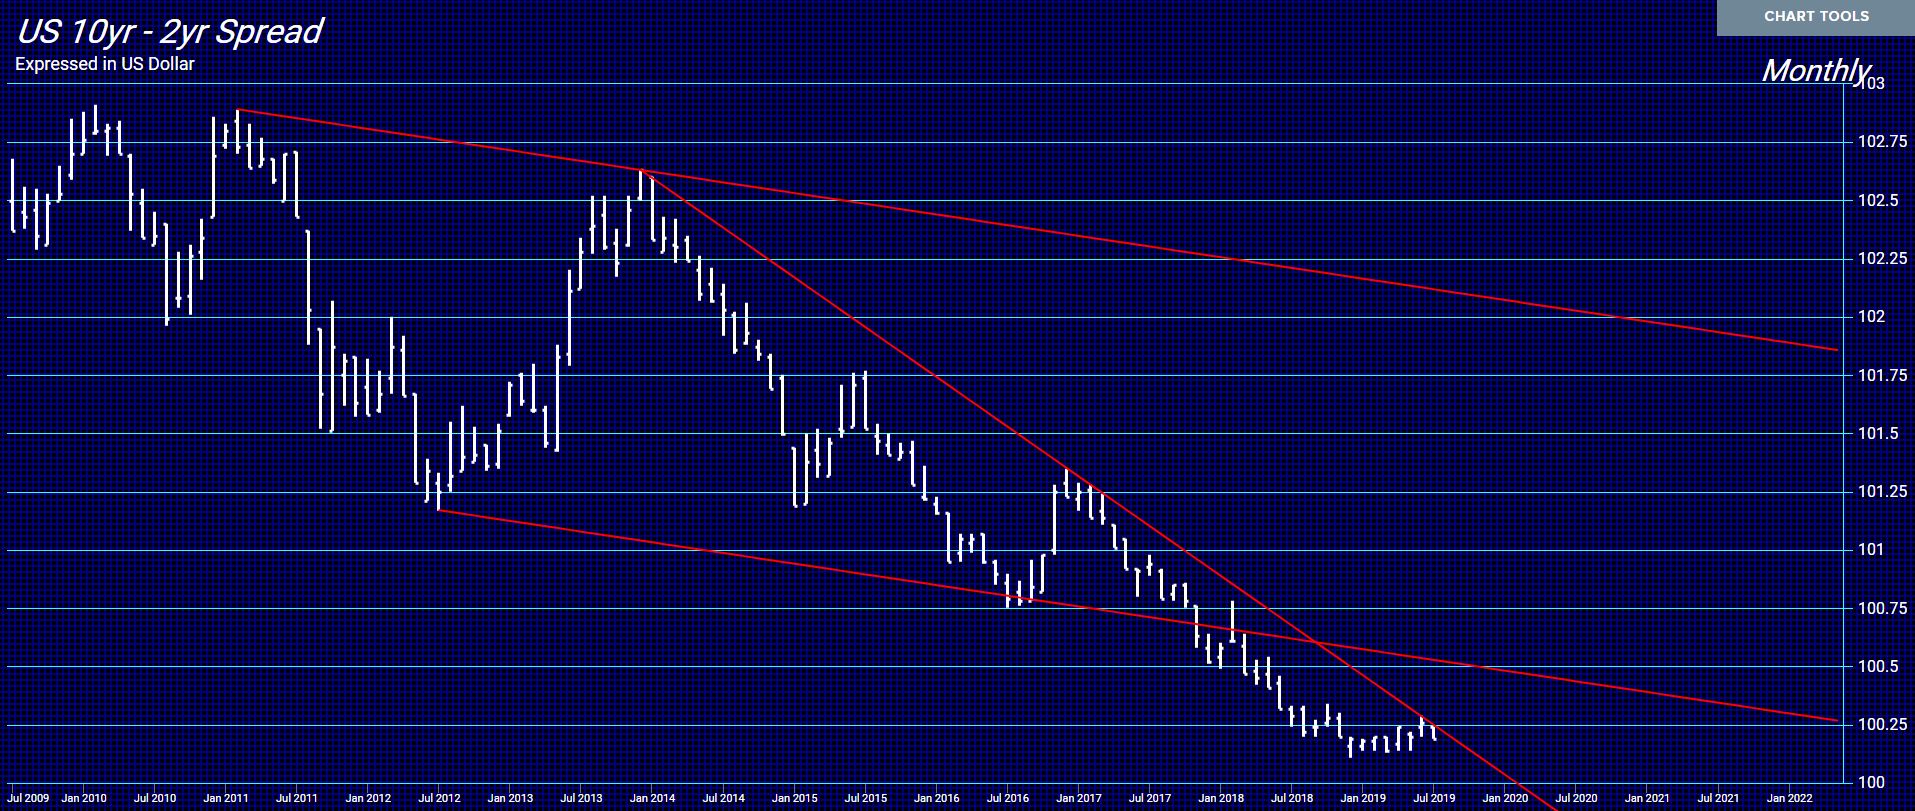
The yield curve has been inverted for the last month. An inverted yield curve occurs when long-term government debt yields fall below rates on short-term notes and bills. For stock market investors, an inverted yield curve is typically a sign that equities could peak before an economic recession will follow. It also can be a precursor to a bear market in stocks, where equities fall 20% or more from highs which is the typical forecast. Some have pointed to the escalating China trade war. Investors, the claim, are worried that the China trade war and U.S. tariffs will slow global economic growth.

The 10-year Treasury note yield fell to 2.24% in early trading on May 29. Yields on three-month Treasury bills rose to 2.35%, well above the 10-year rate. The 10-year Treasury note fell below 2% on June 25 following the release of weaker-than-expected consumer confidence data. The three-month note traded at 2.13.%. Ten-year rates stood at 2.69% at the start of 2019. On June 4, 10-year Treasury notes slipped to 2.1 in midday trading, its lowest level in 20 months.

But much the real trend driving the inverted yield curve is capital inflows seeking long-term yields. Much of the capital has moved in from Europe. In addition, the amount of money in fixed-income exchange-traded funds passed $1 trillion last month, an ascendance that has reshaped the market in which countries and companies raise money to pay their bills. This has also altered the yield-curve. These forces have changed the dynamics of the marketplace and the traditional inverted yield curve does not necessarily mean what it once did and more than central banks use to be in control of the economy or money supply.

When Bonds Become Money


QUESTION: You said the “crash is in the debt markets”. Can you please explain how that will evolve?
Liz M.

ANSWER: Once upon a time before 1971, there used to be a difference between debt and cash. Government bonds were not acceptable for collateral. You could not borrow against them. You had to liquidate them. This is why they once believed that it was LESS INFLATIONARY to borrow than print. Today, you can buy TBills and post them as collateral to trade futures contracts.

When paper money was beginning during the American Civil War, the government issued compound interest currency. In reality, this was merely currency that paid interest. Therefore, they were a hybrid where they were actually bonds that circulated as if they were a currency. We have returned to that whereby TBills are a street name and are good collateral so they have become the equivalent of bearer bonds that merely serve the purpose of currency.

Hong Kong Peg & Riots


Civil unrest is continuing to rise in Hong Kong after crowds of mask and helmet wearing demonstrators fled the area to escape hundreds of riot police firing tear gas. The entire issue has arisen from Lam’s government pushing legislation that would allow extraditions to China, a move that alarmed locals and multinational companies. The clashes have embarrassed the government in Beijing. The demonstrations came on the anniversary of the former British colony’s return to Chinese rule.

In 1863, the Hong Kong Government declared the silver dollar (a form of international currency issued by many nations) to be the legal tender for Hong Kong. In 1866, the government began issuing a Hong Kong version of the silver dollar. The silver standard became the basis of Hong Kong’s monetary system until 1935, when during a world silver crisis, the government announced that the Hong Kong dollar would be taken off the silver standard and linked to the pound sterling at the rate of HK$16 to the pound.

In 1972, the Hong Kong dollar was pegged to the U.S.dollar at a rate of HK$5.65 = US$1. Between 1974 and 1983, the Hong Kong dollar floated. On October 17, 1983, the currency was pegged at a rate of HK$7.8 = US$1 through the currency board system.

The problem Hong Kong will face is as the financial crisis in Europe erupts it will push the Greenback higher. If Hong Kong keeps desperately trying to hold the peg, they will import DEFLATION and turn their economy down very hard all because of international events. The models we showed at the Singapore Conference targeted 2019 for an important turning point.

The Hong Kong dollar peg climbed as much as 0.19% to 7.7987 a dollar on Tuesday, crossing the 7.8 threshold. Local interbank rates remain near a decade high, outstripping the income a trader can expect on U.S. dollars. That’s undermining a carry trade — sell Hong Kong dollars, buy greenbacks — that had been profitable for years.

The tight liquidity is coinciding with dramatic street protests. There has been a surge in borrowing costs suddenly. Companies are hoarding cash.

Were Traders Forged in the Pits of Old?


QUESTION: Mr Armstrong, love your blog, as with all your readers its opened my eyes to new ideas and ways of looking at the world.
I’m a recent computer science graduate who’s very interested in finance and trading so I read your blog every day and have a subscription to Socrates. I read a post where you said the soul of traders was forged in the pits, how does a new kid like me go about learning to trade really well in the age of tech? How does a computer science guy like me advance in the direction of finance and computer science like you have?
JB

ANSWER: I was told I had the last TransLux ticker-tape in the country. They came to my office and said they were taking it out. They would no longer support that service. Yes, I used to do my charts by hand in the 1970s. When the screen appeared in the ’80s, I still kept my paper tape. I would learn to trade from the sound. If something would be happening, it would sound like a machine-gun constantly shooting. Quiet days it would tick, tick, pause, tick.

I believe it was the sound that helped me learn to trade. I would just get a “feeling” or sixth-sense so to speak. You could smell the blood on the floor by the tape.

Trading in the pits was like playing poker. You had to read the faces around you and get a sense if they were bluffing or real. That was the real trader environment. You had to know when to press and when to fold.

I have some ideas to help with getting that sixth-sense. It is on my bucket list of things to accomplish. I am trying to pass on what I have learned before it is my time to pray to beam up, please.

With pit trading closing and moving to electronic, we are losing a lot. I fear the next crisis for there will be even less liquidity with people only looking at screens. It will lack the “feeling” and the smell of blood on the floor to know when the trend will shift.

German Real Estate – the Peripheral Market Rally


QUESTION: During the WEC I came to understand Real Estate will crash. Then when looking at Socrates, it shows real estate indices, however I do not recognise these trends. First I thought they were in $, I need to translate them to euro base to recognise the trend. But no, the real estate indices in Socrates are in terms of euro already and going down, while currently prices are again going thru the roof. Can you please explain what I am missing here?

M

ANSWER: It all depends upon which market you are looking at. The core markets where there was a lot of speculation like Britain saw a peak in 2015 and has been declining. London is far worse. The German market was not the object of massive foreign capital inflows. They were primarily internal shifts within the Eurozone. I was in Bavaria recently and looked at houses and I thought they were cheap in comparison to the United States.

Nevertheless, the rise in the German market has been about 50% since 2015. When we look at it in dollars, the gain is about 10% less. Insofar as German real estate, it has been a peripheral market to the speculation. That means it will rise after others decline.

Keep in mind that as the currency weakens, tangible assets become the haven.