Posted originally on the conservative tree house on September 14, 2022 | Sundance
Someone had requested a simple to see infographic of the Bureau of Labor and Statistics August inflation data with monthly and yearly outcomes. I thought everyone might find this graphic as a good tool for sharing with your network. [Data Source Link]
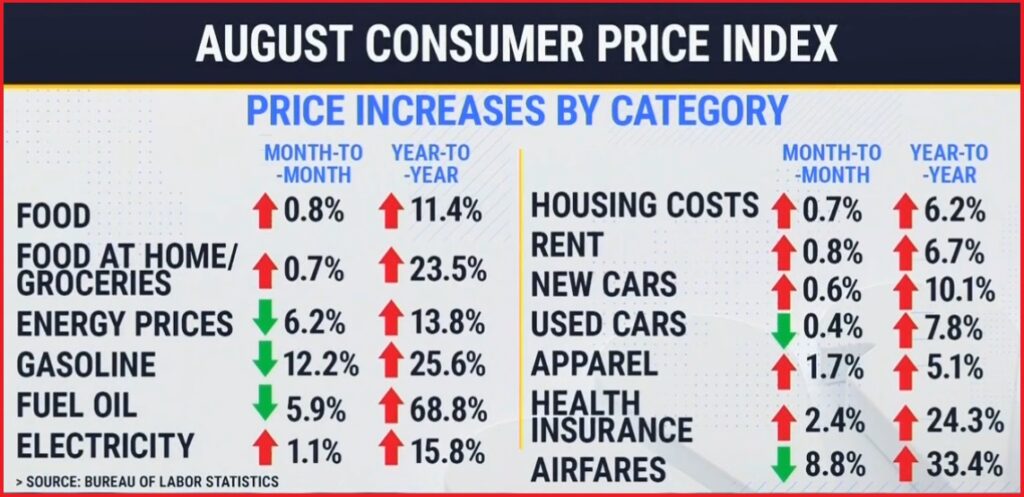
Additionally, the BLS also released the producer price index today [DATA HERE]. The PPI for goods dropped slightly, as we expected, due to the August temporary decline in gasoline and diesel. However, the PPI for final demand services moved up 0.4 percent in August, the fourth consecutive rise.
We are now seeing service providers having to raise their prices to cover their increased costs. This could be trouble for employment in the long-term.