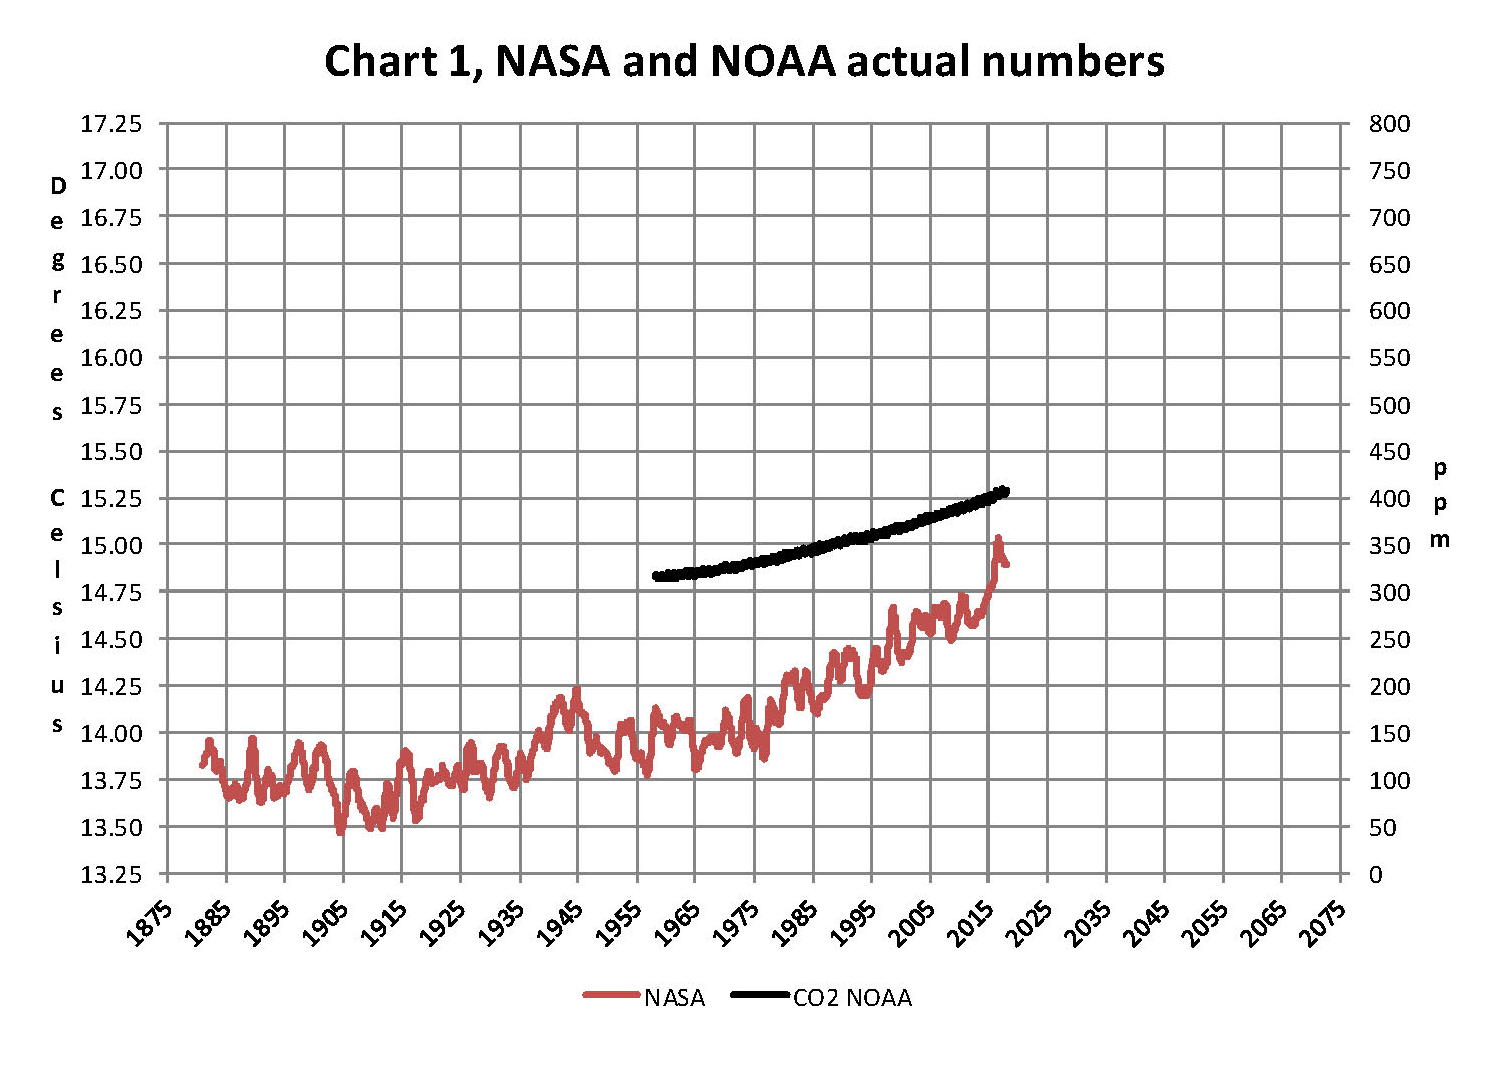
The analysis and plots shown here are based on the following two data series. First NASA-GISS estimates of a global temperature shown as an anomaly (converted to degrees Celsius) as shown in their table Land Ocean Temperature Index (LOTI) and shown in Chart 1 as the red plot labeled NASA the scale for the temperatures is on the left. The NASA LOTI temperatures are shown as a 12 month moving average because of the large monthly variation. Second NOAA-ESRL Carbon Dioxide (CO2) values in Parts Per Million (PPM) which are shown in Chart 1 as a black plot labeled NOAA the scale for CO2 is shown on the right.
NASA published data as stated in the first paragraph is shown as an anomaly, but what is a temperature anomaly? An anomaly is a deviation from some base value normally an average that is fixed. There were two problems with the system that NASA picked which were number one there is no “actual” global temperature and two since climate is a variable there cannot be a real base to measure from. NASA known for its science and engineering expertise back in the day thought it could get around these issues and created a system to do so. First they developed a computer model which took readings from all over the planet and made required adjustments to them which they called homogenization and came up with the estimated global temperature. Second they picked the period 1950 to 1980 (30 years) and averaged the values found in that period and came up with 14.00 degrees Celsius and make that their base. Then they took the calculated monthly temperature and subtracted the base from it which gave them the anomaly. The problem is that both are arbitrary.
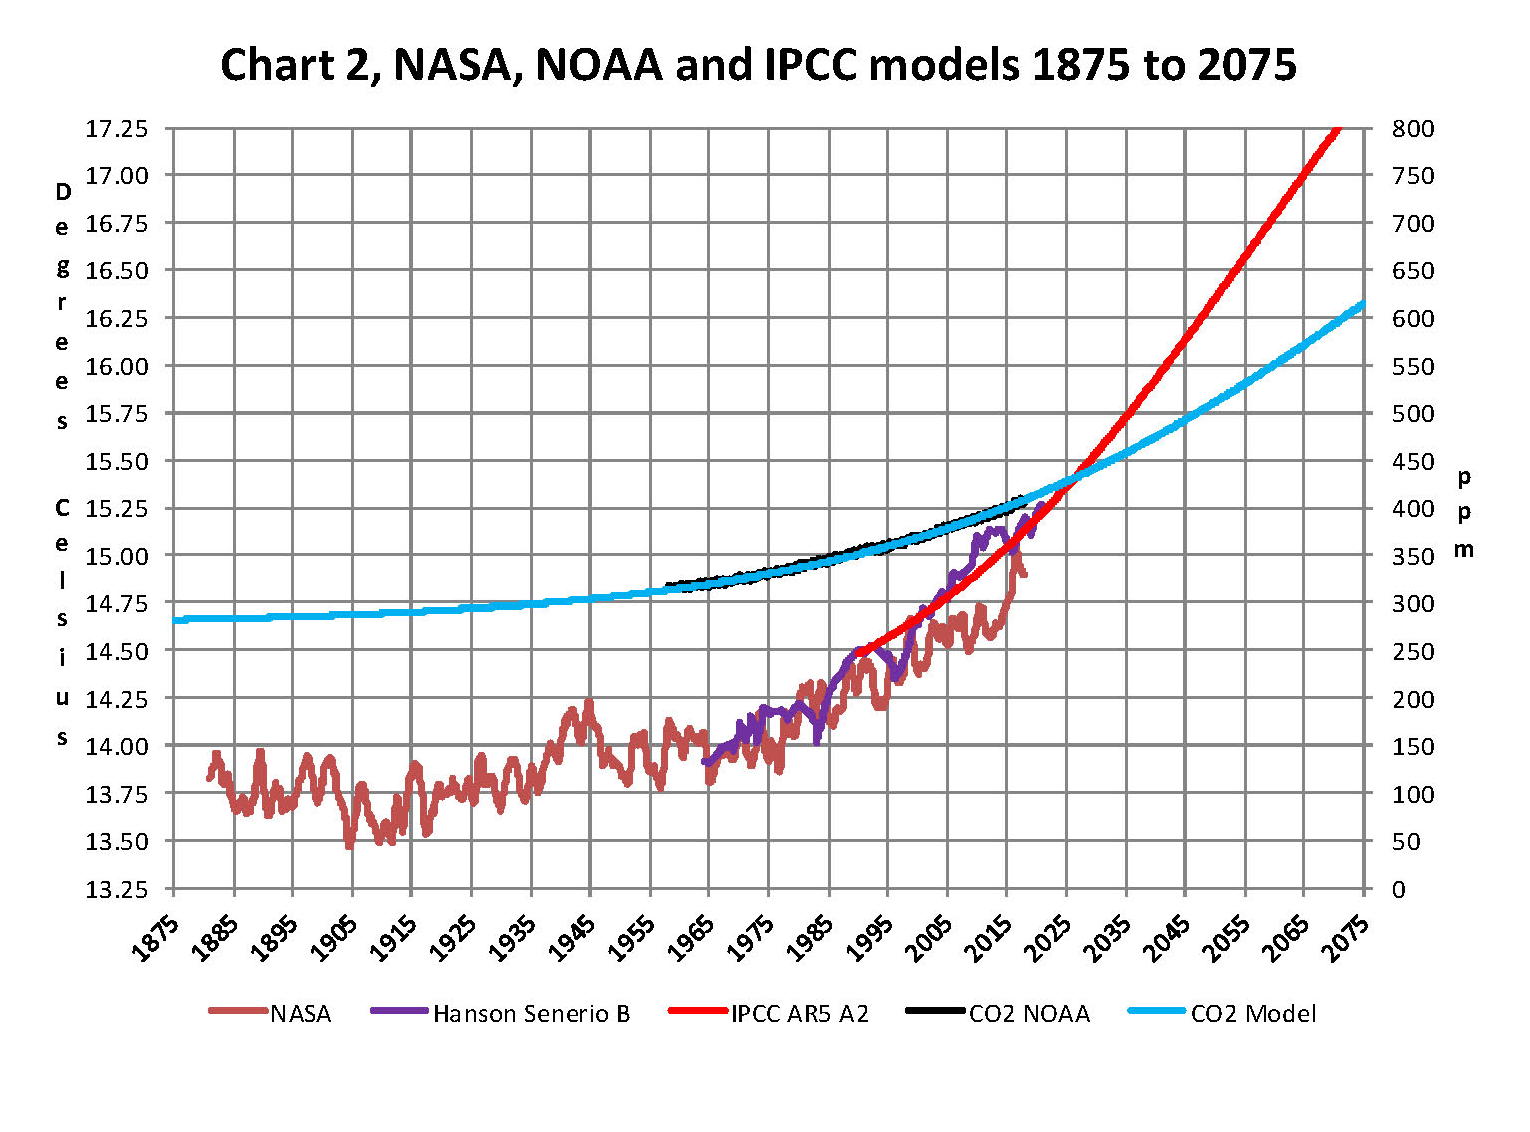
Now that we have a base to work with we are going to add to Chart 1 three things. The first is a trend line of the growth in CO2 since that is according to the government through NASA and NOAA the entire basis for climate change. That plot is superimposed over the black plot of the actual NOAA CO2 values as the cyan line labeled as the CO2 Model and one can see there is a very good fit to the actual NOAA values so there should be no dispute about its validity, and its historically accurate. This plot allows us to make projections to future global temperatures according to the projected level of CO2 . The second added item is James E. Hansen’s Scenario B data, which is the very core of the IPCC Global Climate models (GCM’s) and which was based on a CO2 sensitivity value of 3.0O Celsius per doubling of CO2. This plot is shown here in lavender and is part of a presentation that Hansen showed to congress in 1988 when the UN was about to set up the International Panel on Climate Change (IPCC) and this plot is labeled as Hansen Scenario B which Hansen stated was the most likely to happen based on his 1979 climate theories’. The third item is the current plot of the most likely temperature of the planet based on the growth of CO2 published by the IPCC. This plot is shown in Red and is labeled as IPCC AR5 A2 as that is the table where the data was found. This plot is a GCM computer projection of the planets temperature based on the complex relationships developed on the levels of CO2 by the IPCC primarily though NASS and NOAA.
It can be seen in Chart 2 that the lavender plot and the Hansen plot are very close from 1965 to around 2000 after that, from 2000 to 2014, there is a very large and deviation reaching close to .5 degrees Celsius in 2015, which is not an insubstantial number. Also of note is that there doesn’t seem to be a good correlation between the growth in CO2 and the increase in the planets temperature. The CO2 is going up in a log function and the Temperature was going down until 2015 and then there was a mysterious spike up. That unexplained change in temperature direction appeared to have occurred between 2013 and 2014 and is the subject of this monthly paper.
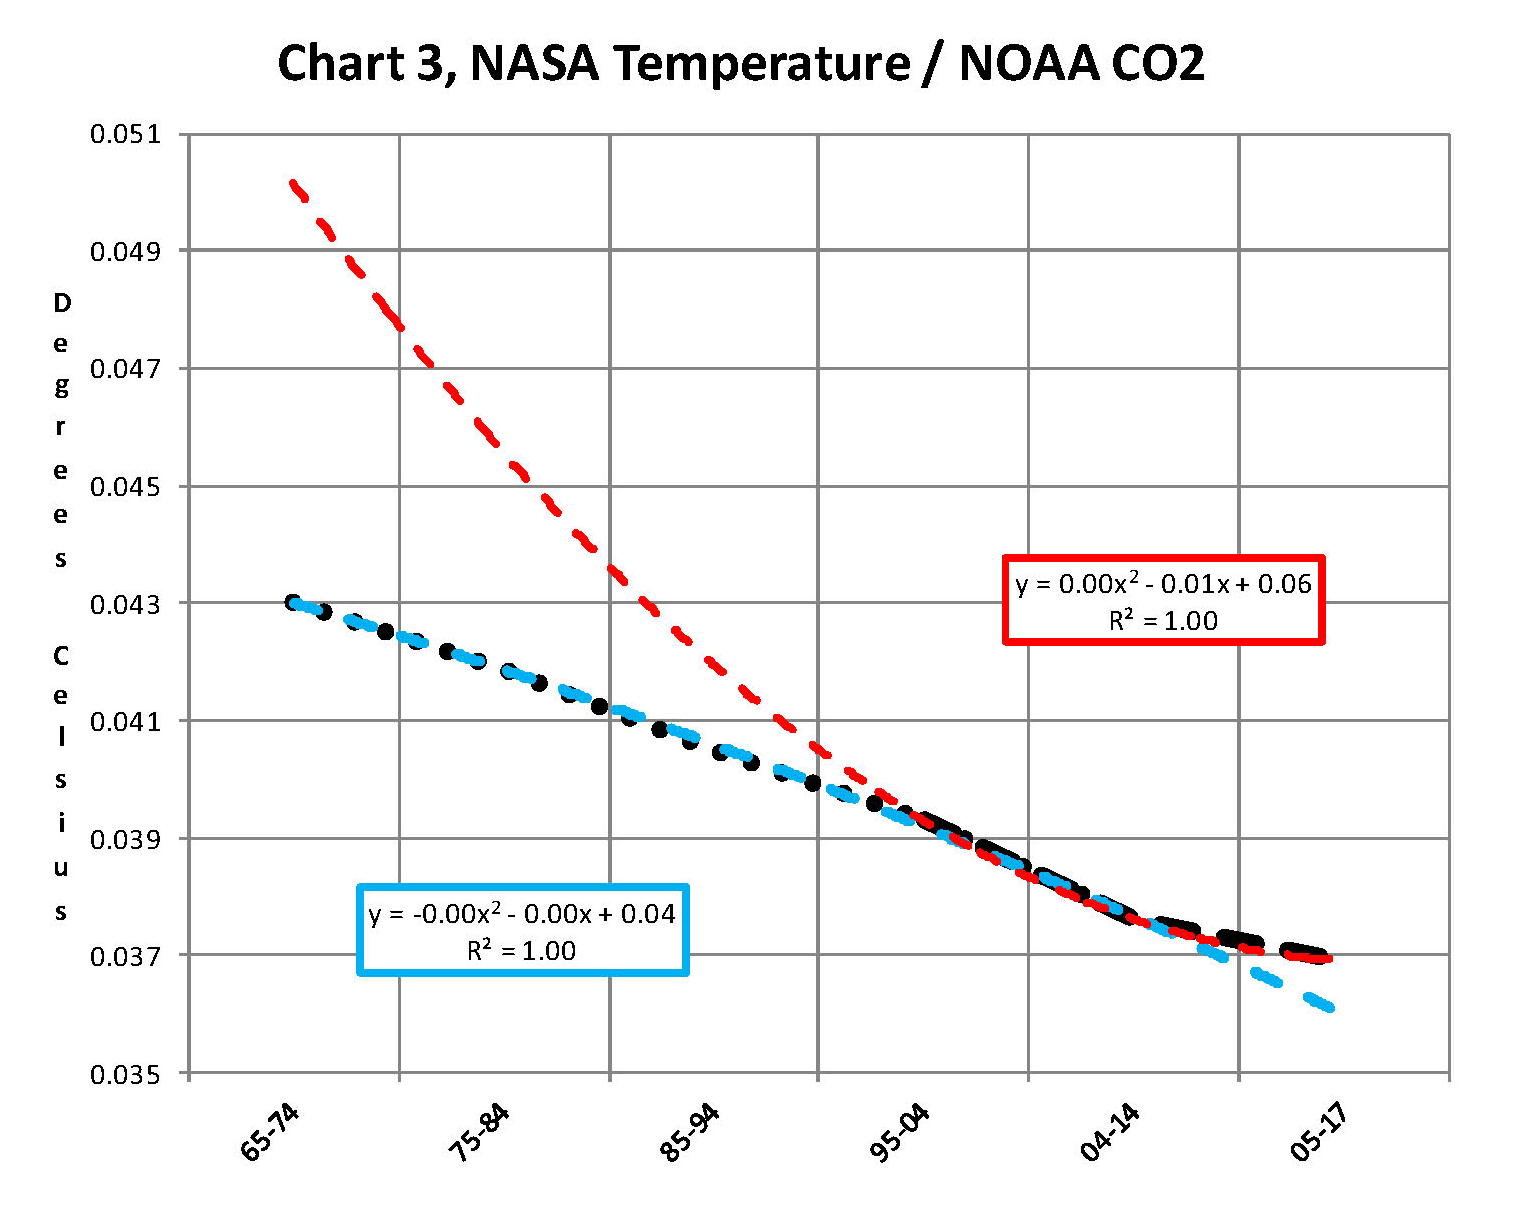
Next we have Chart 3 which is developed from the raw data from NASS and NOAA as shown in Chart 1. This plot was made first by adding ten years blocks of temperature and CO2 as indicated in the Chart 1 and diving by 120 to give an average for each. Then the average Temperature was divided by the average CO2 to give degrees of temperature increase per PPM of CO2. After that was plotted it appeared that there were two different curves. The first was from block 1965-1974 through block 2004-2014 shown as Black Dots and the second was from block 1995-2004 through block 2005-2017 shown as Black Dashes. When trend lines were added they were both almost perfect fits to the raw data and so you cannot see the data points very well on Chart 2. These blocks were picked to represent the entire period of time where we had both NASA temperature data and NOAA CO2 levels.
On Chart 3 there are two sets of color coded information. The first is Cyan plot and the Cyan box with the equation in it along with the R2 value of 1.0 are for the first series from block 1965-1974 through block 2004-2014. The other is the Red plot and the Red box with the equation in it along with the R2 value of 1.0 which are for the first series from block 1965-1974 through block 2004-2017. We can speculate on how this change happened but it can’t be said that the plot change is not real; however additional data will be required to actually prove that something has changed.
In summary the Cyan data set indicates a diminishing effect of CO2 on global temperature for about 54 years and the Red data set represents an increasing effect of CO2 on global temperature for the past 3 years. Since both data sets have an R2 value of 1.00 the trend lines cannot be in question.
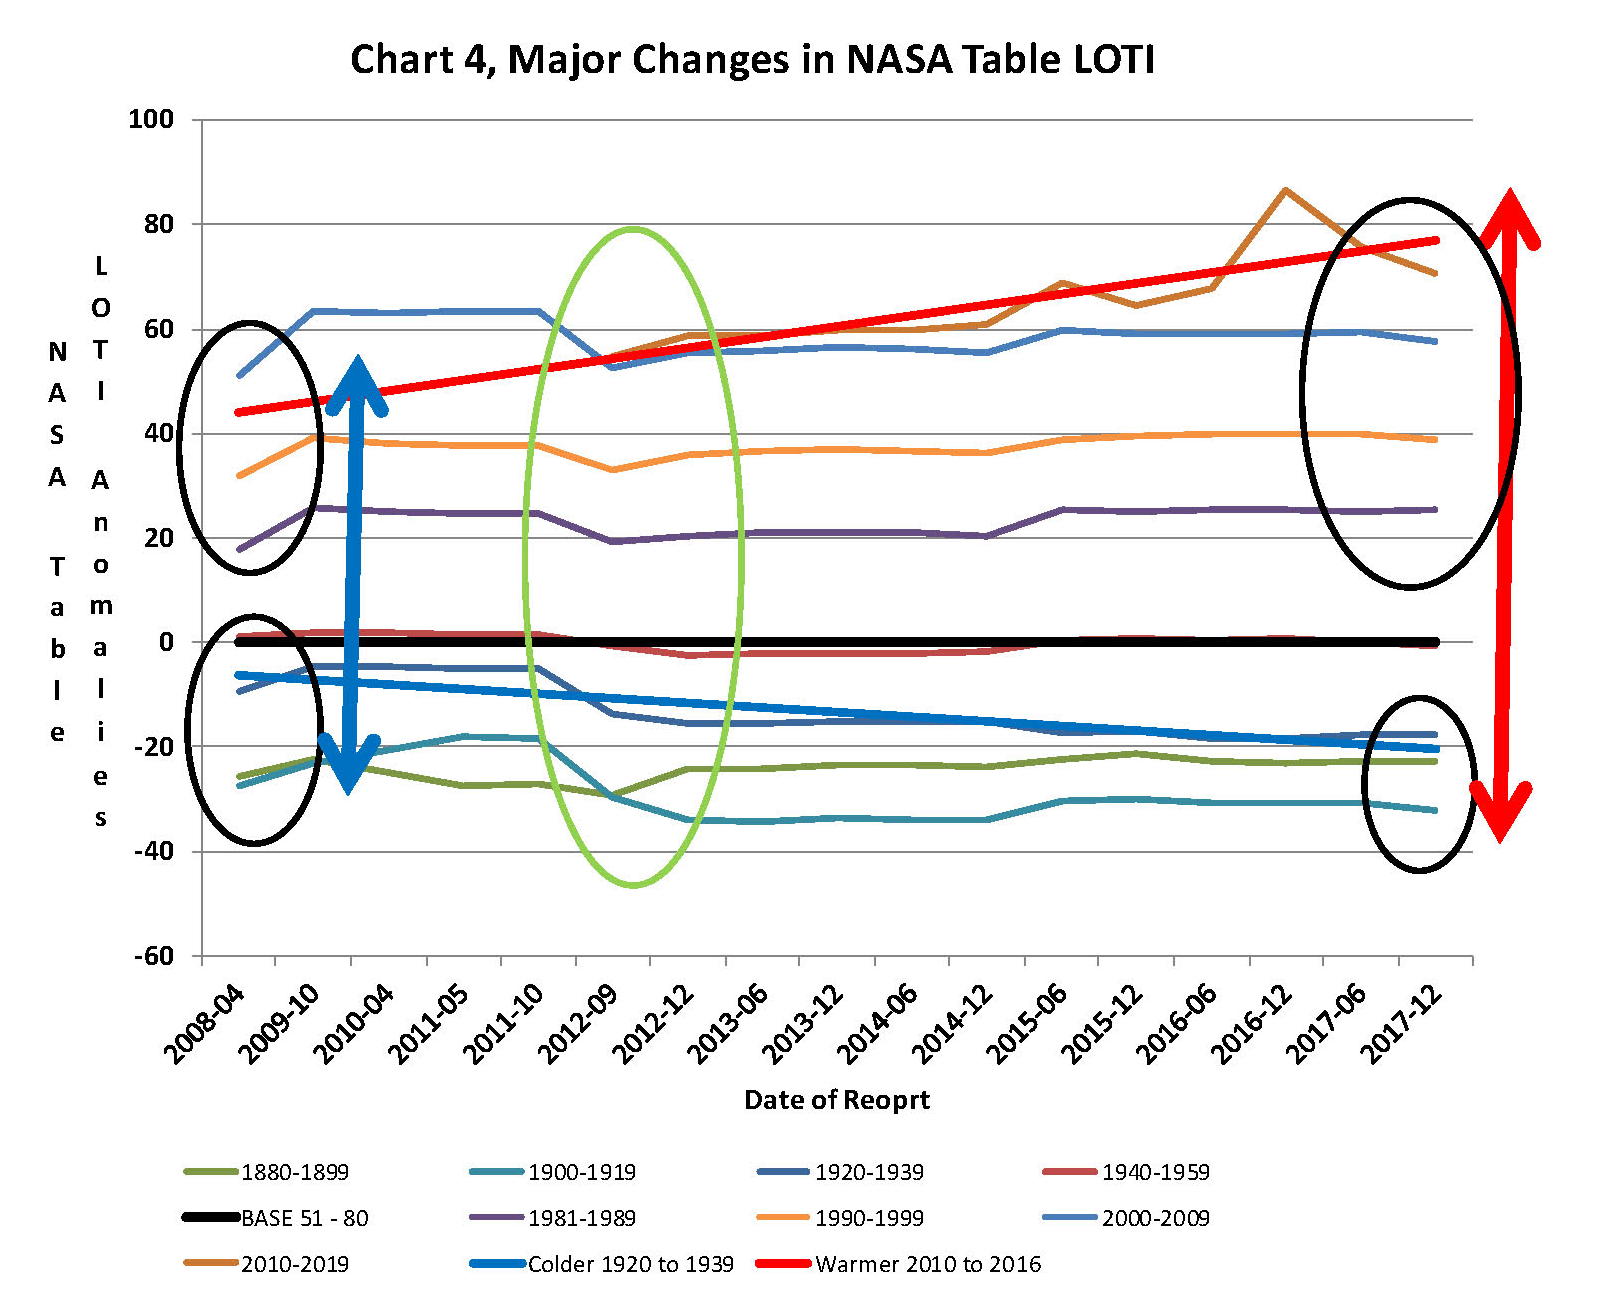
Continuing the analysis of what happened to the NASA data in table LOTI from Chart 3, the following Chart 4 was constructed from the same NASA data. It’s very sad to say but it seems to prove without much doubt that the global temperatures have been manipulated by NASA probably at the request of the federal government such that a case could be made for supporting the COP21 Paris climate conference in December 2015 by showing that the earth was much hotter than it actually was. The dates on the x axis are the date of the NASA LOTI download file. The plots for specific date groupings are set such that one can see what that date range did in each separate NASA download. The proof is shown in Chart 4 below and a discussion will follow below Chart 4 on how Chart 4 was constructed.
At the bottom of Chart 4 is a blue trend line of NASA LOTI temperatures prior to 1950 and starting in2012 the values started going down, getting colder. At the same time the NASA LOTI temperatures from 2012 to the present went up as shown in the red line. There was no change in the base period, black line. This cannot happen with random variables they will cancel each other out; this could only be caused by specific program changes in the process that NASA and NOAA use, in other words it is intentional. So there can be no other reason but an attempt to support the adoption of the Climate accord agreement by the administration, and they were successful as it was agreed to in Paris at COP21.
How this table was constructed is important so a discussion is needed. As stated in the opening paragraph of this paper NASA publishes a table of the estimated global temperature each month as anomalies from a base of 14 degrees Celsius. This table starts with January 1880 and runs to the current date. The new table typical comes out mid-month with the values for the previous month and for December 2017 there were 1,656 values. The process that is used to create this Table is very complex and is called homogenization. What that means is that the entire table is recreated each month and what that also means is that the temperature value for any given month is a variable.
When I realized the extent of that in 2012 I started to save the printouts of the NASA LOTI tables and I went back and found a few of them from when I started this project in 2007. When I started this project what I did is type in all the values from the NASA table into a spreadsheet each month which was a daunting task and I was very happy when NASA started to publish a csv file along with the text of the LOTI data. Then all I had to do is create a routine in excel that would turn the table format into a column format. There are now 65 months in the spreadsheet, when I started this method in 2012 there were maybe only a dozen. The values are residing in the spreadsheet as columns going from left to right so that the individual months are lined up side by side. This makes comparison of months very easy. One note is required here, when I started this model in 07 and for several years thereafter all I was doing is adding the current NASA LOTI current months number to the existing file, a single column, and it never occurred to me that the prior numbers were changing. The past was fixed, so I thought. This was also the way I was entering the NOAA CO2 data which doesn’t change over time.
The original goal was to see if the changes were just random or rounding errors. If that was so then they would wash out over time especially if I grouped the monthly data into blocks. I’ve used both 10 year (120 values) and 20 year (240 values) blocks which would be enough to maintain a fixed number if it was random or rounding. What I found was something quite different after I had a dozen or so columns in the spreadsheet, it appeared that NASA was making the past colder and the present warmer. And the purpose of the previous two Charts 3 and 4 is to show the result. Chart 4 is a bit complex but I have not found a better way to show what happened.
From 1880 to 1960 I used four 20 year blocks. Then I needed the base so there is a 30 year block from 1950 to 1980 and lastly four 10 year blocks from 1980 to the present. The last block is not yet complete as it will run to December 2019. Because the 30 year base block is fixed at 14.0 degrees Celsius there wasn’t much point in charting those individual yearly values even though there was some minor movement in those numbers. That raises an interesting issue for how can the base numbers not change and all the other numbers from 1880 to 2017 can change each month? A note, for each data set of years the plot on Chart 4 should be a straight line from left to right; very minor fluctuation would be OK. For example the plot for 1930 to 1949 (hidden behind the black plot) is what would be normally expected. This is the only plot that doesn’t show major manipulation.
In the four data sets in the 1880 to 1940 blocks in Chart 4 all have moved down probably about a .25 degree Celsius which is not insignificant. So the bottom line is that NASA made all the values from 1880 to 1940 colder by an average of a quarter of a degree Celsius. So that alone accounts for a high percentage of the supposed global warming that NASA shows. From 1980 to 2009 the data change appears to add another .1 degrees Celsius making the apparent differential between data from early 00’s to the present about .35 degrees greater than it was before 2009. That is not random that is a major change and clearly shows manipulation. I would probably never had caught this is if I hadn’t put the values in column format. Looking at all the data from 2008 to 2014 we find that around 2008 NASA showed that the planet had warmed about .75 degrees, Blue double arrow, from the 19th century. Then in 2014, four years later NASA showed that the planet had warmed about .95 degrees Red double arrow from the 19th century. However it gets a worse after that.
The change started in 2012, Green Oval, and Global temperature jumped almost a quarter of a degree by December 2015 just as the COP21 conference was in session. The temperatures kept going up with an eventual increase in global temperature of about 1.2 degrees Celsius in late 2016. At that point with the pressure off NASA appears to be erasing what they did as the global temperatures have now started back down. I’m not sure how many know of this blatant manipulation but it is serious. This is not science.
Now we need to consider other factors than CO2 on Climate change. The fault that occurred in the work that was done in the 1980’s was in assuming that there was an optimum or constant global temperature and therefore any change that was being observed was from the increasing amount of CO2 in the atmosphere. There may have been correlation but it was never proved that there was causation (high R2 value) between CO2 and global temperatures; Chart 3 clearly shows there is not. With that assumption, which limited options, we moved from true science into the realm of political science. True science has an open mind and finds relationships that work in matching observations with predictions. Political science changes history and/or facts to match the desires of the politicians. Since the politicians control the money political science is what we get; which means that what we get may not be technically correct.
A decade ago when I started looking at “climate” change the first thing I did was look at geological temperature changes since it is well known that the climate is not a constant; I learned that 53 years ago in my undergrad geology and climatology courses in 1964. The next paragraph explains currently observed patterns in climate related to this subject and is historical accurate.
Ignoring the last Ice Age which ended some 11,000 years ago when a good portion of the Northern hemisphere was under miles of ice the following observations give a starting point to any serious study on the subject of climate. First, there is a clear up and down movement in global temperatures with a 1,000 some year cycle going back at least 3,000 to 4,000 years; probably because of the apsidal precession of the earth’s orbit of about 20,000 years for a complete cycle. However about every 10,000 years the seasons are reversed making the winter colder and the summer warmer in the northern hemisphere. 10,000 years from now the seasons will be reversed again. Secondly, there are also 60 to 70 year cycles in the Pacific and the Atlantic oceans that are well documented. These are known as the Atlantic Multi Decadal Oscillations (AMO) in the Atlantic and as La Nina and El Nino in the Pacific. Thirdly, we also know that there are greenhouse gases such as carbon dioxide that can affect global temperatures. Lastly the National Academy of Sciences (NAS) estimated that carbon dioxide had a doubling rate of 3.0O Celsius plus or minus 1.5O Celsius in 1979 when there were only two studies available and one for sure and maybe both were not peer reviewed.
The result of looking objectively at the three possible sources of global temperature changes was a series of equations based on these observations that when added together produced a sinusoidal curve that seemed to follow NASA published temperatures very closely when first developed in 2007, and modified a few years later when it was found the short and long cycles were related to multiples of Pi. Since this curve was based on observed temperature patterns it was called a Pattern Climate Model (PCM) which has been described in previous papers and posts on my blog and since it is generated by “equations” many assume it is some form of least squares curve fitting, which it is not. It does seem to be related to ocean currents where the bulk of the planet’s surface heat is stored.
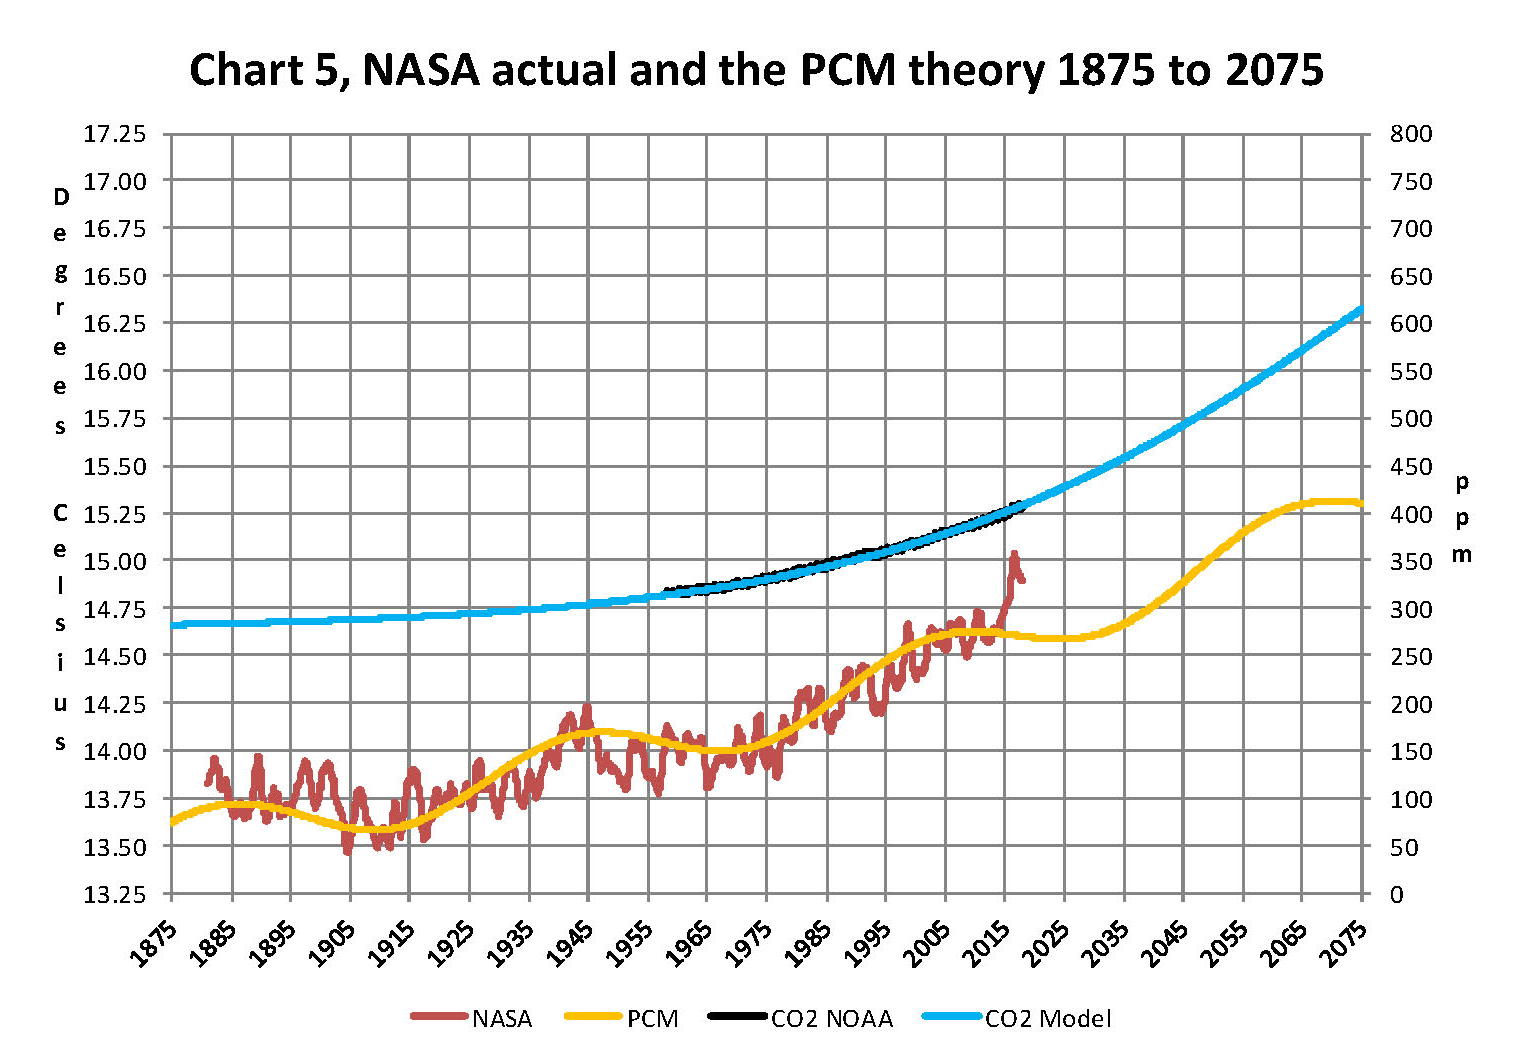
Chart 5 shows the PCM a composite of two cycles and CO2. There is a long trend, 1036.7 years with an up and down of 1.65O Celsius (.00396O C per year) we in the up portion of that trend. Then there is a 69.1 year cycle that moves the trend line up and then down a total of 0.29O Celsius and we are now in the downward portion of that trend (-.01491O C per year), which will continue until around ~2035. Lastly, there is CO2 currently adding about .0079O Celsius per year so together they all basically wash out at -.0039O C per year, which matches the current holding pattern we were experiencing until 2014. After about 2035 the short cycle will have bottomed and turn up and all three will be on the upswing again duplicating what was observed in the 1980’s. Note: the values shown here are only representative from what is in the model.
When using a 12 month running average for global temperatures up until 2014 the PCM model was within +/- .01 degrees of what NASA was publishing in their LOTI table since the early 1960’s as shown in Chart 5. Further the back projection of the PCM plot matched historical records and global temperatures going back past the time of Christ. It should also be considered that geologically CO2 levels have reached levels many times that of the current 400 ppm without destroying the planet so the current hysteria over the current very small numbers can only be explained by political science not real science.
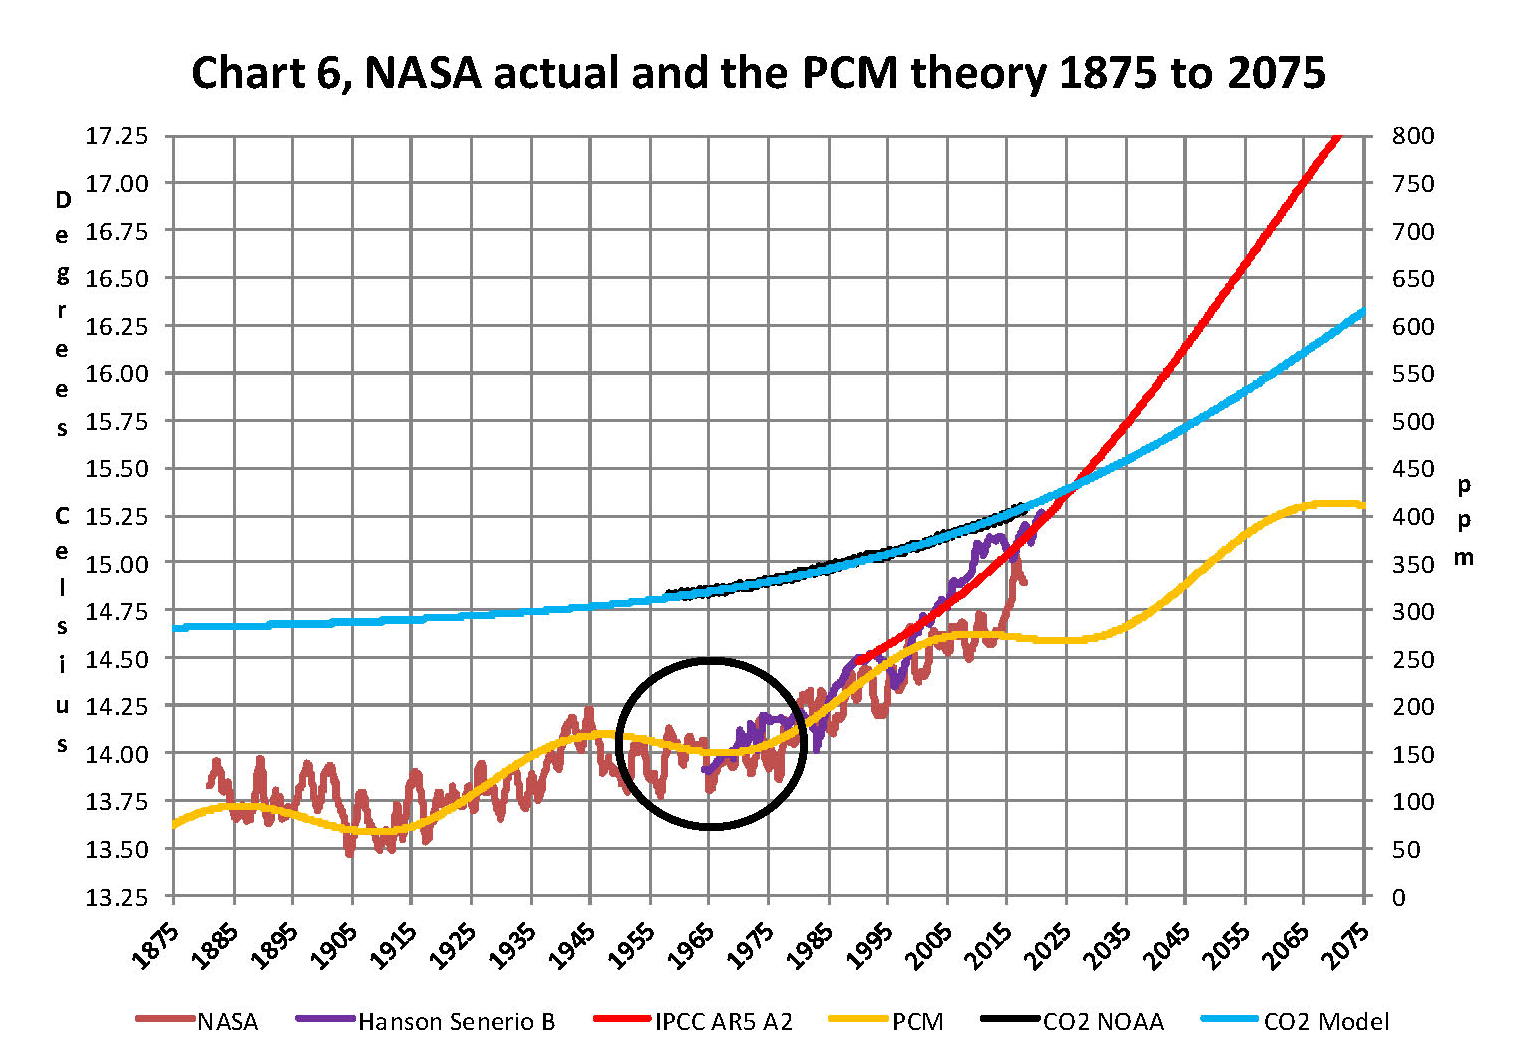
The nest step in this analysis is to put all of the known data and projections into Chart 6 which contains: NASA’s temperatures plot, NOAA’s CO2 plot, the CO2 model plot, the PCM model plot, Hansen’s Scenario B plot, and lastly the IPCC AR5 A2 global temperature plot. With that done we can look at the results and try to make some sense of what is going on with the various arms of the federal government that are promoting that we tax carbon based fuels to eliminate them since they are responsible for the global temperature level going up. As previously stated when the government pours money into the sciences the sciences respond with technical papers the support the governments views, this is what I call political science verses real science as was done prior to the 1980’s; money talks and BS walks as everyone on the street knows.
Chart 6 shows a good overview and contains no data manipulation and the only change that was made was to convert the NASA anomalies back to degrees Celsius to make it more readable to lay people. This is only a change in units and has no bearing on the look. We also need to understand the NASA homogenization process and its relationship to the 30 year base period. The portion in the black circle contains the NASA base period of 14.00 degrees Celsius and the reason it’s brought up here is that the Homogenization process causes the global temperatures to move around since the entire data base all the way back to 1880 is recalculated each month. But since the base has to stay at 14.00 degrees Celsius the program must be set to not allow changes in that period of time. I’m sure the programmers have fun with that. Prior work here has shown how this creates a teeter totter effect with the data plots, some of which have recently been significant.
Next Chart 7 looks at the period from 2010 to 2020 so we can see where a change in CO2 of only a few ppm has caused a major change in the global temperature way beyond anything previously shown in any published NASA data. There are two black ovals on Chart 7 one at the top of Chart 7 which is a black oval around the CO2 levels from 2012 to 2016 and part of 2017 and it’s very obvious that there has been very little change, maybe 7 ppm or about 1.9%. Then at the bottom of Chart 7 is another black oval around the NASA global temperature levels for the same period and its very obvious that there has been a large change, almost .50 degrees Celsius or about 3.1%. There has never been such a large increase in temperature from such a small increase in CO2. By contrast the previous comparable period of the last part of 2010 through 2013 shows about the same increase for CO2 at 1.1% but no increase for global temperature but actually small decrease.
Clarification is needed here as the plot seems to show the jump in temperature in 2016 not 2015; this is a result of the large jump in temperature shown by NASA. Since we are using a 12 month moving average and the increase occurred in only a few months it actually shifted the curve into 2016. The raw data for December 2015 showed the temperature at 15.12 degrees Celsius compared to December 2014 where it was 14.78 degrees Celsius. The actual peak was in February 2016 at 15.35 degrees Celsius. With the global temperature over 15.0 Celsius at COP21 the climate accord was approved and the manipulation was a success. After COP21 the need for Fake Warming was no longer needed and so we are now seeing a downward trend developing.
In summary, the IPCC models were designed before a true picture of the world’s climate was understood. During the 1980’s and 1990’s CO2 levels were going up and the world temperature was also going up so there appeared to be correlation and causation. The mistake that was made was looking at only a ~20 year period when the real variations in climate all move in much longer cycles of decades and centuries. Those other cycles can be observed in the NASA data but they were ignored for some reason. By ignoring those actual geological trends and focusing only on CO2 the Global Climate Models will be unable to correctly plot global temperatures until they are fixed. Also the temperature data from 1850 to 1880 was dropped for some reason as it showed a lower temperature that supported the PCM cycle shown in this paper.
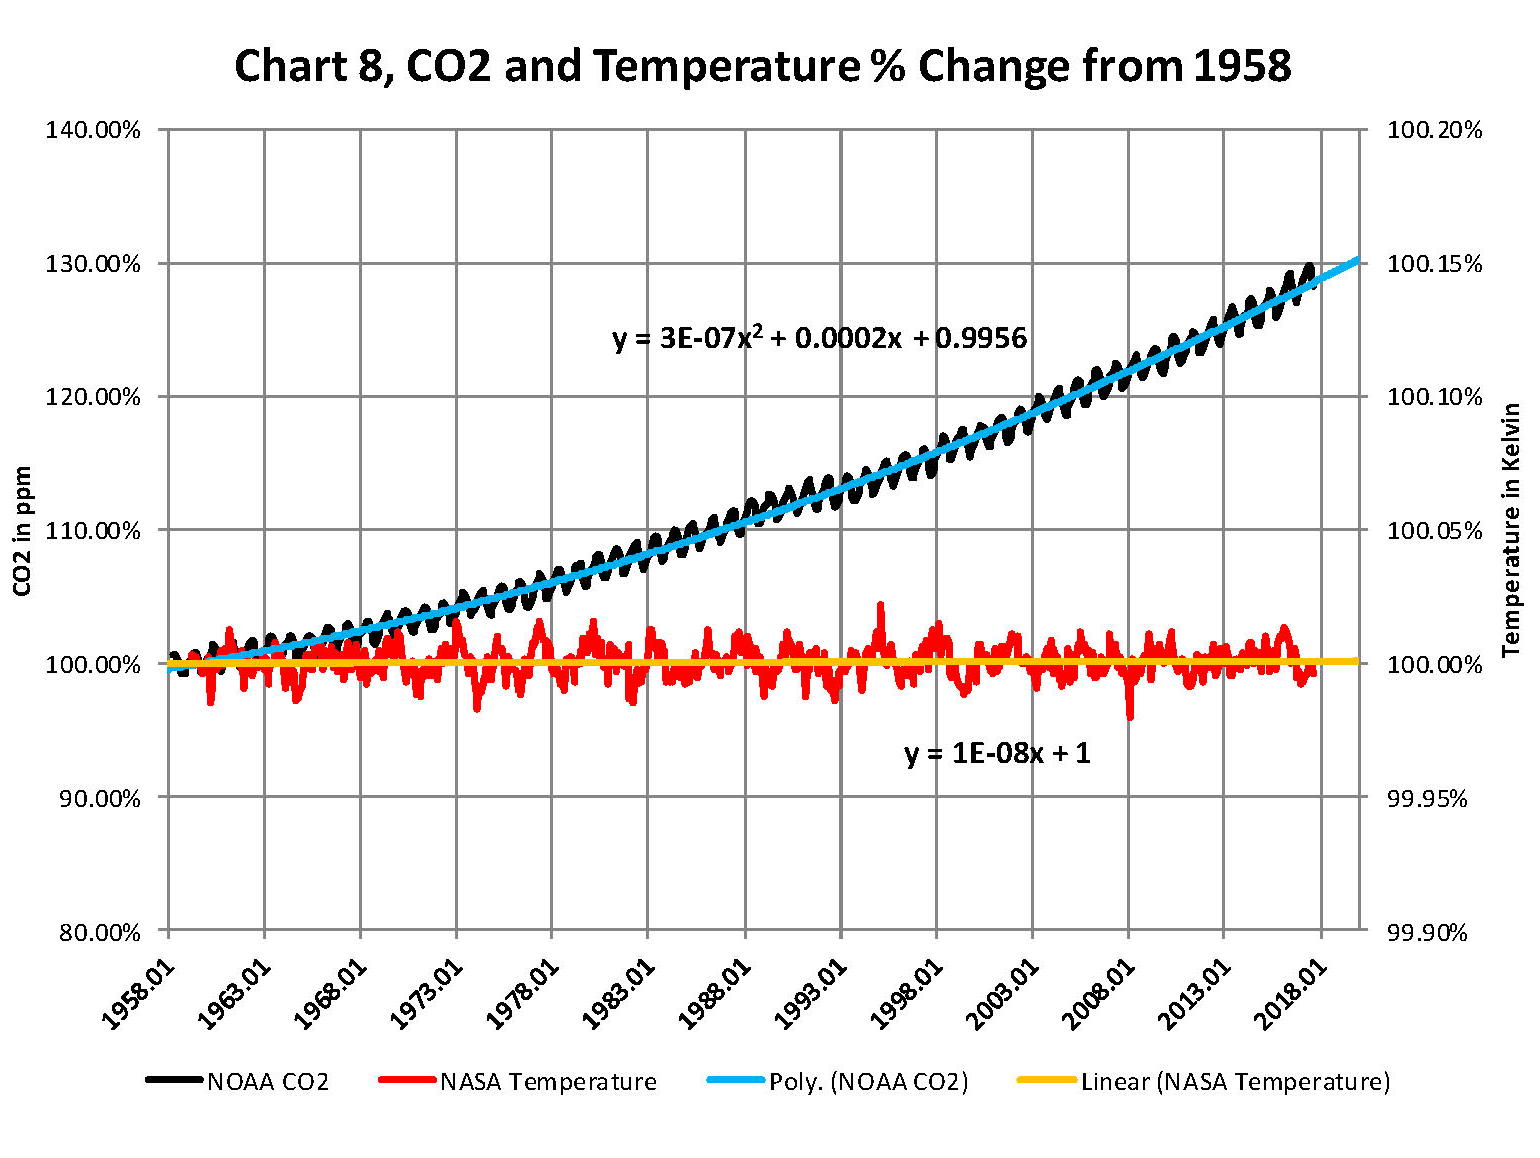
In summary we have Chart 8 which shows why CO2 is not increasing the temperature of the planet by any meaningful amount. The problem, intentional or not, goes back to physics and how we show information. It’s critical that when we talk to nonscientists that information is properly displayed. And nowhere is this more important than when we are discussing temperature. When we talk about weather and local temperatures its going be in Celsius (C) in the EU or degrees Fahrenheit (F) in America e.g. for the base temperature that NASA uses it’s 14.00 C or 57.20 F; but these are both relative measures and do not tell us how much heat (thermal energy) is there. To know that we must use Kelvin (K) and that would be 287.150 K and all three of those numbers 14.00 C, 57.20 F, and 287.150 K are exactly the same temperature, just using a different base. But if the current temperature is 15.00 C that is a 7.1% increase in C, a 3.1% increase in F and a .35% increase in K; so which one is real? The answer is .35% because Kelvin is the only one that measures the total energy!
To show this graphically Chart 8 was constructed by plotting CO2 as a percentage increase from when it was first measured in 1958 the Black plot, the scale is on the left and it shows CO2 going up about 28.5% by December of 2017. That is a large change as anyone would agree. Now how about temperature, well when we look at the percentage change in temperature using the proper units Kelvin we find that the changes in global temperature are almost unmeasurable. The red plot, also starting in 1958, shows that the thermal energy in the earth’s atmosphere has varied by less than +/- .17%; while CO2 has increased by 28.3% which is over 80 times that of increase in temperature. So is there really a problem here?
Lastly, Chart 9 shows what a plot of the PCM model, in yellow, would look like from the year 1400 to the year 2900. This plot matches reasonably well with recorded history and fits the current NASA-GISS table LOTI data, in red, very closely, despite homogenization. I do understand that this PCM model is not based on physics but it is also not some statistical curve fitting. It’s based on observed reoccurring patterns in the climate. These patterns can be modeled and when they are, you get a plot that works better than any of the IPCC’s GCM’s. If the real conditions that create these patterns do not change and CO2 continues to increase to 800 ppm or even 1000 ppm then this model will work well into the foreseeable future. 150 years from now global temperatures will peak at around 15.750 to 16.000 C and then will be on the downside of the long cycle for the next ~500 years.
The overall effect of CO2 reaching levels of 1000 ppm or even higher will be about 1.50 C which is about the same as that of the long cycle. The Green plot on Chart 9 shows the observed pattern with no change in CO2 from the pre-industrial era of ~280 ppm. CO2 cannot affect global temperatures more than 1.500 C +/- no matter what the ppm level of CO2 is. The reason being that the CO2 sensitivity value is not 3.00 per doubling of CO2 but less than 1.00 C per doubling of CO2 as shown in more current scientific work and it’s a logistics curve not a log curve.
The purpose of this post is to make people aware of the errors inherent in the IPCC models so that they can be corrected.
The Obama administration’s “need” for a binding UN climate treaty with mandated CO2 reductions in Europe and America was achieved as predicted at the COP12 conference in Paris in December 2015. To support this endeavor NASA was forced to show ever increasing global temperatures that will make less and less sense based on observations and satellite data which will all be dismissed or ignored. Within a few years the manipulation will be obvious even to those without knowledge in the subject, but by then it will be to late the damage to the reputation of science will have been done.
In closing keep this in mind. The current panic generated by the government using political science is that the current global temperature of around 15.0O Celsius is an increase of 7.14% from the 1960’s when the global temperature was 14.0O Celsius; and that does seem like a lot. However those views would be in error as the actual increase in thermal energy, as measured by temperature, would be only .35% because we must use Kelvin not Celsius when working with heat energy. When we use kelvin the temperature goes from 287.15O K to 288.15O K which is only .35% not 7.14% about 1/20 of what is implied by the IPCC. What the IPCC shows is not technically wrong as much as it is extremely misleading to anyone without a very strong science background.
Sir Karl Raimund Popper (28 July 1902 – 17 September 1994) was an Austrian and British philosopher and a professor at the London School of Economics. He is considered one of the most influential philosophers for science of the 20th century, and he also wrote extensively on social and political philosophy. The following quotes of his apply to this subject.
If we are uncritical we shall always find what we want: we shall look for, and find, confirmations, and we shall look away from, and not see, whatever might be dangerous to our pet theories.
Whenever a theory appears to you as the only possible one, take this as a sign that you have neither understood the theory nor the problem which it was intended to solve.
… (S)cience is one of the very few human activities — perhaps the only one — in which errors are systematically criticized and fairly often, in time, corrected.
Since socialists are unwilling or unable to look at what their philosophy does to people, Firewall host Bill Whittle shows us what it is doing to the animals, and asks how the richest person in Venezuela just happens to be the daughter of the socialist former President of that starving country.
In September of 2015 we shared one of the overarching reasons why CTH would support Donald Trump for President. – SEE HERE – This week, the sentiment behind that reasoning showed up in Davos, Switzerland for the World Economic Forum; we could not be more proud.
Commerce Secretary Wilbur Ross (Wednesday), Treasury Secretary Steven Mnuchin (Thursday) and U.S. President Donald Trump (Friday), collectively outlined how our new U.S. trade and economic policy would engage with the world.
Many media voices (narrative engineers) will, and have, continue to obfuscate, spin, and make predictive declarations about U.S. economic policies based on their ideological views of what President Trump could do, should do, or will do. They will try to convince the American electorate of POTUS Trump’s forward plans. Most of what they declare is false.
In case you missed it, and if you want to know what the accurate compass heading is, skip the media and allow yourselves to rely on the direct message as delivered. You’ll avoid a great deal of heartburn.
The MAGA economic policy explanation begins with trade, Wilbur Ross:
.
The MAGA economic policy explanation is enhanced by finance, Steven Mnuchin:
.
The America-First economic policy is wrapped up by President Trump (transcript here):
.
[…] America is roaring back, and now is the time to invest in the future of America. We have dramatically cut taxes to make America competitive. We are eliminating burdensome regulations at a record pace. We are reforming the bureaucracy to make it lean, responsive, and accountable. And we are ensuring our laws are enforced fairly.
We have the best colleges and universities in the world, and we have the best workers in the world. Energy is abundant and affordable. There has never been a better time to come to America.
[…] In rebuilding America, we are also fully committed to developing our workforce. We are lifting people from dependence to independence, because we know the single best anti-poverty program is a very simple and very beautiful paycheck.
To be successful, it is not enough to invest in our economy. We must invest in our people. When people are forgotten, the world becomes fractured. Only by hearing and responding to the voices of the forgotten can we create a bright future that is truly shared by all.
The nation’s greatness is more than the sum of its production. A nation’s greatness is the sum of its citizens: the values, pride, love, devotion, and character of the people who call that nation home.
[…] Each of you has the power to change hearts, transform lives, and shape your countries’ destinies. With this power comes an obligation, however — a duty of loyalty to the people, workers, and customers who have made you who you are.
So together, let us resolve to use our power, our resources, and our voices, not just for ourselves, but for our people — to lift their burdens, to raise their hopes, and to empower their dreams; to protect their families, their communities, their histories, and their futures.
That’s what we’re doing in America, and the results are totally unmistakable. It’s why new businesses and investment are flooding in. It’s why our unemployment rate is the lowest it’s been in so many decades. It’s why America’s future has never been brighter.
Today, I am inviting all of you to become part of this incredible future we are building together.
Thank you to our hosts, thank you to the leaders and innovators in the audience. But most importantly, thank you to all of the hardworking men and women who do their duty each and every day, making this a better world for everyone.
Together, let us send our love and our gratitude to make them, because they really make our countries run. They make our countries great.
Thank you, and God bless you all. Thank you very much. (Applause.) Thank you very much. (link)
… because he says: “Make America Great Again”! And when Trump says that I hear:
Someone who gives a damn about America, without apology; which is more valuable to me than a perfected highly-rehearsed skill set of 30 second sound bites and white paper policy instructions.
From my perspective any average hard-working American could eat every one of these pinky ring candidates’ lunches, all of them; and if they want to go down the intellectual superiority path… well, that stuff is useless.
Florida Power and Light won the prestigious International Edward Demming award for excellence in multi-platform engineering and efficiency superiority. They didn’t blow every PhD intellectual out of the water with slide rules, CAD programs and engineering acumen. They did it with hard hats and dirty fingernails.
Because they lost the award, the Japanese spent 6 months studying FPL and later published a 1,000 page dissertation essentially saying FPL “wasn’t really good, they were just lucky”….. FPL field leadership laughed, took out markers and wrote on the back of their hard hats: “WE’RE NOT GOOD, WE’RE RUCKY”….
When every single Kuwaiti oil field was blown up by Saddam Hussein, they said it would take 5 years to cap them all off and restart their oil pumping industry. The Kuwaiti’s and Saudi’s called Texans, who had them all capped and back in working order in 10 months.
We are a nation that knows how to get shit done.
When the Northern Chile mine workers were trapped two miles underground, they said no-one could save them. Who did they call for help? A bunch of hick miners from USA coal country who went down there, worked on the fly, engineered the rescue equipment on site, and saved everyone of them….
That’s our America.
When a half-breed Islamic whack job, armed with an AK-47 and a goal to meet his seven virgins, began opening fire on a train in France, the Americans on board didn’t run to the nearest safe room and hide themselves amid baguettes and brie. They said “let’s go”, and beat the stuffing out of that little nut with a death wish.
Legion d’Honneur or not, that’s us. That’s just how we roll.
Lady Liberty can stroll along the Champs-Elysées with a swagger befitting Mae West because without her arrival they’d be speaking German in the Louvre. Yet for the better part of the past decade a group of intellectual something-or-others have been teaching an insufferable storyline that it’s better to be sitting around a campfire eating sustainable algae cakes and picking parasites off each other.
Enough.
When I hear Donald Trump say “Let’s Make America Great Again”, I also hear the familiar echo “cowboy up” people.
It’s high time we stop being embarrassed about our exceptional nature, and start being proud of it again. Because when it matters most, when it really counts, when it’s really needed, there’s a whole bunch of people all around this world of ours that are mighty happy when swagger walks in to solve their problems.
Yeah, “let’s make America great again”. Swagger on !
Tokyo has been hit by the Global Cooling as well. The cold snap has gripped Japan causing tremendous chaos. This is the coldest in 48 years, according to Japan’s Meteorological Agency. While the Global Warming crowd is attributing this to climate change caused by humans, nobody tries to explain that this is moving back to cold periods before 1900 and the invention of cars
Round six of NAFTA renegotiation talks continue today as Canada and Mexico claim cautious optimism that a round seven will take place. This round of talks is scheduled to continue through Monday and end with a much anticipated a joint press conference between Ildefonso Guajardo (Mex), Chrystia Freeland (Can) and U.S. Trade Rep. Robert Lighthizer. There were seven rounds initially scheduled.
Canada and Mexico are trying to close less important, and less controversial, trade chapters in an effort to give the illusion of progress and frame a political narrative that lends itself toward continuing to talk; ie. round seven.
However, if there’s no significant progress on the larger issues it’s doubtful Lighthizer will find value in endless words that amount to nothing.
Canada and Mexico have been lobbying U.S. politicians hard to retain their parasitic trade positions. Additionally, a significant number of Washington DC politicians are willing to take massive bribes from the U.S. Chamber of Commerce lobbyists and support the export of American economic jobs and wealth. This is another key UniParty indulgence issue.
Big Corporate Agriculture (Big AG), the consortium of massive multinational agriculture companies who hold stakes in the entire continent, are pushing hard to keep their “controlled market” dominance in place, and is attempting to stoke fears using false claims about farms and negative trade impacts to farmers. Pure nonsense.
The three major sticking points remain (there are more, but these are the best known):
1) Rules of Origin; 2) Conflict Resolution; and 3) Sunset Provisions for renegotiation.
Rules of Origin – Team U.S.A. wants car North American auto manufacturers to use at least 60% parts from within North America.
Team CanaMex wants to use fully assembled auto parts from China and Asia to assemble cars in Mexico and Canada and sell them as American made automobiles.
Conflict Resolution. Team U.S.A. wants an independent panel to deal with trade disputes, comprised of officials in relationship to the size of each economy.
Team CanaMex (the parasites) want to be able to override any U.S. objections to their manufacturing outcomes. They demand equality in voting. The U.S. is the host.
Sunset: Team U.S.A. wants the NAFTA agreement revisited, reviewed and renegotiated if needed, every five years. Some manufacturing sectors entirely change. [Example e-Commerce didn’t even exist when NAFTA was created, 25 years ago.]
Team CanaMex says no way. Whatever final trade deal is decided, is put upon the U.S. to deal with forever regardless of any changes in any sector.
It’s all smoke and mirrors at this point. Hopefully, Lighthizer will show up on Monday and simply say ‘enough, we’re done’.
End NAFTA and do bi-lateral trade deals where the size and scale of the U.S. market -our leverage- determines a more favorable outcome for the U.S. against both Canada and Mexico. Enough with these silly games.
(Via Reuters) […] During the sixth round, Canada raised what it called creative ways of meeting U.S. demands for higher North American content in autos, a sunset clause that would allow one party to quit the treaty after five years, and major changes to existing conflict resolution mechanisms.
“I think we have demonstrated we have engaged on most of the big issues,” Verheul said in his remarks to Reuters. “We’ve made progress on some of the smaller ones, so I think (it was) not a bad week.”
The Mexican official said that Canada’s proposals on rules of origin for autos, the sunset clause and conflict resolution mechanism were “positive, in as much as they are an attempt to move things forward.”
Speaking separately, a second Canadian government source said Ottawa was cautiously optimistic about the round, given that the U.S. side had not summarily rejected the proposals for compromise. (read more)
When President Trump left the Davos economic forum, Secretary T-Rex traveled to Poland for a bilateral meeting with Polish Foreign Minister Jacek Czaputowicz. Many readers are aware how the U.S. and Poland have formed a very strong bond, a very strategic alliance, since the Trump administration took office.
Last year President Trump visited Warsaw to solidify a geopolitical relationship based on common interests and a desire to help Poland push back against Russian leverage based on energy dependence. Poland is a key strategic ally for the Trump administration, and more importantly a trusted ally; arguably more so than the U.K.
T-Rex held a joint press conference with his Polish counterpart Foreign Minister Jacek Czaputowicz. Video:
.
After the visit to Poland, T-Rex flew to London (there now) for the opening of the new U.S. Embassy. While in the U.K. T-Rex will be meeting with Boris Johnson to discuss mutual interests and continue trying to determine if the U.K. is a willing trade partner.
The relationship between the U.S. and the U.K. is unfortunately defined by the downward trajectory of British politics. The level of trust between the U.S. and the U.K. is at historic lows.
Great Britain has shifted far to the ideological left in the past several years, and no longer reflects a positive outlook toward national sovereignty. There is no guarantee -despite Brexit- the U.K. has not past the point of no return.
Britannia might well be lost, and it would be a waste of political energy to keep trying to save the U.K. from herself. Hence the EU Baltic states gain attention and value.
The U.S. Fourth Quarter GDP growth was reported two days ago at 2.6% and that stunned everyone who were expecting a much higher number. All U.S. economic indicators including U.S. Holiday consumer spending, which accounts for around two-thirds of total GDP, were off the charts in the fourth quarter growing +5.5% over the prior holiday.
The total growth in fourth quarter consumer spending was almost four percent (3.8%), that’s the highest rate of consumer spending in well over two years. Q4 investment in new housing increased 11.6%, business spending on equipment surged 11.4% and outlays on structures edged up 1.4%.
Before the BEA (Bureau of Economic Analysis) announcement, everyone predicted 4th quarter GDP growth would easily be over 3%, and most likely in the 3.5 to 4.0% range.
So what gives. Why did the Q4 GDP only grow at 2.6% ?
It seems a little funny to be griping about 2.6% growth because, well, that’s really good, Bigly even; so hopefully those within the Commerce Department don’t take this review personally. But, c’mon, we expected more… Well, the answer to the question is actually in the first few paragraphs of their release, and later in the deep weeds of the data. I’ll explain.
First, the part of the announcement to note carefully:
[…] The Bureau emphasized that the fourth-quarter advance estimate released today is based on source data that are incomplete or subject to further revisionby the source agency (see “Source Data for the Advance Estimate” on page 3). The “second” estimate for the fourth quarter, based on more complete data, will be released on February 28, 2018.
The “source data for the advance estimate” is another set of separate analytical disclaimers (pdf here) which informs users there are economic data-sets that contain ‘less than‘ three months of information. To see what data is missing, and what “assumptions” the BEA recommends, you to travel to a third level of depth (LINK HERE), and then to the key source data and BEA assumptions (excel spreadsheet here).
Don’t try this at home without a pocket protector and guidebook to the fourth level of Dantes inferno. So let me try to make this easy.
You will remember from prior conversations the U.S. GDP is the combined value of all goods and services produced and sold in the U.S. *minus* the value of all imported goods and services.
The value of imported stuff is always subtracted from value of the stuff we generate because the imported stuff doesn’t provide any economic benefit to America.
U.S. GDP is what we produce, minus what we import. That’s important to understand.
The BEA is essentially saying there were massive amounts of imports in the fourth quarter, but they are unable to determine exactly how much that was.
That makes sense because all records for American on-line sales were broken; and a lot of those purchases were probably Chinese (and Asian, or EU) sellers, selling clothes and stuff into the U.S. as you purchased Christmas presents etc.
The BEA has no way of knowing from top-line sales (financial data) how much of the small stuff (clothes, gadgets, etc.) came from outside the U.S…. to your doorstep…. Well, not yet.
Additionally, all the inventories of similar stuff, from U.S. manufacturers and retail sellers, is now wiped out (ie. “low inventory”), and as such – the value of that inventory is gone. It is now in the bank. There is no way of knowing how much that domestic inventory was, as part of the overall record-breaking fourth quarter sales.
So the BEA essentially deduced, ie. guessed, that a massive amount of product value needed to be deducted from U.S. GDP growth.
How much did they deduct?
Try 1.96%
Without knowing exactly how much of the overall 4th quarter retail sales were from imported products and services, the BEA went with the biggest number they could estimate. The analysis is deep in the weeds on Chart #2 Line #50 (pdf here and below).
I cut it out so you can see:
(click to enlarge)
The 4th quarter import deduction to GDP (goods -1.91%, services -.05%) is the biggest deduction EVER, and potentially, heck, likely, massively over-estimated.
Hence their disclaimer: “The Bureau emphasized that the fourth-quarter advance estimate released today is based on source data that are incomplete or subject to further revision by the source agency.”
Specifically because the BEA made the biggest deduction in their history to the GDP growth rate; and specifically because fourth quarter sales were so historic in scope; we can expect that on February 28th, 2018, when the full rolled-up data is reviewed, there will likely be the biggest revision ever to their 2.6% GDP growth. Initial estimate too low.
If you just use import history as a guide the actual 4th quarter GDP growth will end up at least a full one percent higher. That would put the actual result around 3.6% which is exactly the landscape everyone thought it would be.
To answer the question: Did the BEA sandbag the number? Well, you decide. I think the evidence is clear they have been far too conservative with the estimate.
Addendum: To slightly defend the BEA from criticism, it should be noted that foreign manufacturers (think Samsung) fully anticipated a tough year for them in the face of President Trump’s policies to level trade imbalances. There is actual evidence many Asian companies, specifically Samsung and LE, shipped massive amounts of parts into the U.S. in advance of this year. Commerce Secretary Wilbur Ross spoke to this at Davos.
Earlier today President Trump delivered a speech at the World Economic Forum in Davos, Switzerland. (Video and Transcript below)
[Transcript] 2:02 P.M. – PRESIDENT TRUMP: Thank you, Klaus, very much. It’s a privilege to be here at this forum where leaders in business, science, art, diplomacy, and world affairs have gathered for many, many years to discuss how we can advance prosperity, security, and peace.
I’m here today to represent the interests of the American people and to affirm America’s friendship and partnership in building a better world.
Like all nations represented at this great forum, America hopes for a future in which everyone can prosper, and every child can grow up free from violence, poverty, and fear.
Over the past year, we have made extraordinary strides in the U.S. We’re lifting up forgotten communities, creating exciting new opportunities, and helping every American find their path to the American Dream — the dream of a great job, a safe home, and a better life for their children.
After years of stagnation, the United States is once again experiencing strong economic growth. The stock market is smashing one record after another, and has added more than $7 trillion in new wealth since my election. Consumer confidence, business confidence, and manufacturing confidence are the highest they have been in many decades.
Since my election, we’ve created 2.4 million jobs, and that number is going up very, very substantially. Small-business optimism is at an all-time high. New unemployment claims are near the lowest we’ve seen in almost half a century. African American unemployment has reached the lowest rate ever recorded in the United States, and so has unemployment among Hispanic Americans.
The world is witnessing the resurgence of a strong and prosperous America. I’m here to deliver a simple message: There has never been a better time to hire, to build, to invest, and to grow in the United States. America is open for business, and we are competitive once again.
The American economy is by far the largest in the world, and we’ve just enacted the most significant tax cuts and reform in American history. We’ve massively cut taxes for the middle class and small businesses to let working families keep more of their hard-earned money. We lowered our corporate tax rate from 35 percent, all the way down to 21 percent. As a result, millions of workers have received tax cut bonuses from their employers in amounts as large as $3,000.
The tax cut bill is expected to raise the average American’s household income by more than $4,000. The world’s largest company, Apple, announced plans to bring $245 billion in overseas profits home to America. Their total investment into the United States economy will be more than $350 billion over the next five years.
Now is the perfect time to bring your business, your jobs, and your investments to the United States. This is especially true because we have undertaken the most extensive regulatory reduction ever conceived. Regulation is stealth taxation. The U.S., like many other countries, unelected bureaucrats — and we have — believe me, we have them all over the place — and they’ve imposed crushing and anti-business and anti-worker regulations on our citizens with no vote, no legislative debate, and no real accountability.
In America, those days are over. I pledged to eliminate two unnecessary regulations for every one new regulation. We have succeeded beyond our highest expectations. Instead of 2 for 1, we have cut 22 burdensome regulations for every 1 new rule. We are freeing our businesses and workers so they can thrive and flourish as never before. We are creating an environment that attracts capital, invites investment, and rewards production.
America is the place to do business. So come to America, where you can innovate, create, and build. I believe in America. As President of the United States, I will always put America first, just like the leaders of other countries should put their country first also.
But America first does not mean America alone. When the United States grows, so does the world. American prosperity has created countless jobs all around the globe, and the drive for excellence, creativity, and innovation in the U.S. has led to important discoveries that help people everywhere live more prosperous and far healthier lives.
As the United States pursues domestic reforms to unleash jobs and growth, we are also working to reform the international trading system so that it promotes broadly shared prosperity and rewards to those who play by the rules.
We cannot have free and open trade if some countries exploit the system at the expense of others. We support free trade, but it needs to be fair and it needs to be reciprocal. Because, in the end, unfair trade undermines us all.
The United States will no longer turn a blind eye to unfair economic practices, including massive intellectual property theft, industrial subsidies, and pervasive state-led economic planning. These and other predatory behaviors are distorting the global markets and harming businesses and workers, not just in the U.S., but around the globe.
Just like we expect the leaders of other countries to protect their interests, as President of the United States, I will always protect the interests of our country, our companies, and our workers.
We will enforce our trade laws and restore integrity to our trading system. Only by insisting on fair and reciprocal trade can we create a system that works not just for the U.S. but for all nations.
As I have said, the United States is prepared to negotiate mutually beneficial, bilateral trade agreements with all countries. This will include the countries in TPP, which are very important. We have agreements with several of them already. We would consider negotiating with the rest, either individually, or perhaps as a group, if it is in the interests of all.
My administration is also taking swift action in other ways to restore American confidence and independence. We are lifting self-imposed restrictions on energy production to provide affordable power to our citizens and businesses, and to promote energy security for our friends all around the world. No country should be held hostage to a single provider of energy.
America is roaring back, and now is the time to invest in the future of America. We have dramatically cut taxes to make America competitive. We are eliminating burdensome regulations at a record pace. We are reforming the bureaucracy to make it lean, responsive, and accountable. And we are ensuring our laws are enforced fairly.
We have the best colleges and universities in the world, and we have the best workers in the world. Energy is abundant and affordable. There has never been a better time to come to America.
We are also making historic investments in the American military because we cannot have prosperity without security. To make the world safer from rogue regimes, terrorism, and revisionist powers, we are asking our friends and allies to invest in their own defenses and to meet their financial obligations. Our common security requires everyone to contribute their fair share.
My administration is proud to have led historic efforts, at the United Nations Security Council and all around the world, to unite all civilized nations in our campaign of maximum pressure to de-nuke the Korean Peninsula. We continue to call on partners to confront Iran’s support for terrorists and block Iran’s path to a nuclear weapon.
We’re also working with allies and partners to destroy jihadist terrorist organizations such as ISIS, and very successfully so. The United States is leading a very broad coalition to deny terrorists control of their territory and populations, to cut off their funding, and to discredit their wicked ideology.
I am pleased to report that the coalition to defeat ISIS has retaken almost 100 percent of the territory once held by these killers in Iraq and Syria. There is still more fighting and work to be done and to consolidate our gains. We are committed to ensuring that Afghanistan never again becomes a safe haven for terrorists who want to commit mass murder to our civilian populations. I want to thank those nations represented here today that have joined in these crucial efforts. You are not just securing your own citizens, but saving lives and restoring hope for millions and millions of people.
When it comes to terrorism, we will do whatever is necessary to protect our nation. We will defend our citizens and our borders. We are also securing our immigration system, as a matter of both national and economic security.
America is a cutting-edge economy, but our immigration system is stuck in the past. We must replace our current system of extended-family chain migration with a merit-based system of admissions that selects new arrivals based on their ability to contribute to our economy, to support themselves financially, and to strengthen our country.
In rebuilding America, we are also fully committed to developing our workforce. We are lifting people from dependence to independence, because we know the single best anti-poverty program is a very simple and very beautiful paycheck.
To be successful, it is not enough to invest in our economy. We must invest in our people. When people are forgotten, the world becomes fractured. Only by hearing and responding to the voices of the forgotten can we create a bright future that is truly shared by all.
The nation’s greatness is more than the sum of its production. A nation’s greatness is the sum of its citizens: the values, pride, love, devotion, and character of the people who call that nation home.
From my first international G7 Summit, to the G20, to the U.N. General Assembly, to APEC, to the World Trade Organization, and today at the World Economic Forum, my administration has not only been present, but has driven our message that we are all stronger when free, sovereign nations cooperate toward shared goals and they cooperate toward shared dreams.
Represented in this room are some of the remarkable citizens from all over the world. You are national leaders, business titans, industry giants, and many of the brightest minds in many fields.
Each of you has the power to change hearts, transform lives, and shape your countries’ destinies. With this power comes an obligation, however — a duty of loyalty to the people, workers, and customers who have made you who you are.
So together, let us resolve to use our power, our resources, and our voices, not just for ourselves, but for our people — to lift their burdens, to raise their hopes, and to empower their dreams; to protect their families, their communities, their histories, and their futures.
That’s what we’re doing in America, and the results are totally unmistakable. It’s why new businesses and investment are flooding in. It’s why our unemployment rate is the lowest it’s been in so many decades. It’s why America’s future has never been brighter.
Today, I am inviting all of you to become part of this incredible future we are building together.
Thank you to our hosts, thank you to the leaders and innovators in the audience. But most importantly, thank you to all of the hardworking men and women who do their duty each and every day, making this a better world for everyone. Together, let us send our love and our gratitude to make them, because they really make our countries run. They make our countries great.
Thank you, and God bless you all. Thank you very much. (Applause.) Thank you very much.
MR. SCHWAB: Thank you, Mr. President, for this inspiring speech. As it is tradition at the forum, I will ask you one or two questions.
And my first question is, why is the tax reform — why has it been of such a high priority for your administration?
PRESIDENT TRUMP: Well, first of all, Klaus, I want to congratulate you. This is an incredible group of people. We had dinner last night with about 15 leaders of industry, none of whom I knew, but all of whom I’ve read about for years. And it was truly an incredible group. But I think I have 15 new friends. So this has been really great what you’ve done and putting it together, the economic forum.
The tax reform was a dream of a lot of people over many years, but they weren’t able to get it done. Many people tried, and Ronald Reagan was really the last to make a meaningful cut and reform. And ours is cutting and reforming. We emphasize cut, but the reform is probably almost as important. We’ve wanted to do it. It is very tough, politically, to do it. Hard to believe that would be, but it is very, very tough. That’s why it hasn’t been done in close to 40 years.
And once we got it going, it was going. And the big — and I wouldn’t say a total surprise, but one of the big things that happened and took place is AT&T and some others came out very early and they said they were going to pay thousands and thousands of dollars to people that work for their companies. And you have 300,000, 400,000, 500,000 people working for these companies, and all of a sudden it became like a big waterfall, a big, beautiful waterfall where so many companies are doing it. And even today they just announced many more. But every day they announce more and more. And now it’s a fight for who’s going to give the most. It started at 1,000, and now we have them up to 3,000.
This is something that we didn’t anticipate. Oftentimes in business, things happen that you don’t anticipate. Usually that’s a bad thing, but this was a good thing. This came out of nowhere. Nobody ever thought of this as a possibility even. It wasn’t in the equation. We waited — we said, wait until February 1st when the checks start coming in. And people, Klaus, have a lot more money in their paycheck — because it’s not just a little money, this is a lot of money for people making a living doing whatever they may be doing.
And we really though February 1st it was going to kick in and everybody was going to be — well, we haven’t even gotten there yet and it’s kicked in. And it’s had an incredible impact on the stock market and the stock prices. We’ve set 84 records since my election — record stock market prices, meaning we hit new highs 84 different times out of a one-year period. And that’s a great thing. And in all fairness, that was done before we passed the tax cuts and tax reform.
So what happened is really something special. Then, as you know, and as I just said, Apple came in with $350 billion. And I tell you, I spoke with Tim Cook; I said, Tim, I will never consider this whole great run that we’ve made complete until you start building plants in the U.S. And I will tell you, this moved up very substantially. But when I heard 350, I thought he was talking — I thought they were talking $350 million. And, by the way, that’s a nice-sized plant. Not the greatest, but not bad. And they said, “No, sir. It’s $350 billion.” I said, that is something.
Well, we have tremendous amounts of money, including my newfound friends from last night — great companies. They’re all investing. When one of the gentlemen said he’s putting in $2 billion because of the tax cuts, I said to myself, “Wow, he’s actually the cheap one in the group” — because they’re putting in massive numbers of billions of dollars.
So I think you have a brand-new United States. You have a United States where people from all over the world are looking to come in and invest, and there’s just nothing like what’s happening.
And I just want to finish by — I have a group of people that have been so — I have a whole lot of them, so I won’t introduce because then I’ll insult at least half of them. But I’ve had a group of people that worked so hard on this and other things.
And we’re really doing — we had a great first year — so successful in so many different ways. And there’s a tremendous spirit. When you look at all of the different charts and polls, and you see, as an example, African American unemployment at the historic low — it’s never had a period of time like this. Same with Hispanic. Women at a 17-year low. It’s very heartwarming to see. But there’s a tremendous spirit in the United States. I would say it’s a spirit like I have never witnessed before. I’ve been here for awhile. I have never witnessed the spirit that our country has right now.
So I just want to thank you all, and all those that are pouring billions of dollars into our country, or ten dollars into our country, we thank you very much. Thank you.
MR. SCHWAB: Mr. President, I will ask you, maybe, a personal question. But before doing so, I’d just like to —
PRESIDENT TRUMP: Sounds very interesting.
MR. SCHWAB: — acknowledge that —
PRESIDENT TRUMP: I didn’t know about this one.
MR. SCHWAB: I would like to acknowledge the strong presence of your Cabinet members
PRESIDENT TRUMP: Yes.
MR. SCHWAB: — who tremendously contributed to the discussions the last (inaudible).
PRESIDENT TRUMP: Good, I would like to do that. That’s very nice.
MR. SCHWAB: Yeah. Now —
PRESIDENT TRUMP: Steven, Wilbur, Gary, Robert, even my General and my various other generals, you know. We’re making our military protection a little bit better for us too. So thank you very much. Does everybody understand that? I think so. Thank you all for being here.
MR. SCHWAB: Now my, maybe personal, question would be: What experience from your past have been most useful in preparing you for the Presidency?
PRESIDENT TRUMP: Well, being a businessman has been a great experience for me. I’ve loved it. I’ve always loved business. I’ve always been good at building things, and I’ve always been successful at making money. I’d buy things that would fail –that would be failures — and I’d turn them around and try and get them for the right price, and then I’d turn them around and make them successful. And I’ve been good at it. And that takes a certain ability.
And, you know, historically, I guess, there’s never really been a businessman or businessperson elected President. It’s always been a general or a politician. Throughout history, it’s always been a general — you had to be a general — but mostly it was politicians. You never have a businessman.
And then, in all fairness, I was saying to Klaus last night: Had the opposing party to me won — some of whom you backed, some of the people in the room — instead of being up almost 50 percent — the stock market is up since my election almost 50 percent — rather than that, I believe the stock market from that level, the initial level, would have been down close to 50 percent. That’s where we were heading. I really believe that — because they were going to put on massive new regulations. You couldn’t breathe. It was choking our country to death. And I was able to see that, Klaus, as a businessperson.
The other thing is, I’ve always seemed to get, for whatever reason, a disproportionate amount of press or media. (Laughter.) Throughout my whole life — somebody will explain someday why — but I’ve always gotten a lot. (Laughter.) And as businessman I was always treated really well by the press. The numbers speak and things happen, but I’ve always really had a very good press. And it wasn’t until I became a politician that I realized how nasty, how mean, how vicious, and how fake the press can be. As the cameras start going off in the background. (Laughter.)
But overall — I mean, the bottom line — somebody said, well, they couldn’t have been that bad because here we are — we’re President. And I think we’re doing a really great job with my team. I have a team of just tremendous people, and I think we’re doing a very special job. And I really believe it was time, and it was time to do that job, because I don’t think the United States would have done very well if it went through four or eight more years of regulation and, really, a very anti-business group of people.
We have a very pro-business group. We have regulations cut to a level — in the history of our country, Klaus — this was reported recently. In one year we’ve cut more regulations in my administration than any other administration in four, eight, or sixteen years, in the one case. We’ve cut more regulations in one year, and we have a ways to go. I mean, we’re probably 50 percent done.
And we’re going to have regulation. There’s nothing wrong with rules and regulations; you need them. But we’ve cut more than any administration ever in the history of our country, and we still have a ways to go. So I think between that and the tremendous tax cuts, we’ve really done something.
And one other thing I said — and I saw it last night with some of the leaders and the businesspeople — I think I’ve been a cheerleader for our country, and everybody representing a company or a country has to be a cheerleader, or no matter what you do, it’s just not going to work. And the reason I’m a cheerleader is because it’s easy — because I love our country and I think we’re just doing really well.
And we look forward to seeing you in America — special place — and where you are is a special place also.
Thank you all very much. I appreciate it. (Applause.)
MR. SCHWAB: Thank you. Thank you very much, Mr. President, for being with us.
The World Economic Forum community, who is assembled here, will be certainly — and I quote you from the last piece of your remarks — will be certainly among “the hardworking men and women who do their duty each and every day making this world a better place for everyone.”
Thank you very much for being with us.
PRESIDENT TRUMP: Thank you. Thank you very much everybody. Thank you. (Applause). END TRANSCRIPT
A billion dollars is a thousand millions. Today, as a direct result of President Trump’s MAGAnomic tax reform, Federal Express has announced they will invest an additional $3.2 BILLION in employee pay raises, bonuses and pension contributions.
Wow.
(Reuters) – Package delivery company FedEx Corp said on Friday it will spend more than $3.2 billion on wage increases, bonuses, pension funding and capital investment, taking advantage of the U.S. tax overhaul signed into law in December.
The Memphis, Tennessee-based company said it would invest $1.5 billion to significantly expand its hub in Indianapolis over the next seven years and modernize and enlarge its Memphis SuperHub.
The new tax code allows companies to immediately write off the full value of capital costs, which helps make projects more financially attractive, but that benefit starts to phase out in 2023. It also permanently lowers the U.S. corporate rate to 21 percent from 35 percent.
The announcement makes FedEx the latest U.S. company to promise higher pay for workers, citing the tax cuts.
FedEx, which said the recent tax changes would likely boost economic growth and investment in the United States, also said it would contribute $1.5 billion to an employee pension plan.
The company plans more than $200 million in higher compensation, about two-thirds of which will go to hourly employees with the remainder funding increases in performance-based incentive plans for salaried workers. (read more)
I have created this site to help people have fun in the kitchen. I write about enjoying life both in and out of my kitchen. Life is short! Make the most of it and enjoy!
This is a library of News Events not reported by the Main Stream Media documenting & connecting the dots on How the Obama Marxist Liberal agenda is destroying America