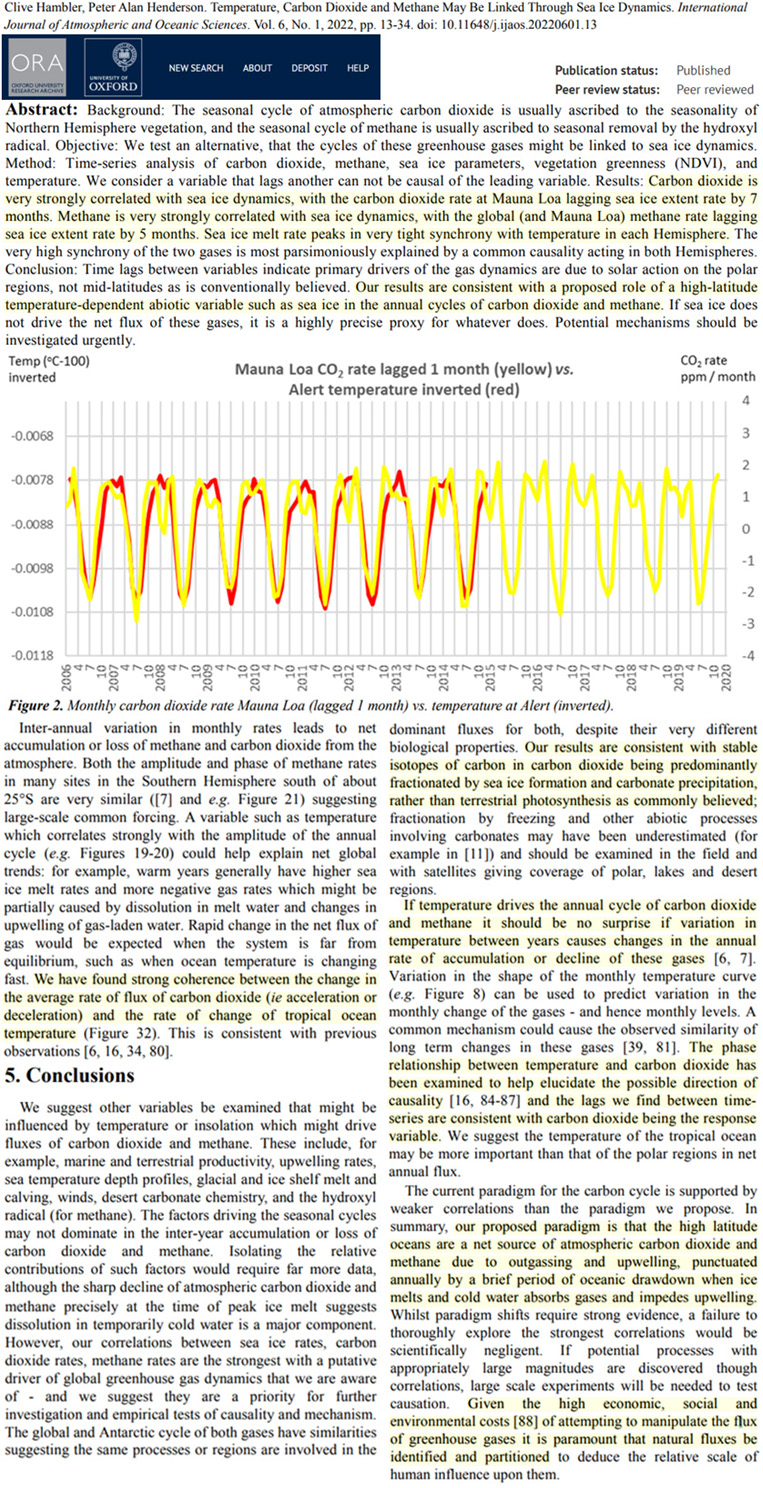
Annual carbon dioxide (CO2) and methane (CH4) change rates lag behind changes in sea ice extent by 7 months and 5 months, respectively. This robust correlation is consistent with the conclusion that CO2 (and CH4) changes are responsive to temperature, not the other way around.
It is commonly believed that the annual “squiggle” of the Mauna Loa CO2 cycle variations are driven by hemispheric seasonal contrasts in terrestrial photosynthesis.
But scientists (Hambler and Henderson, 2022) instead find it is variation high latitude temperatures affecting sea ice extent changes that dominate as drivers of the CO2 (and methane) annual fluxes, not photosynthesis.
They affirm temperature (T) changes lead CO2 change rates by about 7-10 months, suggesting the causality direction is T→CO2, and not CO2→T.
Temperature also drives sea ice peak melt vs. accumulation rates. This cause-effect directionality can also be clearly seen in analyses of sea ice flux vs. annual CO2 rate changes.
“The phase relationship between temperature and carbon dioxide has been examined to help elucidate the possible direction of causality and the lags we find between timeseries are consistent with carbon dioxide being the response variable.”
“Carbon dioxide is very strongly correlated with sea ice dynamics, with the carbon dioxide rate at Mauna Loa lagging sea ice extent rate by 7 months. Methane is very strongly correlated with sea ice dynamics, with the global (and Mauna Loa) methane rate lagging sea ice extent rate by 5 months. Sea ice melt rate peaks in very tight synchrony with temperature in each Hemisphere.”
This is one of the oldest methods to brainwash a population known to ancient history. The high priests had discovered the cycle of the heavens. They would pretend to turn the sun dark, for they managed to calculate the cycles when an eclipse would take place. They would call the people together and tell them what they will do, and they watched the moon block out the sun and believed that the high priest could control the heavens. Today, astrology really comes from the Babylonians who conducted a massive correlation study to predict the future.
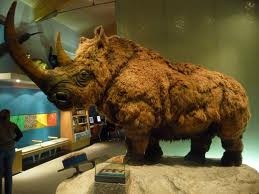
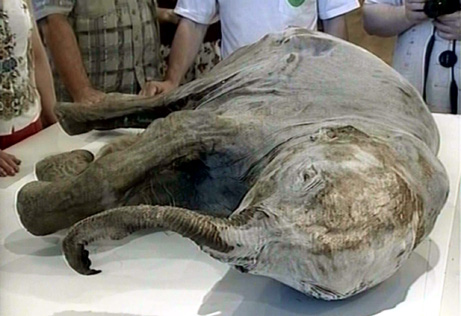
There is a cycle to everything. The climate ALWAYS changes, and there are warming periods and cooling periods. These charlatans are no different than the Babylonian high priests pretending to block the sun with the moon on their command. Science was turned on its head after a discovery in 1772 near Vilui, Siberia, of an intact frozen woolly rhinoceros, which was followed by the more famous discovery of a frozen mammoth in 1787. You may be shocked, but these discoveries of frozen animals with grass still in their stomachs set in motion these two schools of thought since the evidence implied you could be eating lunch and suddenly find yourself frozen, only to be discovered by posterity.
The discovery of the woolly rhinoceros in 1772, and then frozen mammoths, sparked the imagination that things were not linear after all. These major discoveries truly contributed to the Age of Enlightenment, where there was a burst of knowledge erupting in every field of inquisition. Such finds of frozen mammoths in Siberia continue to this day. This has challenged theories on both sides of this debate to explain such catastrophic events. These frozen animals in Siberia suggest strange events are possible even in climates that are not that dissimilar from the casts of dead victims who were buried alive after the volcanic eruption of 79 AD at Pompeii in ancient Roman Italy. Animals can be grazing and then freeze abruptly. Climate change has been around for billions of years — long before man invented the combustion engine.
Even the field of geology began to create great debates that perhaps the earth simply burst into a catastrophic convulsion and, indeed, the planet was cyclical — not linear. This view of sequential destructive upheavals at irregular intervals or cycles emerged during the 1700s. This school of thought was perhaps best expressed by a forgotten contributor to the knowledge of mankind, George Hoggart Toulmin, in his rare 1785 book, “The Eternity of the World”:
” ••• convulsions and revolutions violent beyond our experience or conception, yet unequal to the destruction of the globe, or the whole of the human species, have both existed and will again exist ••• [terminating] ••• an astonishing succession of ages.”
Id./p3, 110
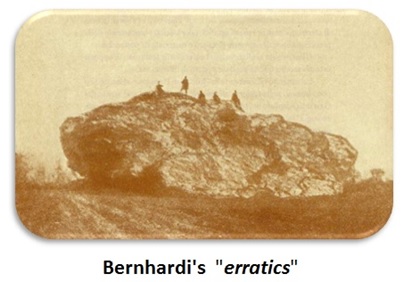
In 1832, Professor A. Bernhardi argued that the North Polar ice cap had extended into the plains of Germany. To support this theory, he pointed to the existence of huge boulders that have become known as “erratics,” which he suggested were pushed by the advancing ice. This was a shocking theory, for it was certainly a nonlinear view of natural history. Bernhardi was thinking out of the box. However, in natural science, people listen and review theories, unlike in social science, where theories are ignored if they challenge what people want to believe. In 1834, Johann von Charpentier (1786-1855) argued that there were deep grooves cut into the Alpine rock concluding, as did Karl Schimper, that they were caused by an advancing Ice Age.
This body of knowledge has been completely ignored by the global warming/climate change religious cult. They know nothing about nature or cycles, and they are completely ignorant of history or even that it was the discovery of these ancient creatures who froze with food in their mouths. They cannot explain these events nor the vast amount of knowledge written by people who actually did research instead of trying to cloak an agenda in pretend science.
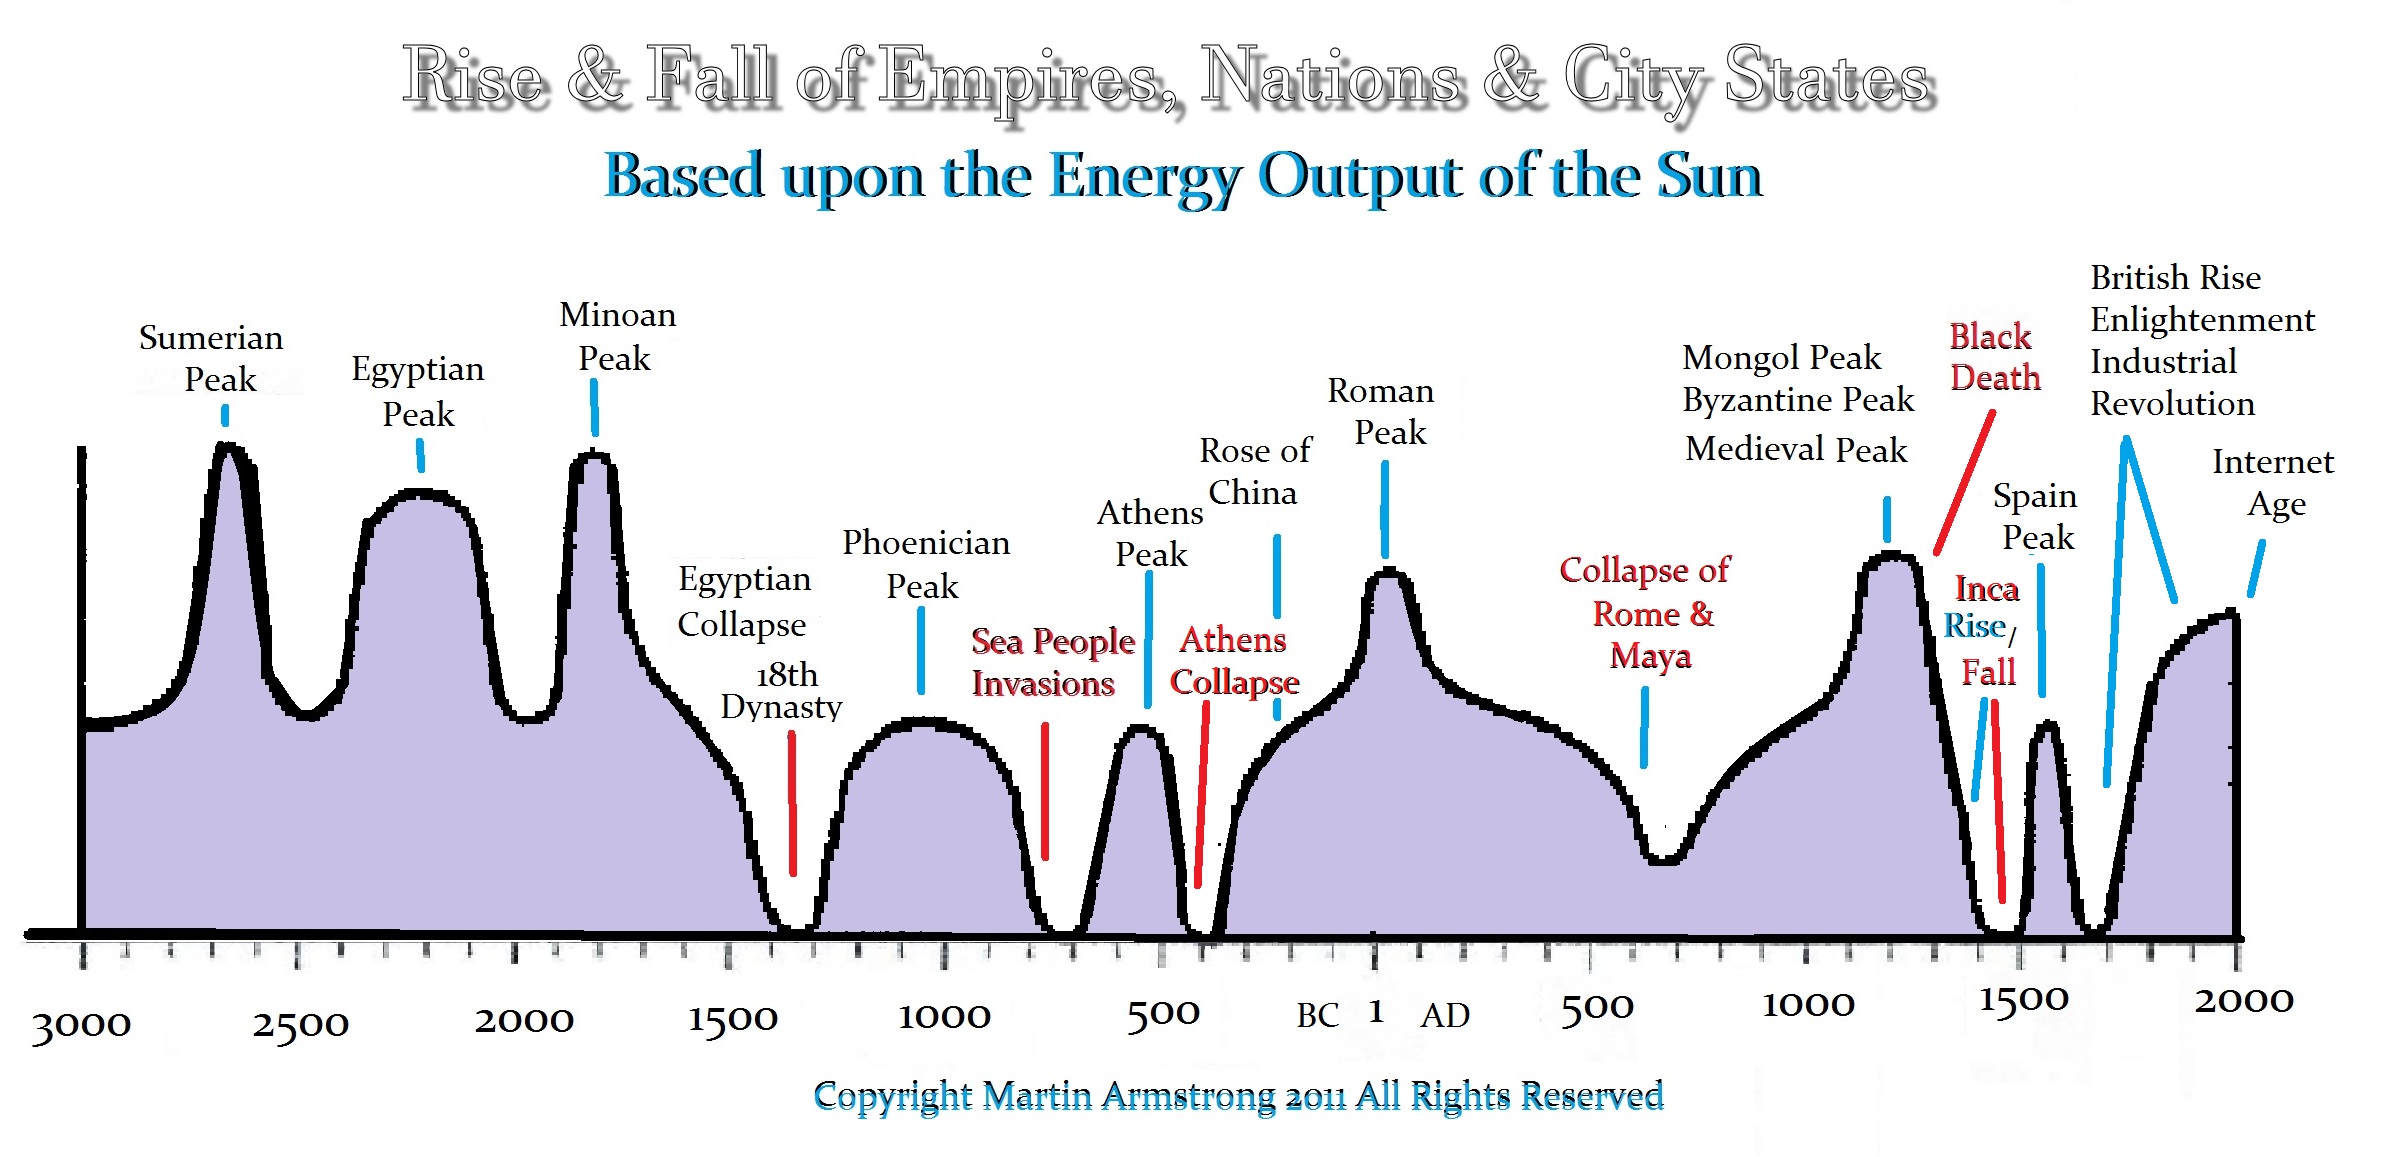
Our model has projected we are entering another “grand minimum,” which will overtake the sun beginning in 2020 and will last through the 2050s, resulting in diminished magnetism, infrequent sunspot production, and less ultraviolet (UV) radiation reaching Earth. This all means we are facing a global cooling period on the planet that may span 31 to 43 years. The last grand-minimum event produced the mini-Ice Age in the mid-17th century. Known as the Maunder Minimum, it occurred between 1645 and 1715, during a longer span of time when parts of the world became so cold that the period was called the Little Ice Age, which lasted from about 1300 to 1850.
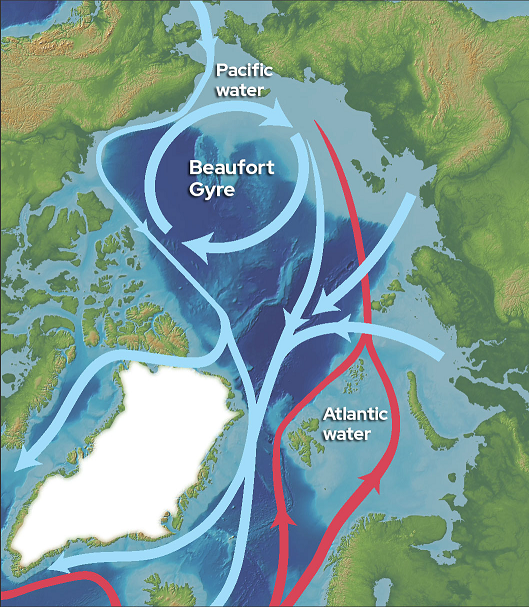
Most people have NEVER heard of the Beaufort Gyre, a massive wind-driven current in the Arctic Ocean that actually has far more influence over sea ice than anything we can throw into the atmosphere. The Beaufort Gyre has been regulating climate and sea ice formation for millennia. Recently, however, something has changed; it is not something that would create global warming but threatens a new Ice Age.
There is a normal cycle that appears to be about 5.4 years, where it reverses direction and spins counter-clockwise, expelling ice and freshwater into the eastern Arctic Ocean and the North Atlantic. The 5.4-year cycle is interesting for it is two pi cycle intervals of 8.6. The immediate cycle has suddenly expanded to two 8.6-year intervals, bringing it to 17.2 years as we head into 2022.
What you must understand is that this Beaufort Gyre now holds as much freshwater as all of the Great Lakes combined. Why is that important? Saltwater freezes at a lower temperature than the 32 degrees F at which freshwater freezes. The difference between the air temperature and the freezing point of saltwater is bigger than the difference between the air temperature and the freezing point of fresh water. This makes the ice with salt on it melt faster, which is why we salt the roads in an ice storm.
Now, think of the Beaufort Gyre as a carousel of ice and freshwater. Because it is now spinning both faster and in its usual clockwise direction, it has been collecting more and more freshwater from the three main sources:
Melting sea ice
Runoff from the Arctic Ocean from Russian and North American rivers
Lower saltwater coming in from the Bering Sea
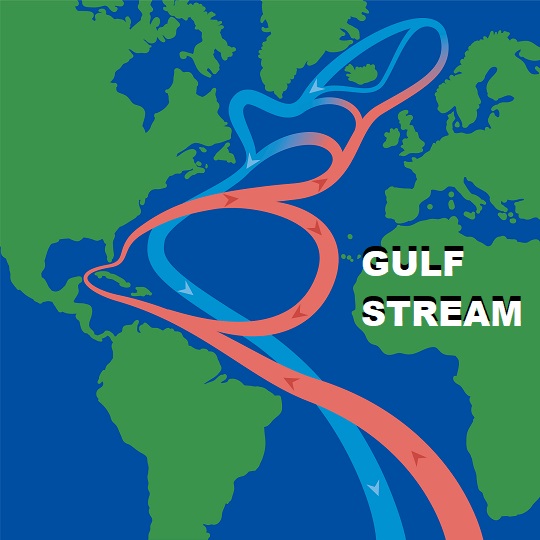
Indeed, Yale has warned that this current could “Cool the Climate in Europe,” which is precisely what we are witnessing. Cyclically, the Beaufort Gyre will reverse direction, and when it does, the clear and present danger will be the natural expulsion of a massive amount of icy fresh water into the North Atlantic. Remember now, freshwater freezes faster than saltwater.
This is not a theory. We have previous records of reversals in this cycle of the Beaufort Gyre from the 1960s and 1970s, where there was a surge of fresh Arctic water released into the North Atlantic that resulted in the water freezing. There has been a lot of work done on this subject, which, of course, is ignored by the climate change agenda that only seeks to blame human activity. Nevertheless, AAAS, of which I am a member, states plainly:
“Arctic sea ice affects climate on seasonal to decadal time scales, and models suggest that sea ice is essential for longer anomalies such as the Little Ice Age.”
Socrates has been given just about every possible database I could find over the past 50 years. Because of the extended 17.2-year cycle in the Beaufort Gyre, the risk that a larger-than-normal expulsion of freshwater into the Atlantic can disrupt the Gulf Stream, which is the sole reason why Europe has been moderate in climate. But that has NOT always been the case. We know that the Barbarian invasions into Rome during the 3rd century were primarily driven by a colder climate in the north. The invasion of the Sea Peoples ended the Bronze Age, and those from the north migrated into the South, storming Mesopotamia and Northern Africa.
CLIMATE CHANGE IS REAL…
It is just not created by humans.
Perhaps we are now at the tipping point, and they cannot keep saying that the extremely cold winter is also caused by CO2 and global warming. The collapse of the gulf stream has nothing to do with CO2. This may result in a major confrontation that these people have been seriously wrong and what they are doing to the economy in trying to shut down fossil fuels at this point in time could result in tens of millions of deaths if the gulf stream collapses.
COMMENT: Dear Mr. Armstrong, As always, thank you so much for your incredible insight to what is happening in the world. You are the first news source I read in the morning because I know your site is always two steps ahead of everyone else! I wished to ask you about something you often reference: that many of these globalists are trying to destroy fossil fuels for “climate change”.
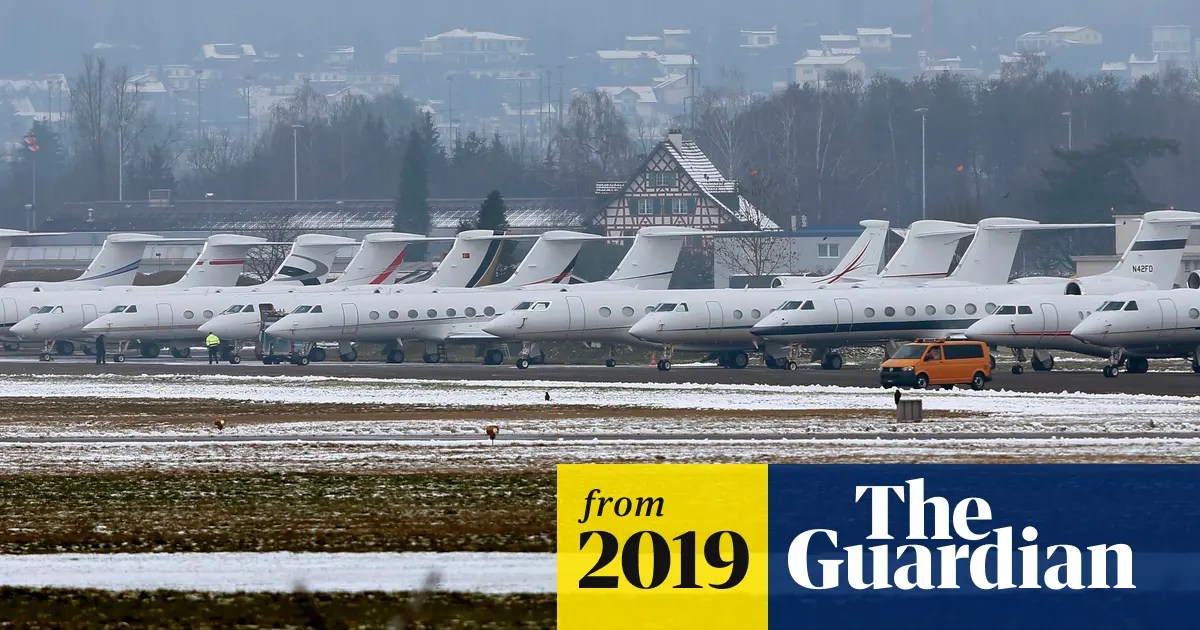
However, going by their actual behavior, it seems that they don’t *genuinely* believe in climate change, otherwise they wouldn’t be flying around in private jets, owning ocean-front property, or creating more carbon emissions than many small countries. Do you think they actually believe the earth is in danger or are they trying to force the majority of humanity back into a third world state because without the ability to travel, or heat/cool homes, communicate with one another, or have access to clean water, meat and nutritious food, etc., we not only will lose much of the population to sickness and starvation, but those who are left would become much more dependent on the state (them) and therefore easier to control?
Depopulation and crushing humanity into a smaller, weaker, more controllable feudal-system peasantry seems more like the actual reason for destroying fossil fuels, food security, and private ownership, with “climate change” merely being their flimsy excuse to do so. Do you think any of those pulling the strings on all this really believes what they’re saying about climate change?
ED
REPLY: The elite could care less about climate change. They know it is laughable. Even John McCain was pushing it only because it was to hurt Russia cutting off its resources and he was pushing nuclear energy to replace fossil fuels only as a strategic chess move against Russia – his eternal enemy.
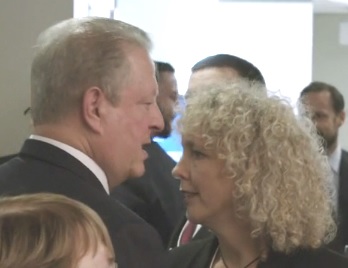
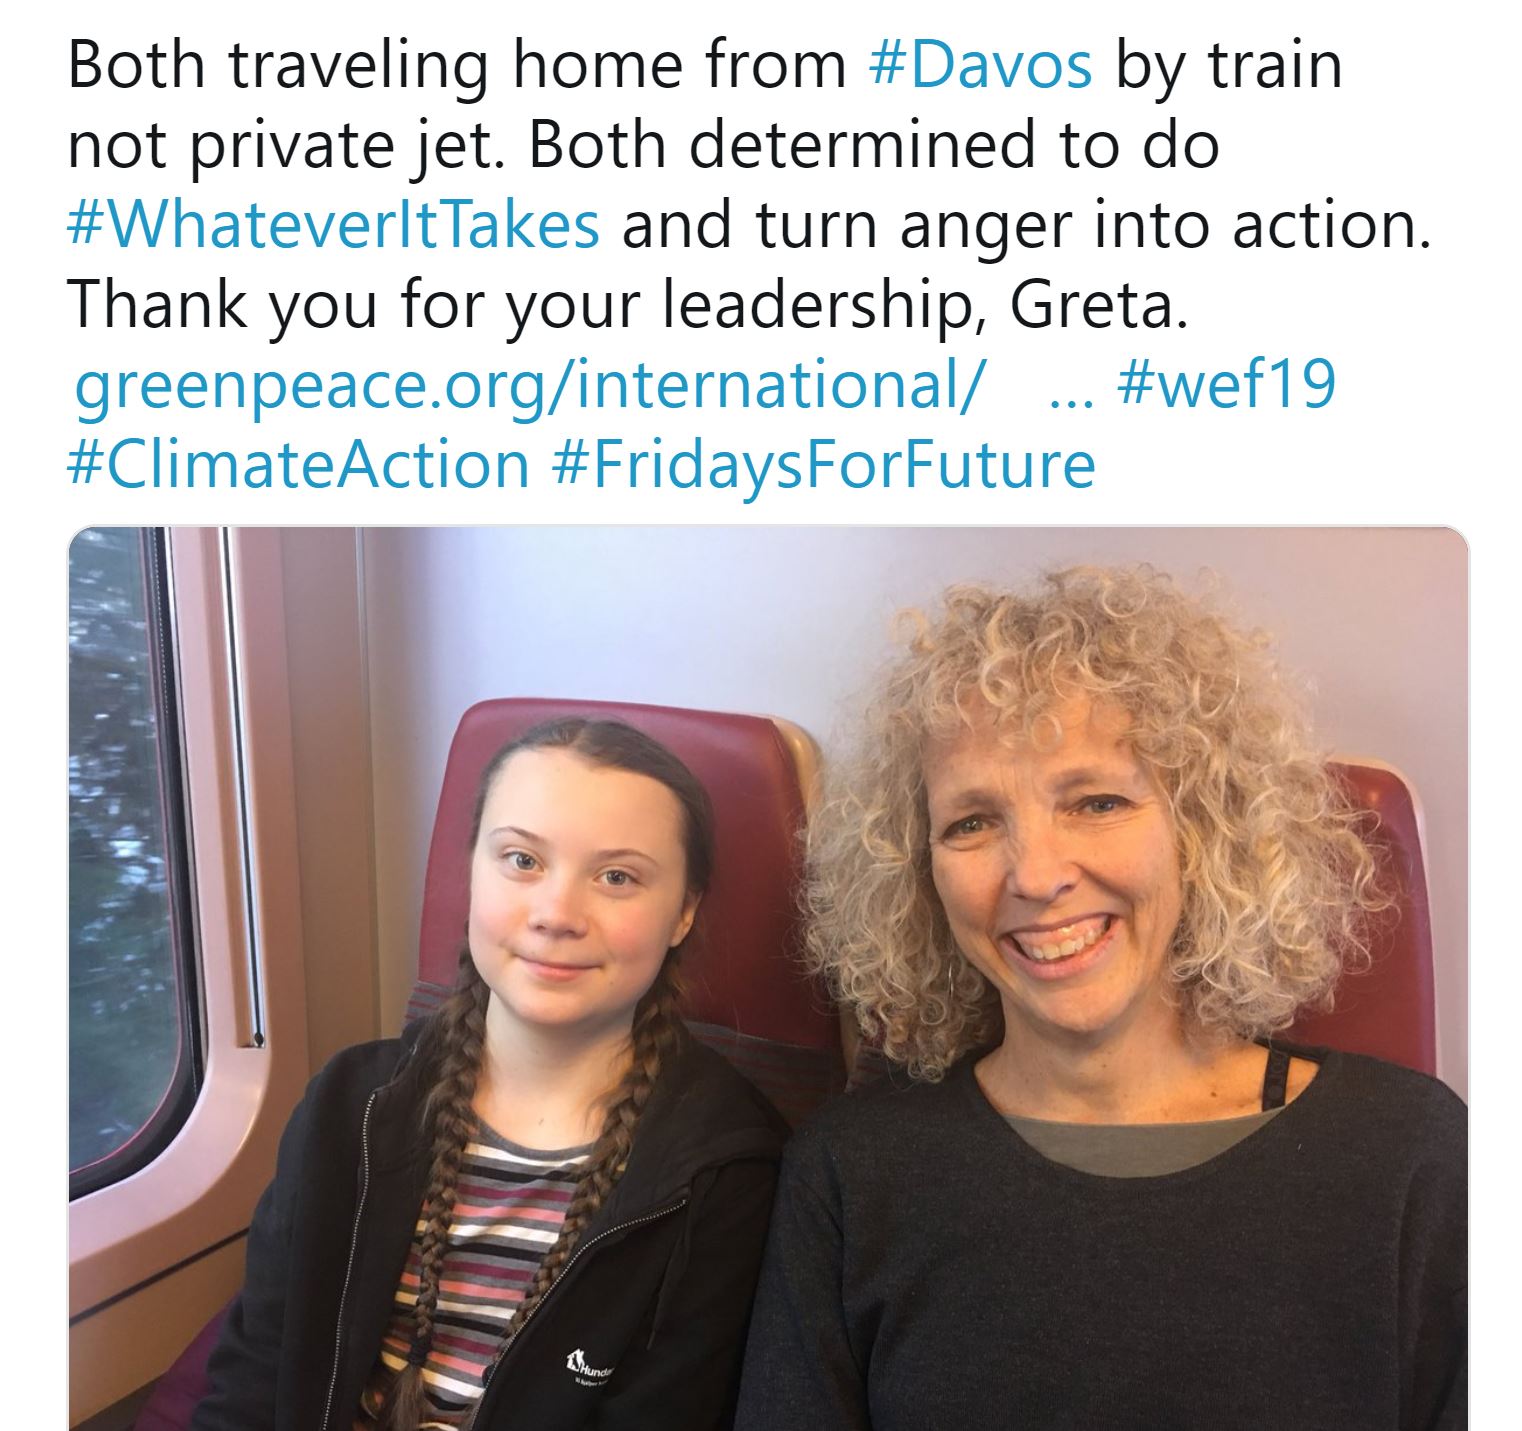
These ELITE people do not care about the climate. They all travel to Davos in private jets. Al Gore and UN Secretary-General Antonio Guterres at Davos in 2019 told delegates that humanity is “losing the race” against climate change. Al Gore conspires with Greenpeace and used Greta for their publicity stunts. I would say he is a believer, but do not count on his intelligence. He has never questioned the limited data.
The Elite have used climate change as the spearhead for the Great Reset, which is all about coming up with propaganda to cover up the Sovereign Debt default. Trust me. Many at the top are laughing their ass off at how they have sold this nonsense to people who just eat it up. John McCain was preaching nuclear energy back in the 2008 election to end dependency on foreign oil purely for military purposes – not the environment. They have brainwashed many and they just repeat the nonsense without the slightest investigation on their own. Oh, there is a drought, and skeletons are now revealed in Hoover Dam so that is proof of climate change! But they fail to take the next step and ask if that has that taken place before. There are natural cycles to climate so it always changes.
The Elite used Greta, and once they managed to get the press selling their BS and believing this changed the planet, they discarded her. They use people to achieve their goals and that is all this war is really about. To destroy the economy of Russia. Occupy the country and end fossil fuels so that Russia will be reduced to a vassal state. They have not probably reduced the population by 50% ANYHOW. The real powers do not care about Climate Change. They know this is all nonsense.
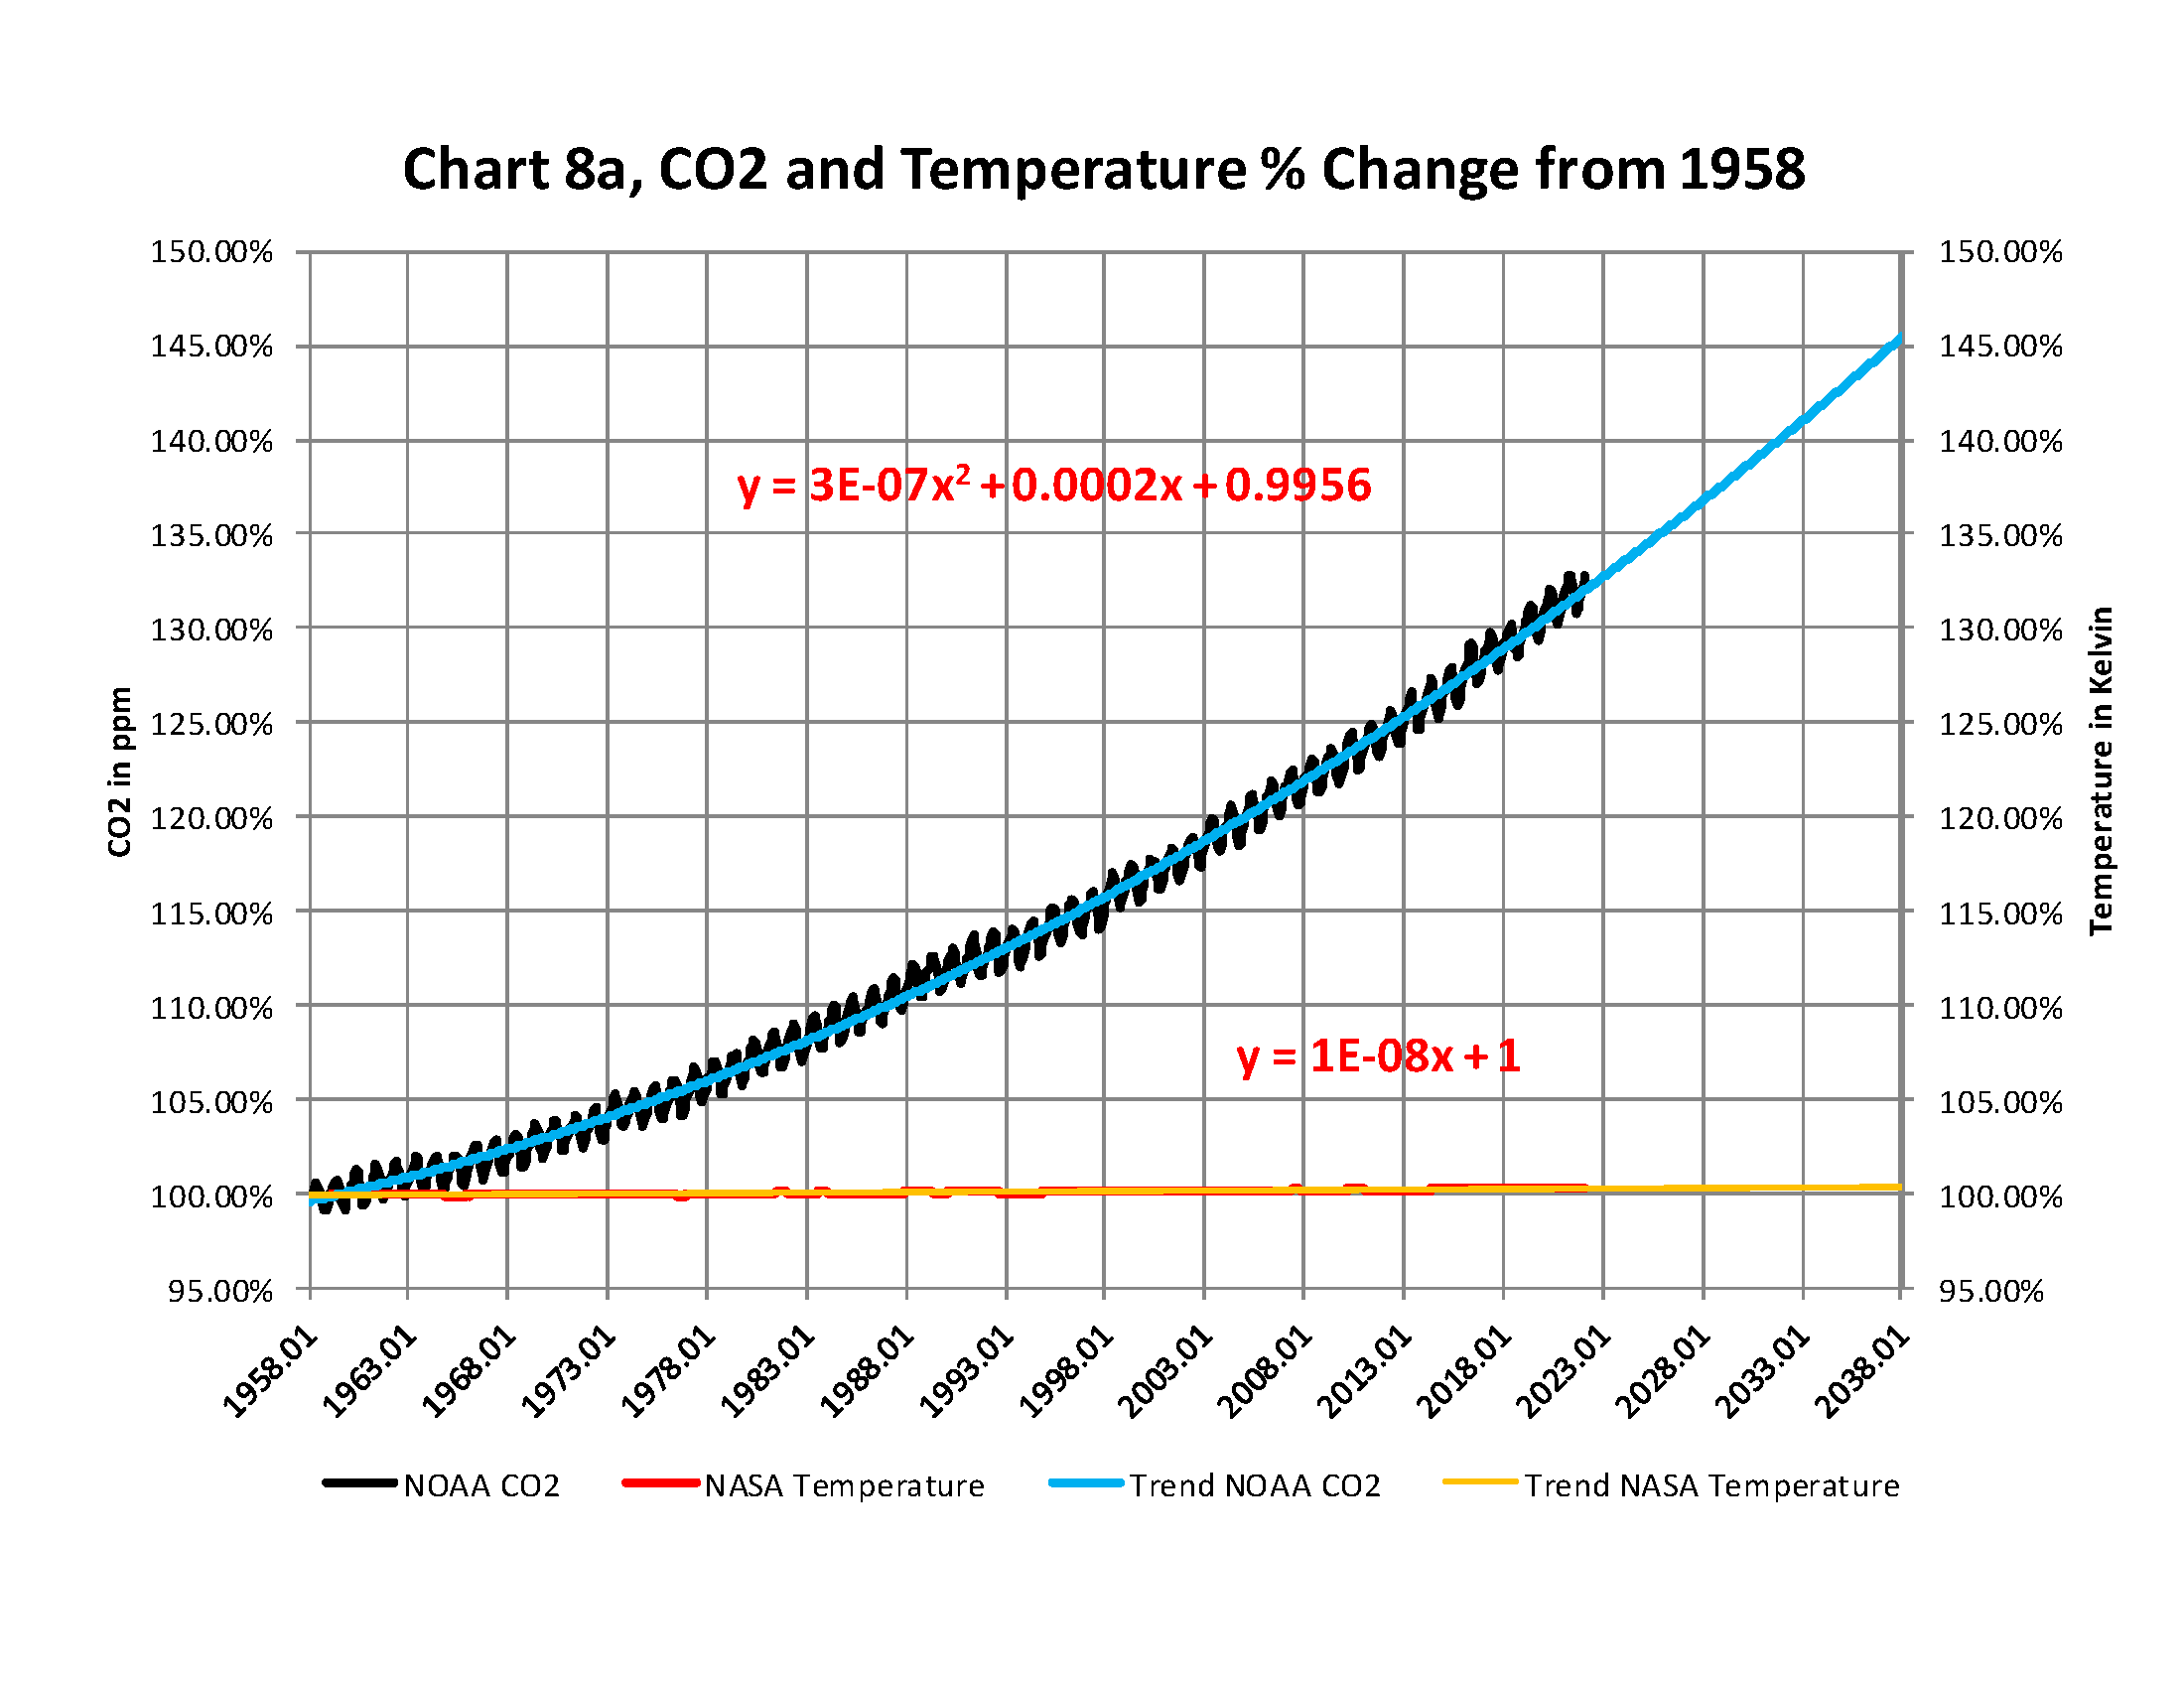
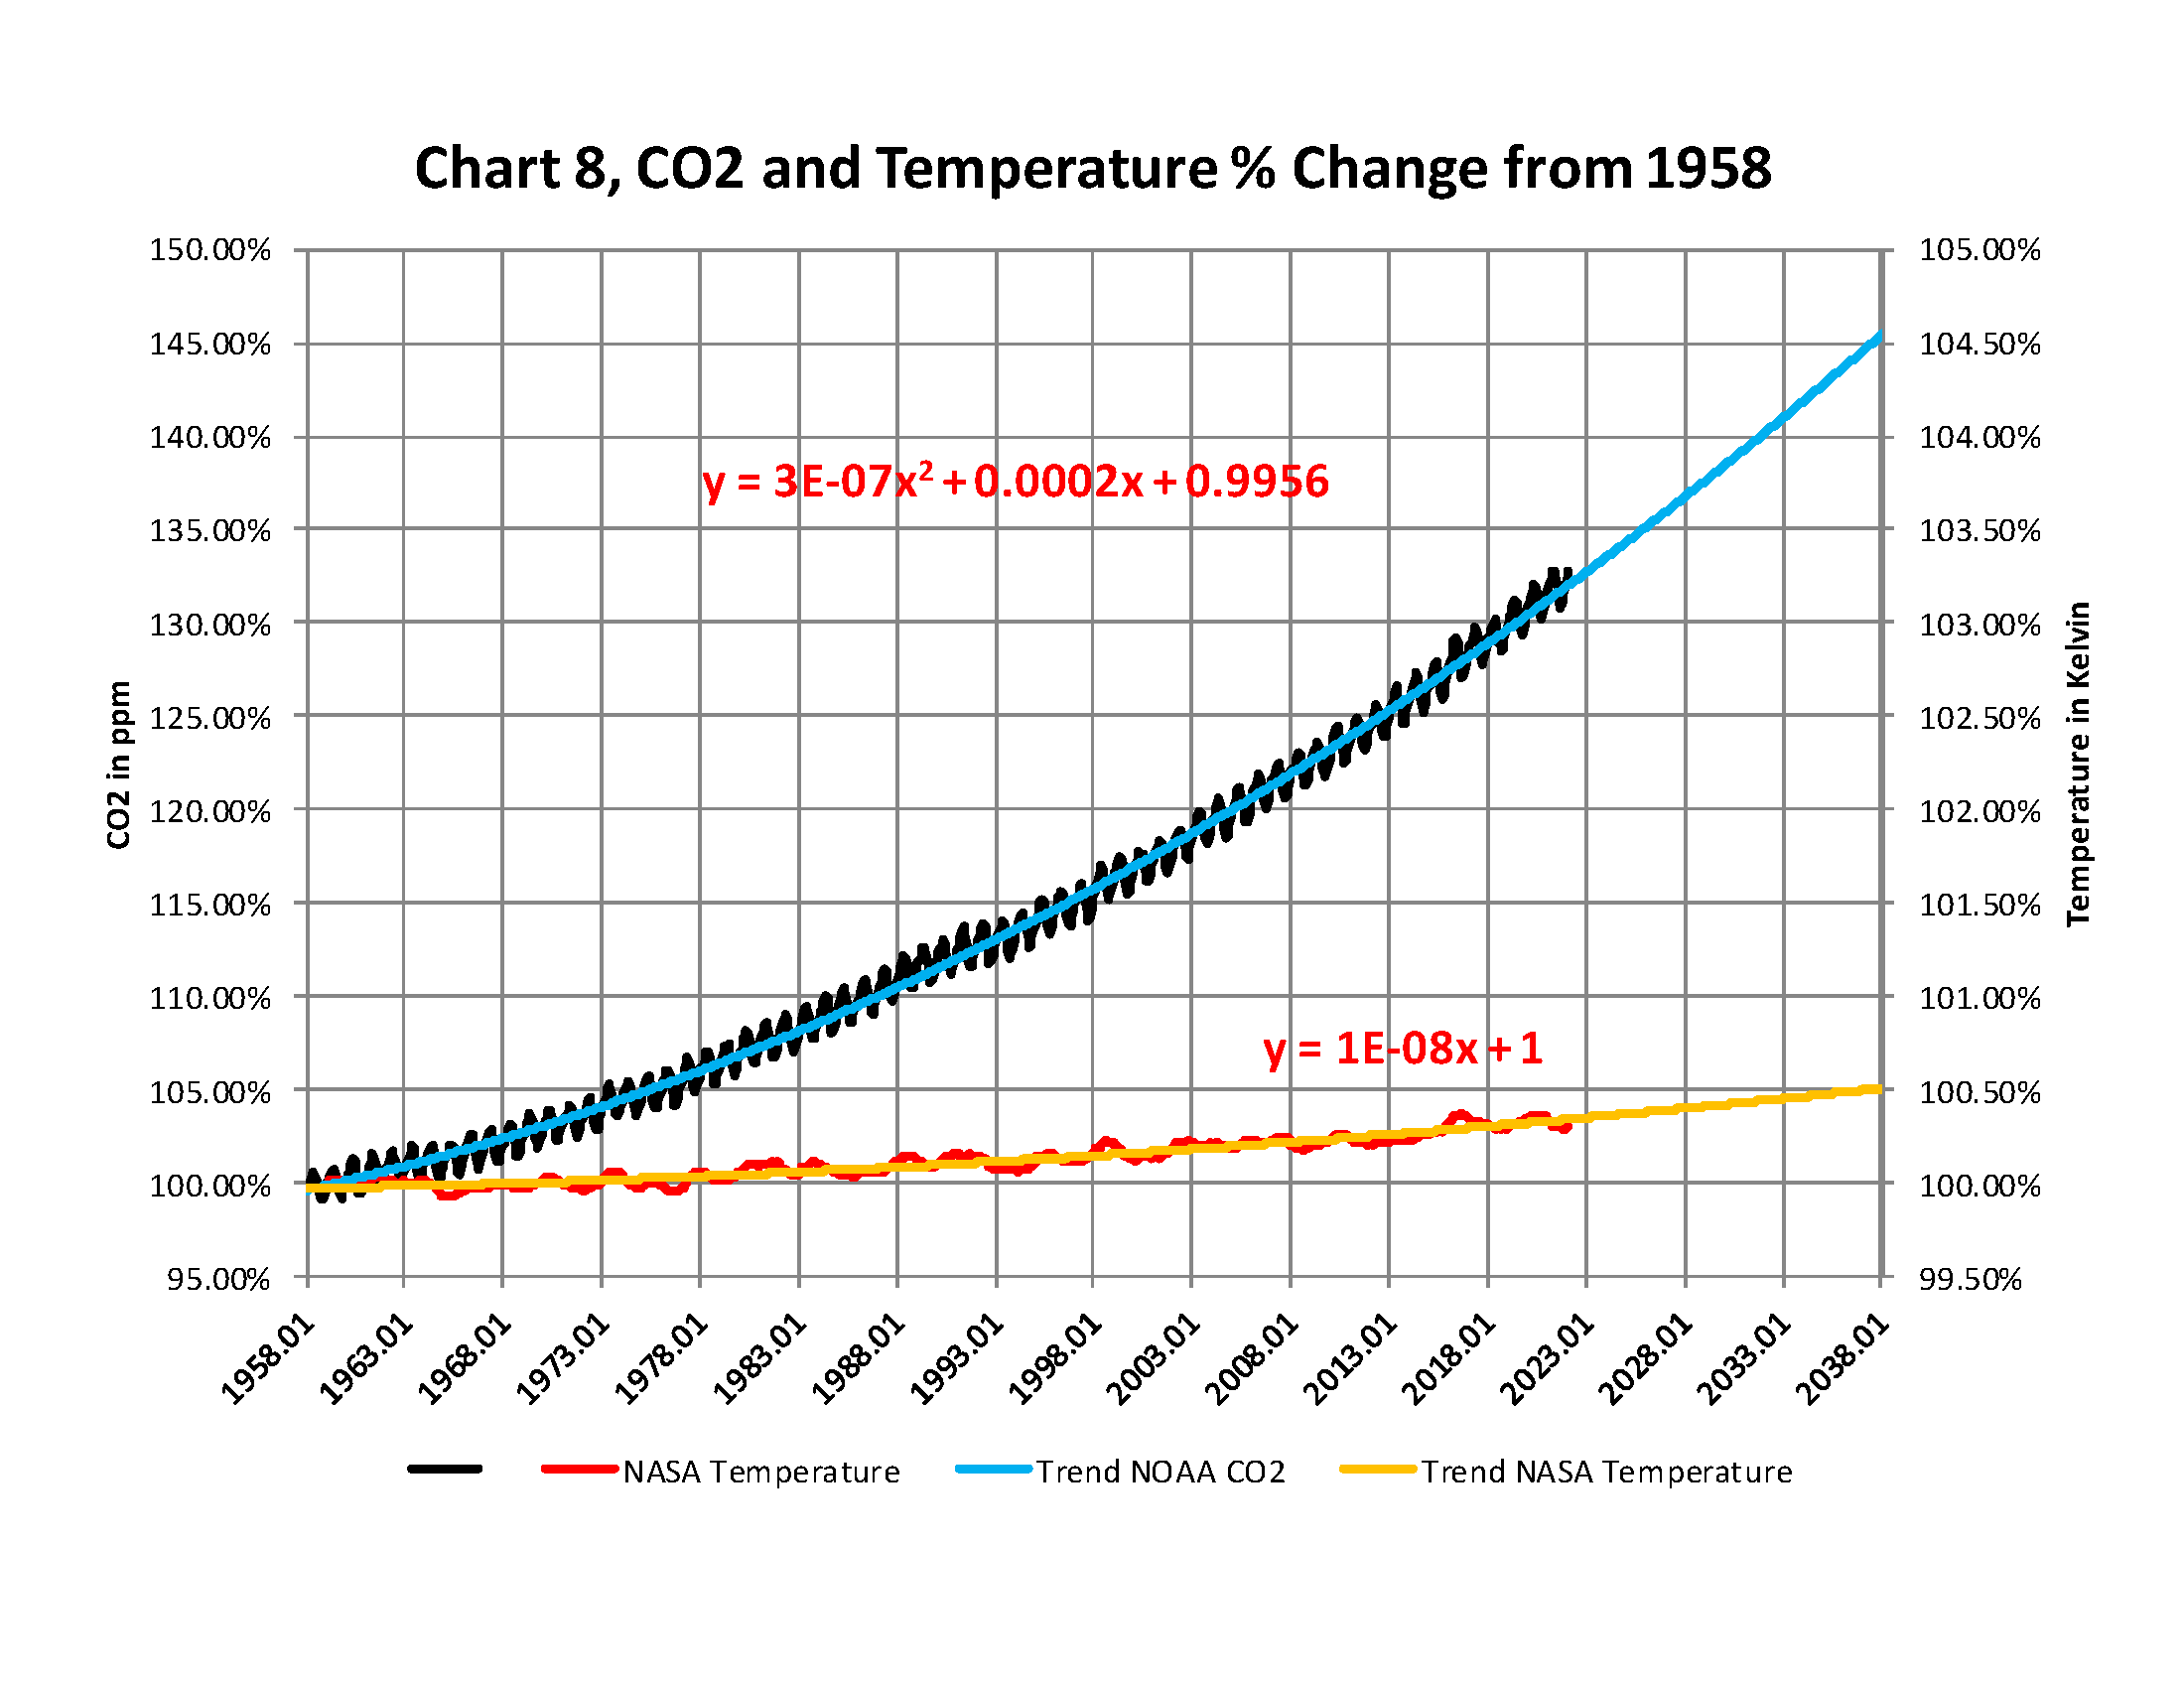
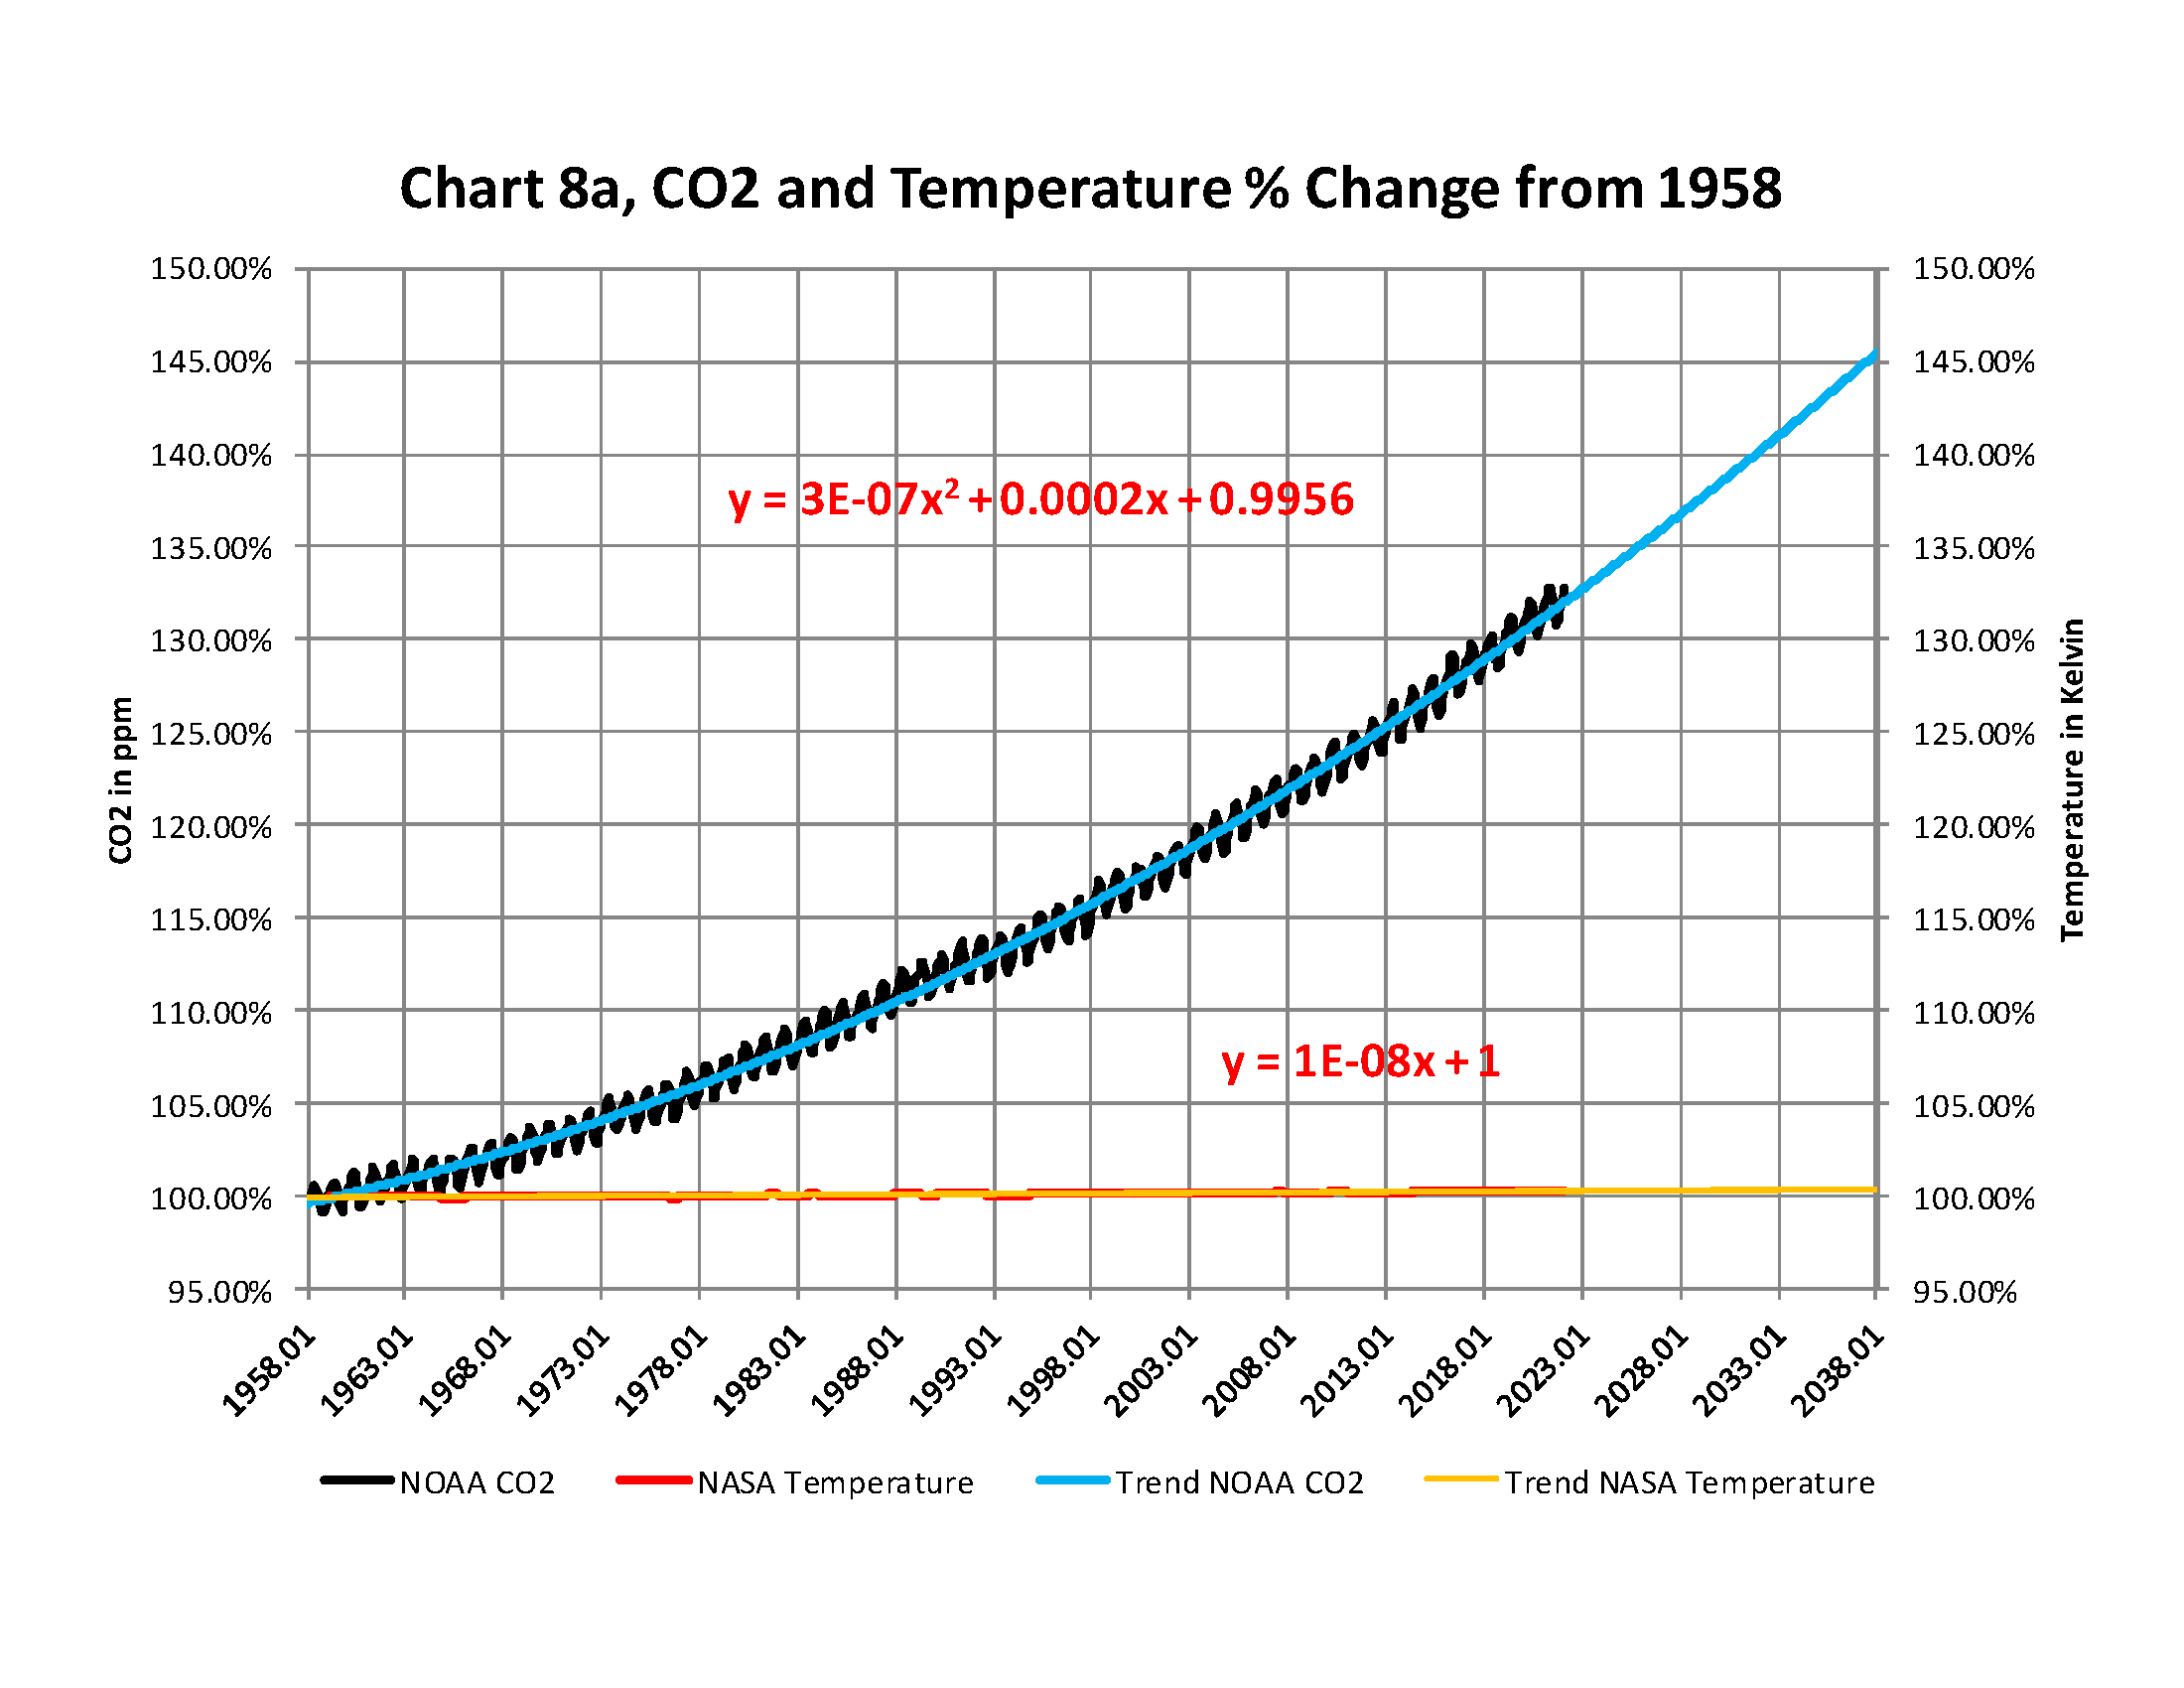
From the attached report on climate change for September 2022Data we have the two charts showing how much the global temperature has actually gone up since we started to measure CO2 in the atmosphere in 1958? To show this graphically Chart 8a was constructed by plotting CO2 as a percent increase from when it was first measured in 1958, the Black plot, the scale is on the left and it shows CO2 going up by about 32.4% from 1958 to September of 2022. That is a very large change as anyone would have to agree. Now how about temperature, well when we look at the percentage change in temperature also from 1958, using Kelvin (which does measure the change in heat), we find that the changes in global temperature (heat) is almost un-measurable at only .4%.
As you see the increase in energy, heat, is not visually observably in this chart hence the need for another Chart 8 to show the minuscule increase in thermal energy shown by NASA in relationship to the change in CO2 Shown in the next Chart using a different scale.
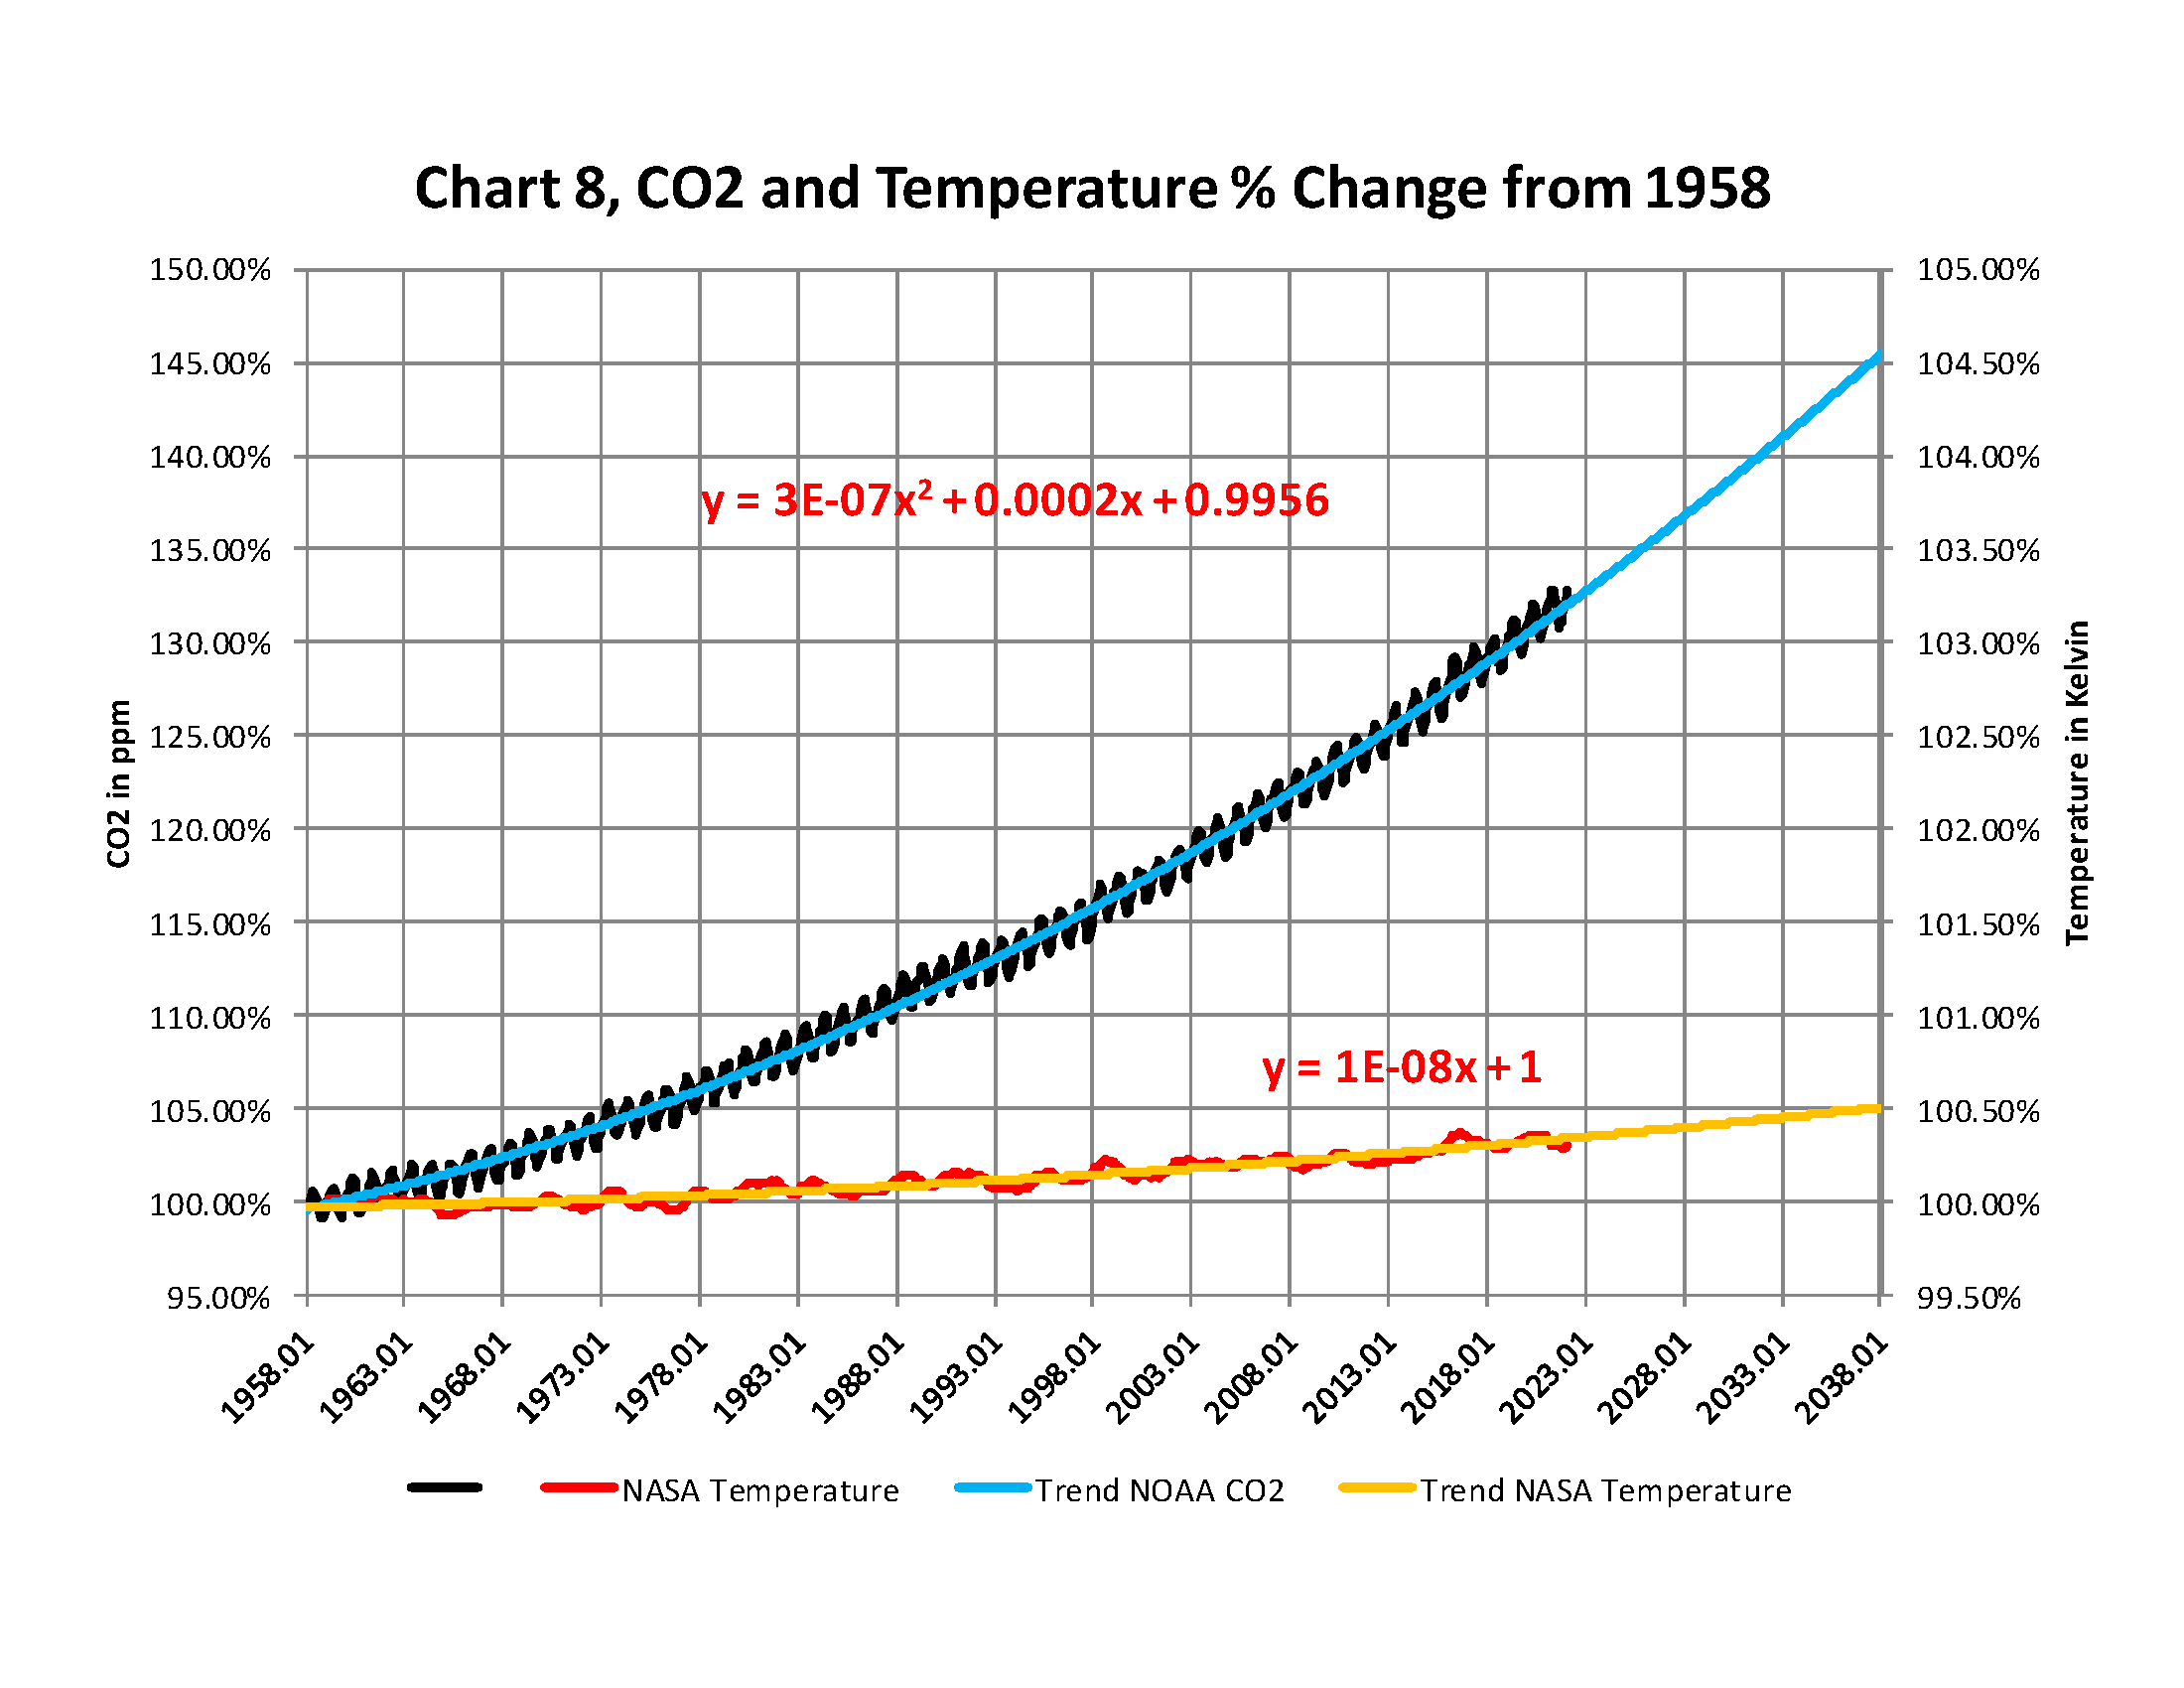
This is Chart 8 which is the same as Chart 8a except for the scales. The scale on the right side had to be expanded 10 times (the range is 50 % on the left and 5% on the right) to be able to see the plot in the same chart in any detail. The red plot, starting in 1958, shows that the thermal energy in the earth’s atmosphere increased by .40%; while CO2 has increased by 32.4% which is 80 times that of the increase in temperature. So is there really a meaningful link between them that would give as a major problem?
Based to these trends, determined by excel not me, in 2028 CO2 will be 428 ppm and temperatures will be a bit over 15.0o Celsius and in 2038 CO2 will be 458 ppm and temperatures will be 15.6O Celsius.
The NOAA and NASA numbers tell us the True story of the
Changes in the planets Atmosphere
The full 40 page report explains how these charts were developed .
Hope we can all laugh again after this coming winter is in the rearview mirror…
The Indians on the Aamjiwnaang First Nation reservation in Grand Bend asked their new chief if the coming winter was going to be cold or mild.
Since he was a chief in a modern society, he had never been taught the old secrets. When he looked at the sky, he couldn’t tell what the winter was going to be like.
Nevertheless, to be on the safe side, he told his tribe that the winter was indeed going to be cold and that the members of the village should collect firewood to be prepared.
But, being a practical leader, after several days, he got an idea. He went to the phone booth, called the Canadian Weather Service and asked, ‘Is the coming winter going to be cold?’ ‘It looks like this winter is going to be quite cold,’ the meteorologist at the weather service responded.
So the chief went back to his people and told them to collect even more firewood in order to be prepared.
A week later, he called the Canadian Weather Service again. ‘Does it still look like it is going to be a very cold winter?’
‘Yes,’ the man at Weather Service again replied, ‘it’s going to be a very cold winter.’
The chief again went back to his people and ordered them to collect every scrap of firewood they could find.
Two weeks later, the chief called the Canadian Weather Service again. ‘Are you absolutely sure that the winter is going to be very cold?’
‘Absolutely,’ the man replied. ‘It’s looking more and more like it is going to be one of the coldest winters we’ve ever seen.’
‘How can you be so sure?’ the chief asked.
The weatherman replied, ‘The Indians are collecting an astounding amount of firewood !’
From the attached report on climate change for August 2022Data we have the two charts showing how much the global temperature has actually gone up since we started to measure CO2 in the atmosphere in 1958? To show this graphically Chart 8a was constructed by plotting CO2 as a percent increase from when it was first measured in 1958, the Black plot, the scale is on the left and it shows CO2 going up by about 32.0% from 1958 to August of 2022. That is a very large change as anyone would have to agree. Now how about temperature, well when we look at the percentage change in temperature also from 1958, using Kelvin (which does measure the change in heat), we find that the changes in global temperature (heat) is almost un-measurable at only .4%.
As you see the increase in energy, heat, is not visually observably in this chart hence the need for another Chart 8 to show the minuscule increase in thermal energy shown by NASA in relationship to the change in CO2 Shown in the next Chart using a different scale.
This is Chart 8 which is the same as Chart 8a except for the scales. The scale on the right side had to be expanded 10 times (the range is 50 % on the left and 5% on the right) to be able to see the plot in the same chart in any detail. The red plot, starting in 1958, shows that the thermal energy in the earth’s atmosphere increased by .40%; while CO2 has increased by 32.0% which is 80 times that of the increase in temperature. So is there really a meaningful link between them that would give as a major problem?
Based to these trends, determined by excel not me, in 2028 CO2 will be 428 ppm and temperatures will be a bit over 15.0o Celsius and in 2038 CO2 will be 458 ppm and temperatures will be 15.6O Celsius.
The NOAA and NASA numbers tell us the True story of the
Changes in the planets Atmosphere
The full 40 page report explains how these charts were developed .
My question is related to a gentleman I watched on Greg Hunters Watchdog News that Martin goes on with from time to time. Greg interviewed —- —–. The discussion was around chemtrails and the gov’t messing with the rain patterns, also lake Mead and the Las Vegas drain plug which I do know is real. The main question is there a real likely hood of the S.W. United States to experience very serious drought in short order? I live in Phoenix and this interview was scary and I would be curious to know (along with millions of others) if Dane’s information is credible and if folks living in the S.W. US should really consider trying to move to another part of the country. I wondered if Socrates would be able to give us any insight into what was discussed in the interview.
Thank you so much for your efforts, I have been following Martin since 2008 and I have yet to see Socrates be wrong. We need your efforts more than ever with the complete disaster of the world we are living in.
Regards. DGB
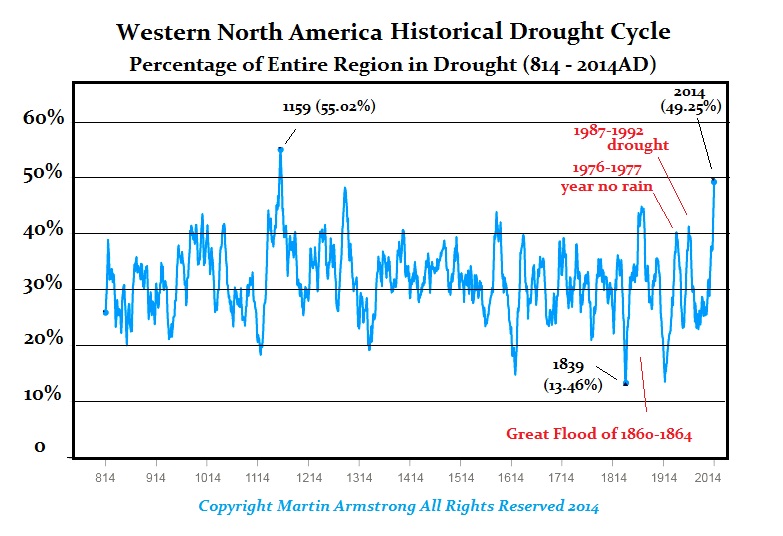
ANSWER: I have no data on the chemtrail issue. My opinion would neither add nor detract from the subject. I prefer not to comment on things I have no experience in or information I cannot confirm. What I can say, rooted entirely in our database on weather, is that like stock markets or economies, there are cycles to droughts and will tend to last for 37 months. Curiously, this is also fractal being 8.6 x 4.3. Even during the 1930s drought episode that produced the Dust Bowl, the average longest stretch was also 37 months, peaking in March 1935.
There was a cycle inversion that took place during the 1950s, which caused a 19-year extension bringing the average drought to the longest stretch of 56 months, peaking in February 1957. While that drought was longer, it was not as intense as that of the 1930s Dust Bowl. The typical short-term events are reactions, and they are typically maxed out at three months.
That said, I can only look at the data. I do not see any alternation to the cycles insofar as altering their length. If the proposition of the chemtrail argument is valid, then I would assume from the data that, at the very best, it could possibly impact the “volatility” as we experience in a market that changes the intensity.
However, as of June 19, 2022, 51.87% of the lower 48 states are in a drought. We have not yet exceeded the high of 1159 AD. So much for fossil fuels creating global warming.
Posted originally on the conservative tree house on May 23, 2022 | sundance
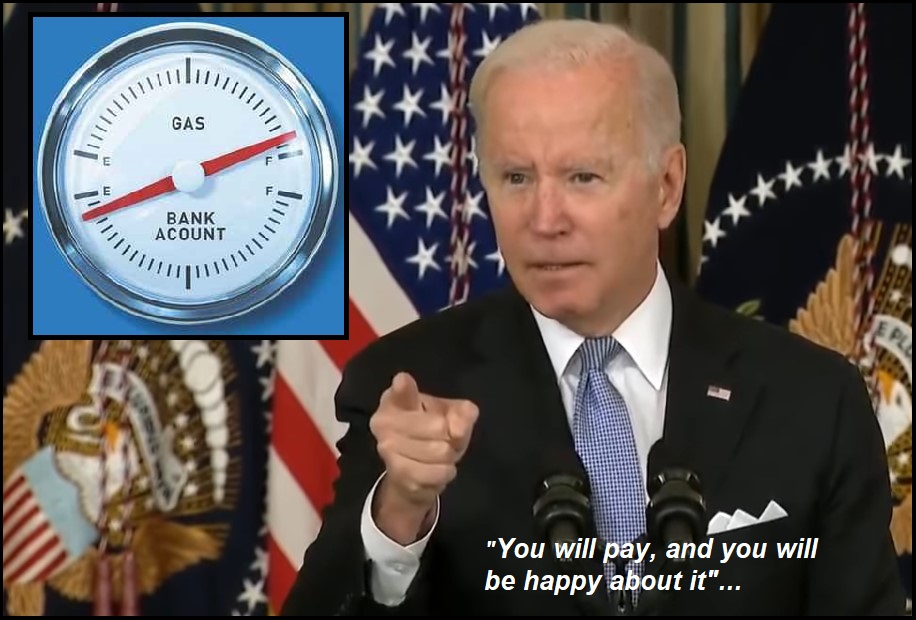
During a joint press conference held in Tokyo, Japan, held by Joe Biden and Prime Minister Fumio Kishida, Biden was asked about the financial pain Americans are feeling with massive increases in gasoline prices.
Outlining how his energy policy is directly related to the gasoline price, Joe Biden said: “Here’s the situation. And when it comes to the gas prices, we’re going through an incredible transition that is taking place that, God willing, when it’s over, we’ll be stronger and the world will be stronger and less reliant on fossil fuels when this is over.” Yet again proving the intent of the administration is to implement the ‘Green New Deal’ through executive action. WATCH:
.
This admission is akin to former President Obama saying, “energy prices would necessarily skyrocket” in order to achieve the goals of the administration.
I have created this site to help people have fun in the kitchen. I write about enjoying life both in and out of my kitchen. Life is short! Make the most of it and enjoy!
This is a library of News Events not reported by the Main Stream Media documenting & connecting the dots on How the Obama Marxist Liberal agenda is destroying America