Trying to Make Heads or Tails about Recessions


Armstrong Economics Blog/Economics Re-Posted Jul 28, 2023 by Martin Armstrong

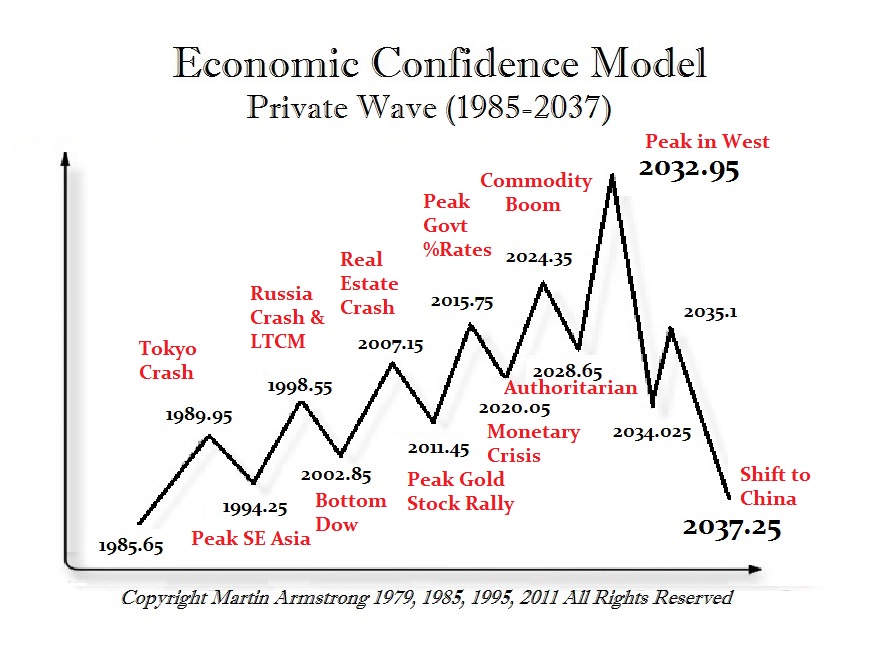
QUESTION: Looking at Socrates,  do you think that these people who were constantly calling for a recession because there were two quarters that declined with covid really need revision? Socrates was correct, no recession. But it is showing major turning points in 2024 which seem to align with your old ECM forecast calling for commodity inflation into 2024. How would you define a recession?

EJ

ANSWER: In trading, reactions are 1 to 3 time units. I believe that the same definition should be used for classifying a recession. They define a recession as two consecutive quarterly declines. If you look at the “Great Recession” of 2008-2009, you will see three consecutive quarterly declines and a rebound. If we look at the COVID recession caused by locking everyone down, that was just two consecutive quarterly declines.

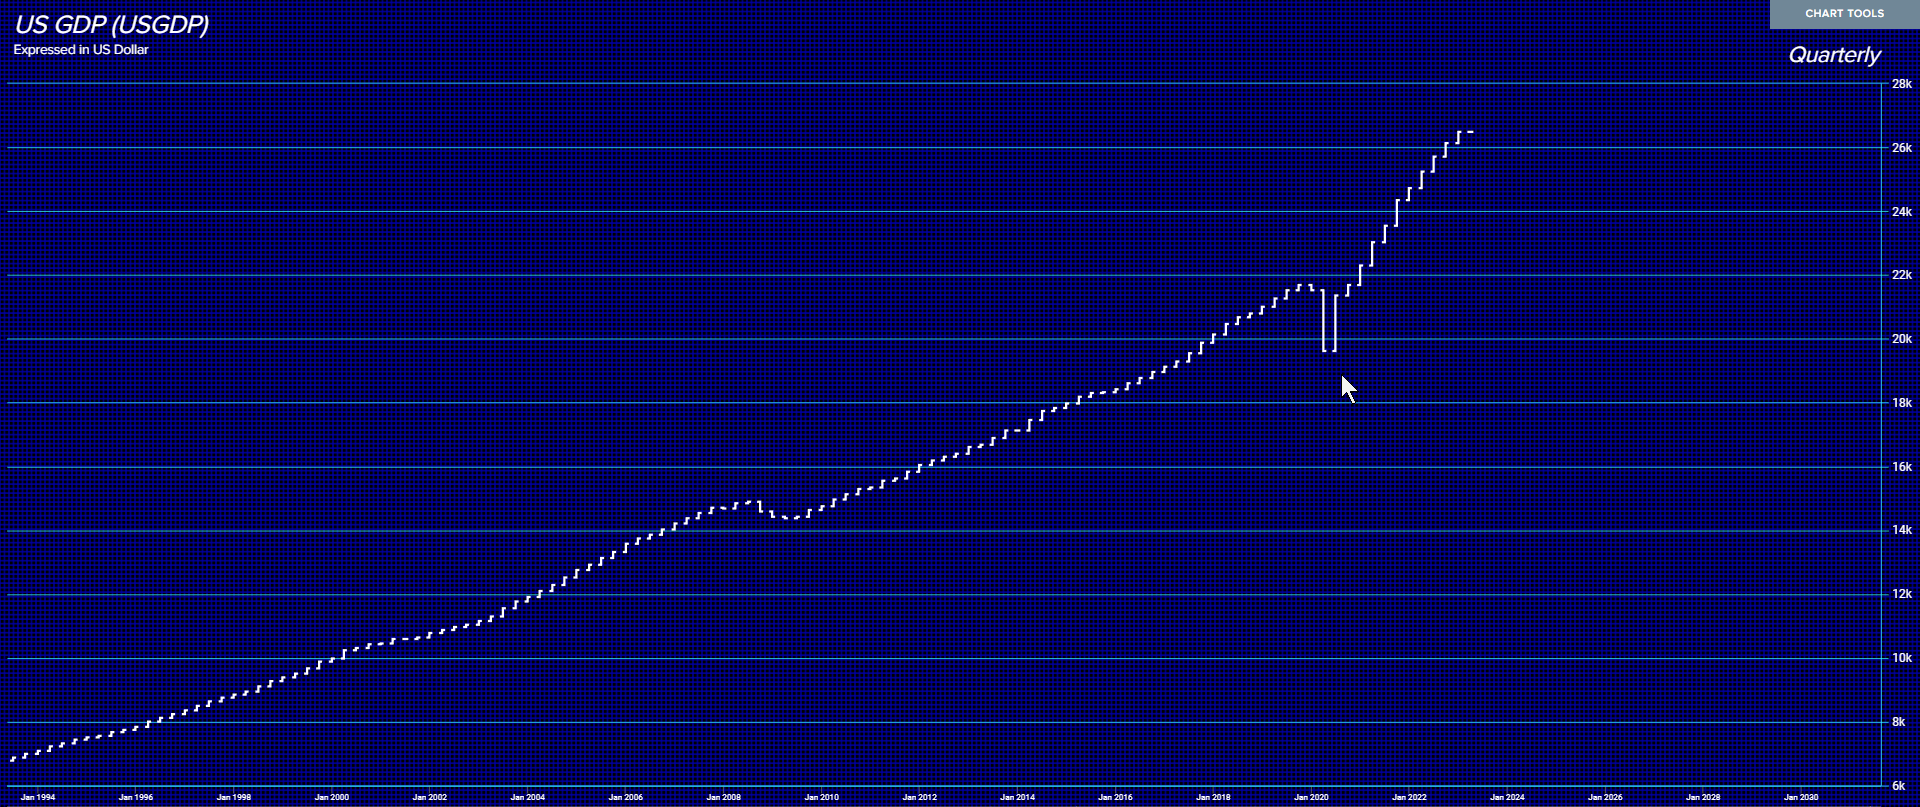
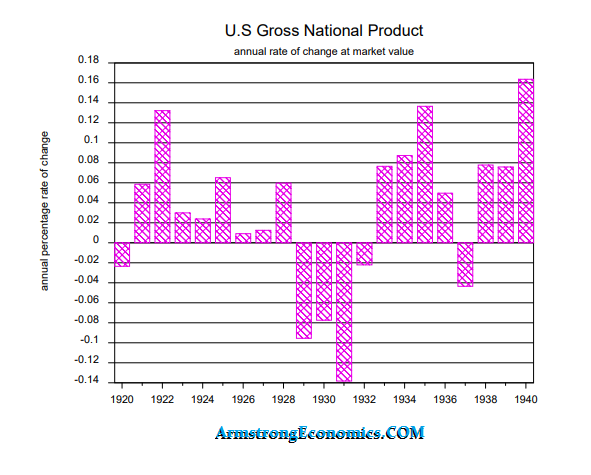
I personally would argue that a true economic recession MUST exceed three consecutive declines. Here is the chart of GNP from 1929 to 1940. There were three years of negative growth. I simply think that this definition of two quarters is wrong. You can have a slight decline of 1 to even 5%, but that does not suggest a recession. In the case of 1929, that was a decline of 9.5% in 1930 – the first year. Now look at the COVID Crash, which was also a decline of 9.53%. But the difference is that the COVID decline was forced and not natural. That is why it rebounded so quickly. Now the so-called “Great Recession” of 2008-2009 only saw a decline in GDP of 3.47%.

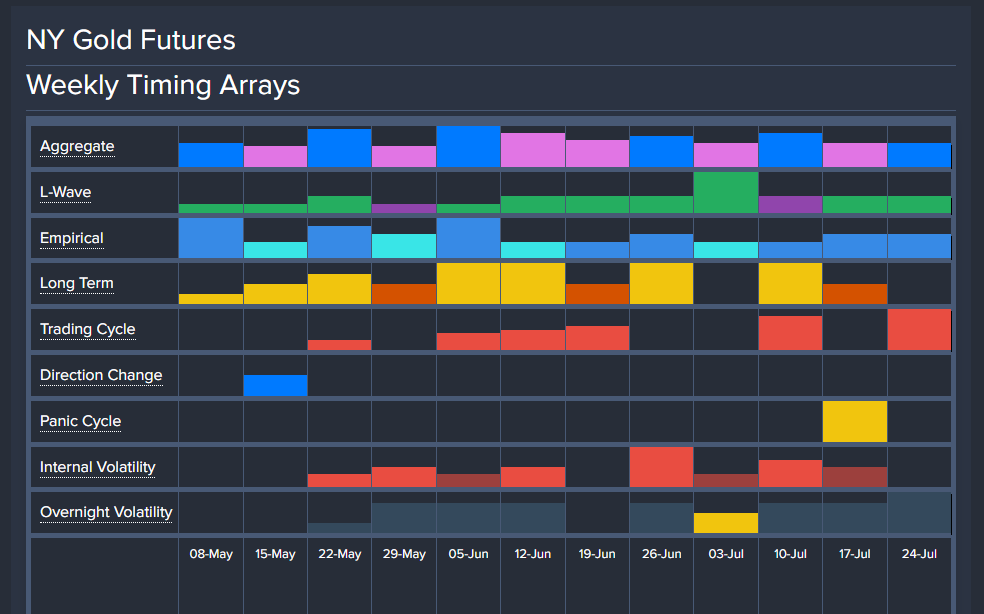
The “Great Recession” was not really so great. It wiped out real estate and bankers but did not fundamentally alter the economy. So who is right and who is wrong will always depend upon the definition. Yes, the AI Timing Arrays point to a recession starting Next Year by their definition. This will most likely be caused by the decline in confidence that will lead to UNCERTAINTY, and as such, the consumer will contract. Up to now, the continued expansion of the economy into 2024 has also been fueled by the shift in assets from public to private.

As originally forecast, we should have seen a commodity boom into 2023,

and we should expect a highly authoritarian attempt by 2028.

Interesting Report Noting Bud Light Regional Sales Pattern – California Sales Minimally Disrupted by Boycott, While National Sales Drop 34.2%


Posted originally on the CTH on July 23, 2023 | Sundance 

Finding solid information, accurate data, to update the perspective of the ongoing boycott of Bud Light products is a little challenging. You would think the data would be easily found; alas, in this era of hyper partisanship, data that would reflect the truth of the situation is less visible. Go figure.

That said, this market share report from Union does give us a little more perspective on the outcome.  According to the market share report, the decline in Bud Light sales overall is 34.2% over the past six months.  Interestingly, some regions have much larger declines than others. For California, “Union reported only minor changes in market dominance in the state. Bud Light’s sales share in California slid by 0.8 points to 6.6%, while Miller Lite’s sales share increased by 1.7 points to 12%.”

(Via MSM) – The hospitality consumption data platform Union reported a significant decline in Bud Light’s sales share in the Carolinas. From April through June 30, the brand’s sales share dropped by 6.9 points, falling from 19.4% to 12.5%. This decline has been attributed to the fallout from Bud Light’s partnership with Dylan Mulvaney, which sparked controversy and calls for a boycott.

[…] Local bar owners in the Carolinas have also reported a significant impact on Bud Light’s sales. For instance, Chris Dimattia, the owner of Recovery Room Tavern in Charleston, SC, mentioned that he used to sell 10 cases of Bud Light each week, but now only sells one to three cases of the boycott brew, resulting in a 70% to 90% drop in sales. At Blind Tiger Pub, another Charleston bar, Bud Light sales are described as “almost non-existent” by general manager Clayton Dukes. Dukes expressed his concern that the boycott may persist for an extended period, prompting him to replace Bud Light draft with Michelob Ultra due to the low sales.

The negative impact on Bud Light’s sales was not limited to the Carolinas. In New York and New Jersey, the brand also lost ground to its rival, Miller Lite. The combined sales share of Bud Light in these states fell by 5.1 points, while Miller Lite’s sales share increased by about two points.

Similarly, in Texas, where Bud Light faced significant challenges after the controversy, Miller Lite now holds a commanding 12% sales share, more than double that of Bud Light’s 5.6% share.  Surprisingly, the boycott’s impact on Bud Light sales was negligible in California, where Mulvaney hails from. Union reported only minor changes in market dominance in the state. Bud Light’s sales share in California slid by 0.8 points to 6.6%, while Miller Lite’s sales share increased by 1.7 points to 12%.

[…] Bud Light’s significant sales slide by 34.2% over the past six months has put the brand in a challenging position. The fallout from Mulvaney’s controversial posts and the subsequent partnership has evidently had a negative impact on the brand’s sales and reputation. (full article)

It would be interesting to map out the percentage change in Budweiser market share and overlay with a comparative map of regional political affiliation.

Regardless of the company ability to overcome the challenge, a total decline in sales of 34.2% over the six-month period would indicate the brand will not soon recover position.   Going woke has consequences.

May Jobs Report Show 339,000 Jobs Gained, Worked Hours Declines, Unemployment Rate Increases to 3.7%


June 2, 2023 | Sundance 

There is a strong divergence within the May jobs report as released by the Bureau of Labor and Statistics (BLS) [DATA HERE].  Payrolls increased 339,000 in May from April and previous months were revised up by 93,000. That is good news.  However, the household survey, from which the unemployment rate is derived, showed employment down 310,000 jobs and the unemployment rate increased to 3.7%.

One of the aspects driving higher payroll starts are the number of people taking on additional part-time jobs.  This aspect is noted in a decline for the number of hours in the average workweek. As more PT jobs are added, the number of hours in a workweek declines. As noted in the BLS data, “the average workweek for all employees on private nonfarm payrolls edged down by 0.1 hour to 34.3 hours in May.

There were 161.0 million people working in April.  There are 160.7 million people working in May.

There were 5.7 million people unemployed in April.  There are 6.1 million unemployed people in May.

The unemployment rate increased from 3.4% to 3.7%.

There are 310,000 fewer people working in May than were working in April.  However, payrolls increased by 339,000 over the same timeframe. See graph above for where those jobs were gained.

(NBC) – […] Job gains were broad-based last month with health care contributing 52,000 and leisure and hospitality adding 48,000. Food services and drinking places led the increase in the latter industry, which had been adding an average of 77,000 jobs per month over the prior 12 months.

Overall, the U.S. economy added 339,000 jobs for the month, much better than the 190,000 Dow Jones estimate and marking the 29th straight month of positive job growth.

The unemployment rate rose to 3.7% in May against the estimate for 3.5%. The jobless rate was the highest since October 2022, though still near the lowest since 1969.

Olu Sonola, head of U.S. regional economics at Fitch Ratings, said the jobs report is a mixed bag.

“The strength of the payroll survey is clearly a big surprise, largely on the back of robust job growth in the healthcare sector and the business and professional services sector,” said Sonola. “However, the 0.3% increase in the unemployment rate is the highest monthly increase since April 2020.” (more)

WAGES – As noted within the BLS report, “In May, average hourly earnings for all employees on private nonfarm payrolls rose by 11 cents, or 0.3 percent, to $33.44. Over the past 12 months, average hourly earnings have increased by 4.3 percent.” Wage growth still lags inflation; the middle class is getting poorer.  However, with the fed focused on wage growth as the leading indicator of their false pretenses to combat inflation, wage growth is too high (they want around 3.0%).

The Biden economic and monetary policies are delivering the results they want.  Higher energy prices, higher costs of living, lower real wages and increased middle class pressure. The serf model.

The BLS was forced to admit yesterday their Real Hourly Compensation growth was previously flawed.  [CHART DATA SOURCE]

That chart of revisions to real wages tells us a lot about the economic pain being felt by the working class in the U.S.  If it feels like you are working harder and going backwards in your ability to afford basic essentials, that’s because you are.

The prices for essential goods and services have risen at a much greater rate than the wages needed to afford them.  This is the result of Joe Biden’s energy policy, economic policy, and now magnifying monetary policy.

Our goods and housing costs are higher.  Our wages are not growing much.  The cost to borrow money to afford the gap is increasing.  This is unsustainable.

In my opinion, the economy overall – as a measure of units produced and sold – has been in a contracting position since the fourth quarter of 2021.  The appearance of economic growth, the value of goods and services, is an illusion that has been created by higher prices, ie. inflation.

Interview: Martin Armstrong on Why the CBDC Will Fail and a Great Depression is About to Begin


Armstrong Economics Blog/Armstrong in the Media Posted May 20, 2023 by Martin Armstrong

Rumble link Martin Armstrong on Why the CBDC Will Fail and a Great Depression is About to Begin

Interview: The Real Rate of Inflation


Armstrong Economics Blog/Armstrong in the Media Re-Posted May 13, 2023 by Martin Armstrong

The Gold Crash & Our Fate


Armstrong Economics Blog/ECM Re-Posted May 19, 2023 by Martin Armstrong

COMMENT: Marty; Socrates is absolutely amazing. At the start of the year, you showed April as a key turning point in gold followed by May June. The weekly array projected this was the week for the Directional Change. There is nobody with a system like this, which brings to mind its forecasts for war. Ukrainians are out of their mind to go against the trend. They never even considered what if they lose. It seems like a fool’s bet. This not about just occupying the Donbas which has always been Russian. This is about destroying Russia. They should listen to Socrates to save their own country.

Thank you so much for bringing Socrates to the public rather than just institutions.

HR

ANSWER:  I know. These forecasts are not my personal opinion. When you put the entire world together, the trend becomes obvious. Just as I said Ukraine needs to lose to save the world, I also know that we will not all escape the end conclusion. Just as a Serb assassinated the Archduke in Sariavo which began World War I, this entire region is notorious for personal grudges and hatreds that draw in the entire world.

Schwab may have taken our forecast for 2032 and rephrased it as his Great Reset and is hoping to push the falling tree into his direction, that too will fail. But between here and 2032, we are entering a phase of chaos and havoc. I wish I could prevent it, but that is just our fate.

Ukrainian Ancient Coin brings more than $5 million at Auction Today


Armstrong Economics Blog/Ancient History Re-Posted May 18, 2023 by Martin Armstrong

The Balkck Sea Trade – Tauric Chersonesus, Panticapaeum.

This is probably the finest known Gold Stater (circa 350-300AD) of Panticapaeum, which was the most powerful city in the Tauric Chersonesus with deep involvement in the lucrative Black Sea grain trade for even back then, Ukraine was a major bread-basket in the ancient world as well. This coin is featuring the facing and bearded head of Pan, with the reverse of a Griffin standing left. The griffin type probably alludes to the mythical composite creatures who were believed to guard the gold found in the mountains of Scythia. The Greeks were wonderful storytellers with vivid imaginations.  Herodotus describes the griffins as neighbors to the Arimaspi, a northern people each possessing a single eye in the center of their foreheads, who made constant attempts to steal the gold (4.13.1). Pliny the Elder, who accepted the story at face value, expanded it to note that the griffins made their nests in burrows in the ground which contained gold nuggets and it was these that the Arimaspi tried to take while the griffins were merely defending their eggs and young (HN 7.2, 10.70).

The providence of this coin dates back to Ex F. Schlessinger XI, 1934, and it was sold as the Russian Hermitage duplicates part II, lot 102. It was then sold in the New York XXVII, sale of 2012, where it was featured on the cover. Previously privately purchased from Bank Leu in 1991 in Switzerland. This coin is extremely rare with only a handful known at best. It’s artistic design is considered to be unsurpassed. This is probably the finest known. It sold at auction back in 2012 for $325.000 + 20%

.

This coin just sold today in Zurich, Switzerland for 4,400,000 CHF + 20% Commission fee. In US dollars, that is $4,862,787 +20% = $5,834,400. This was about 1500% rise in just about 10 years. In all honesty, I have collected ancient coins since I was probably 12 years old. The field of ancient coins has expanded worldwide with major collectors from China to Russia. This coin was estimated at $1,250,000. The sale continues tomorrow with the Roman. I am truly shellshocked by the prices everything is selling for these days. As I have said, ancient coins are a worldwide market unlike particular national coins which fetch the highest prices in their home country.

Ground Reports – What is Your Experience With Prices of “Processed Goods” at Stores?


Posted originally on the CTH on May 13, 2023 | Sundance 

Recently I went to the supermarket to pick up some general provisions.  Given the nature of previously predicted food price increases, and proactive measures to mitigate the predictable prices, I haven’t needed to purchase basic foodstuffs in a while.   Yikes!  The prices… Wow.

Since we originally warned in ’21 about the waves of food price inflation that were coming, the prices have more than tripled on many food commodities.  That part is not as surprising in current review; however, the prices of processed foodstuffs is, well, quite frankly astounding.

I am left to wonder how working-class people are able to afford the jaw dropping price increases in highly processed food products like condiments (mayo, ketchup, mustard, etc), and even coffee and milk.  I knew the processing costs would drive those prices, but the scale is just astounding.

Beyond the foodstuff, what was truly stunning was the current price of non-food items at the store.  Items like chemical cleaners, soaps, aluminum foil, trash bags, Styrofoam products, ziploc bags, paper goods, etc.   I mean seriously, $8 for a box of trash bags, good grief.

After a review of the non-food item prices, I went back to the recent BLS report [DATA HERE] to look at the producer price index to see if the data reflected the scale of the processing cost that I was reviewing across a broad spectrum of goods.

Are consumers getting gouged by manufacturers who are taking advantage of the price shock inside the ongoing inflation?

Or are the processing costs, mostly driven by energy price increases, really that big a factor in the end product as it is generated?

In the topline final demand Producer Price Index [Table A above] you can see how we are cycling through the second wave of inflation that hit in the spring of 2022.  The rate of price increase is lower, but the prices are still rising.  That means the prior massive price increase is now baked into the product, and the current price will never decline. Instead, it will just increase at a slower rate than before.

However, that’s not the full story… and that is not the data I was most curious about.

The intermediate product costs are really where the story is found.

Table B [DATA HERE] Tells us a remarkable story.

Raw materials (unprocessed goods) are essentially in a deflationary status [-19.2% in April].  Meaning demand for the raw material has dropped well below the available supply.  However, look at how much of the deflationary price is consumed in the processing of the raw materials.

A full 16% is consumed by processing cost increases [energy, physical plant, transit, production costs etc]. That is remarkable.

A random example might be citric acid.  The price of the citrus base drops 19.2%, but the processing of the base into the intermediate good phase chews up 16% of the drop in raw material price and exits processing only 3.2% lower in price than a year prior.

Another example might be found in plastics.  The petroleum base, and/or a combination of each material additive, might be 19.2% lower than prior year, but processing negates the lower raw material price, and exits into intermediate essentially even -.04, and then toward the ending +2.3% final demand change in the rate of price increase.

The PPI data is essentially showing the flow of costs of production as reflected in the impact during processing.  We can assume mostly increases in energy, transport and distribution costs to bring the raw material forward to final good status.

Key takeaway, the demand side of the raw material is diminished.  There is less raw material demand.  However, processing costs are continuing to drive the final production price of goods that head into the hands of wholesalers who then bring the product to market.

The outcome of this are the prices of processed goods as noted in the products on the shelves.

QUESTION: Are you noticing rather remarkable price increases in non-food goods during your store visits?

The 12 Caesars


Armstong Economics Blog/Hoards Re-Posted May 13, 2023 by Martin Armstrong

As far as the 12 Caesars are concerned, I am doing my best to assemble a few sets. These are not easy to put together. Nevertheless, I am giving it a shot to see what I can do that would be reasonably priced, under that $100k people ask on the market. I believe reasonably excellent VF/XF sets for around $50,000. But this is not something that quantity exists. This is very hard to assemble. I’m still trying to fill in some gaps. They will be presented in a nice wooden case.

The California Contagion – PacWest Teters on Becoming the Next Regional Bank to Collapse as Regional Banking Stocks Continue Severe Drops


Posted originally on the CTH on May 4, 2023 | Sundance 

According to those who relish the Cloward-Piven strategy, things are proceeding swimmingly.

…”As long as the decisionmakers continue doing the things that are creating the crisis, the crisis will continue.”

Federal Reserve Chairman Jerome Powell said yesterday the “U.S banking system is sound and resilient,” insert uncomfortable snicker here.  However, uncertainty is continuing to pummel the banking industry, despite assurances from the Fed, Treasury, FDIC financial regulators and bankers such as Jamie Dimon who are all saying there is no crisis in the banking industry.

If you want to know the big picture source of the uncertainty, it’s the great pretending.  The average person can sense something is wrong, and the person who pays attention has the experience of institutional lying over the past several years.  The last ten years of lying and pretending has created the biggest collapse in institutional trust in U.S. history.

Russians interfered with the election – trust us. Stick this needle in your arm, it’s safe – trust us.  The FBI are the good guys – trust us. Biden won more votes – trust us. This inflation is merely transitory – trust us.

See the problem?

So, when the same voices shout, “the banking industry is sound, trust us,” well,… yeah, that suspicious cat sense that’s on high alert isn’t buying the chorus.

Reasonably intelligent people who accept things as they are, not as they would have us pretend them to be, can see the core connection to the World Economic Forum, Central Banks, and western globalist policy to change the entire dynamic of economics and finance around the “Climate Change” agenda, or Build Back Better, or Green New Deal.

Overlay that commonsense and pragmatic outlook with the logical consequences of the activity, and this banking collapse issue is a self-fulfilling prophecy.  As long as the decision makers continue doing the things that are creating the crisis, the crisis will continue.

(Via Wall Street Journal) – Regional-bank stocks tumbled Thursday despite assurances from the Federal Reserve that the banking system is on solid footing.

PacWest Bancorp PACW -47.04%decrease; red down pointing triangle, which has been hit hard since the collapses of several banks, dropped by about 40%. The stock started falling in after-hours trading Wednesday evening, after a report that it was considering selling itself.

PacWest said in a statement after midnight Eastern Time Thursday that its core customer deposits were up since the end of the first quarter, and that it hadn’t experienced any unusual deposit flows since the collapse of First Republic.

[…] Investors have been wondering how much further the problems in regional-banking could spread, and whether they will spill over to the broader economy. Some analysts said the decline in PacWest and others reflected the market’s tendency to view news as categorically good or bad, rather than worries about PacWest specifically. Western Alliance, another bank whose stock has been hit hard, fell by about 35%.

[…] Regional banks, as major lenders to businesses and families across the U.S., also tend to fall when investors are expecting a recession. The 10-year Treasury yield slipped this week, and Brent crude hit a 52-week low on Wednesday.

[…] On Wednesday afternoon, the Fed said the U.S. banking system “is sound and resilient,” echoing language from its March statement. Fed Chair Jerome Powell added then that deposit flows at banks had eased and that this week’s seizure and sale of First Republic should further stabilize the industry.

[…] PacWest shares were recently trading around $3.70, putting them on track for their lowest close on record. The stock has now lost some 85% of its value since March 8, the day that SVB spooked bank investors by announcing a loss and a planned capital raise.

Many of PacWest’s customers are tied to technology startups—a tightknit clientele that pulled from high-balance accounts en masse at Silicon Valley Bank before it failed. (more)