Population Crisis


Armstrong Economics Blog/ECM Re-Posted Apr 28, 2021 by Martin Armstrong

QUESTION: Marty, do you think this Deagel forecast for a drop in population that is not explained is just taking your forecast for the conclusion of the Sixth Wave?

GB

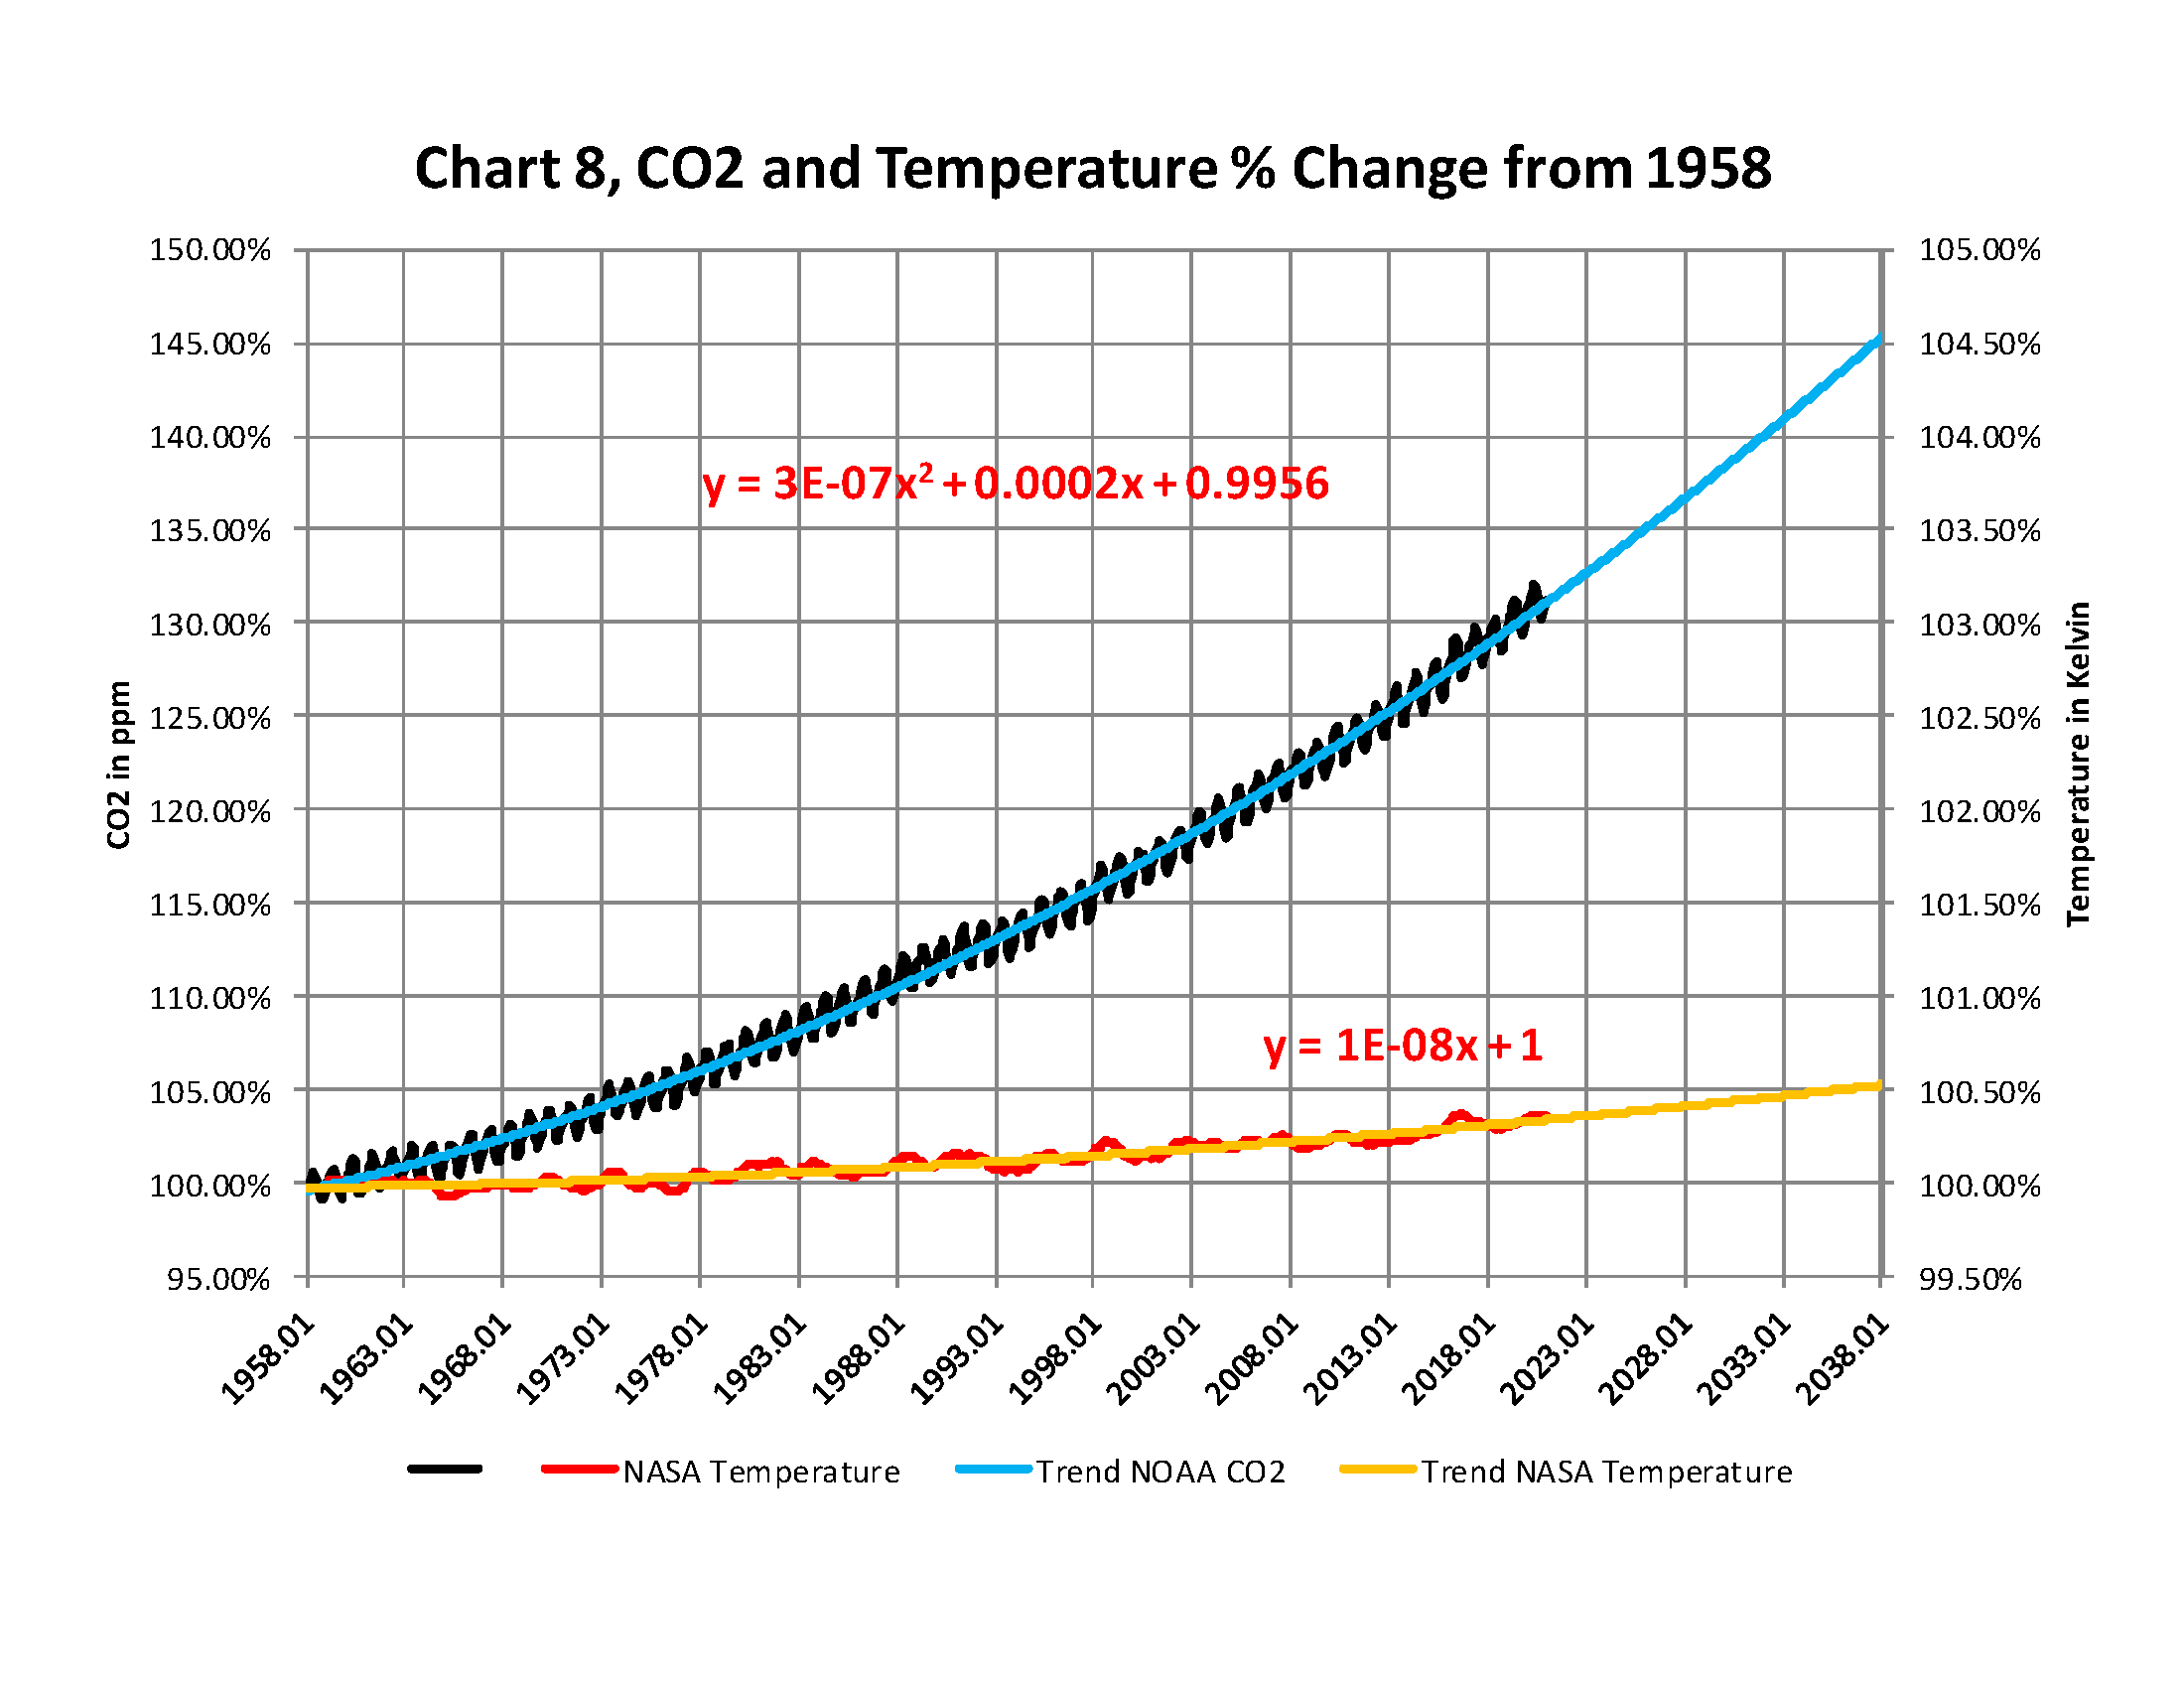
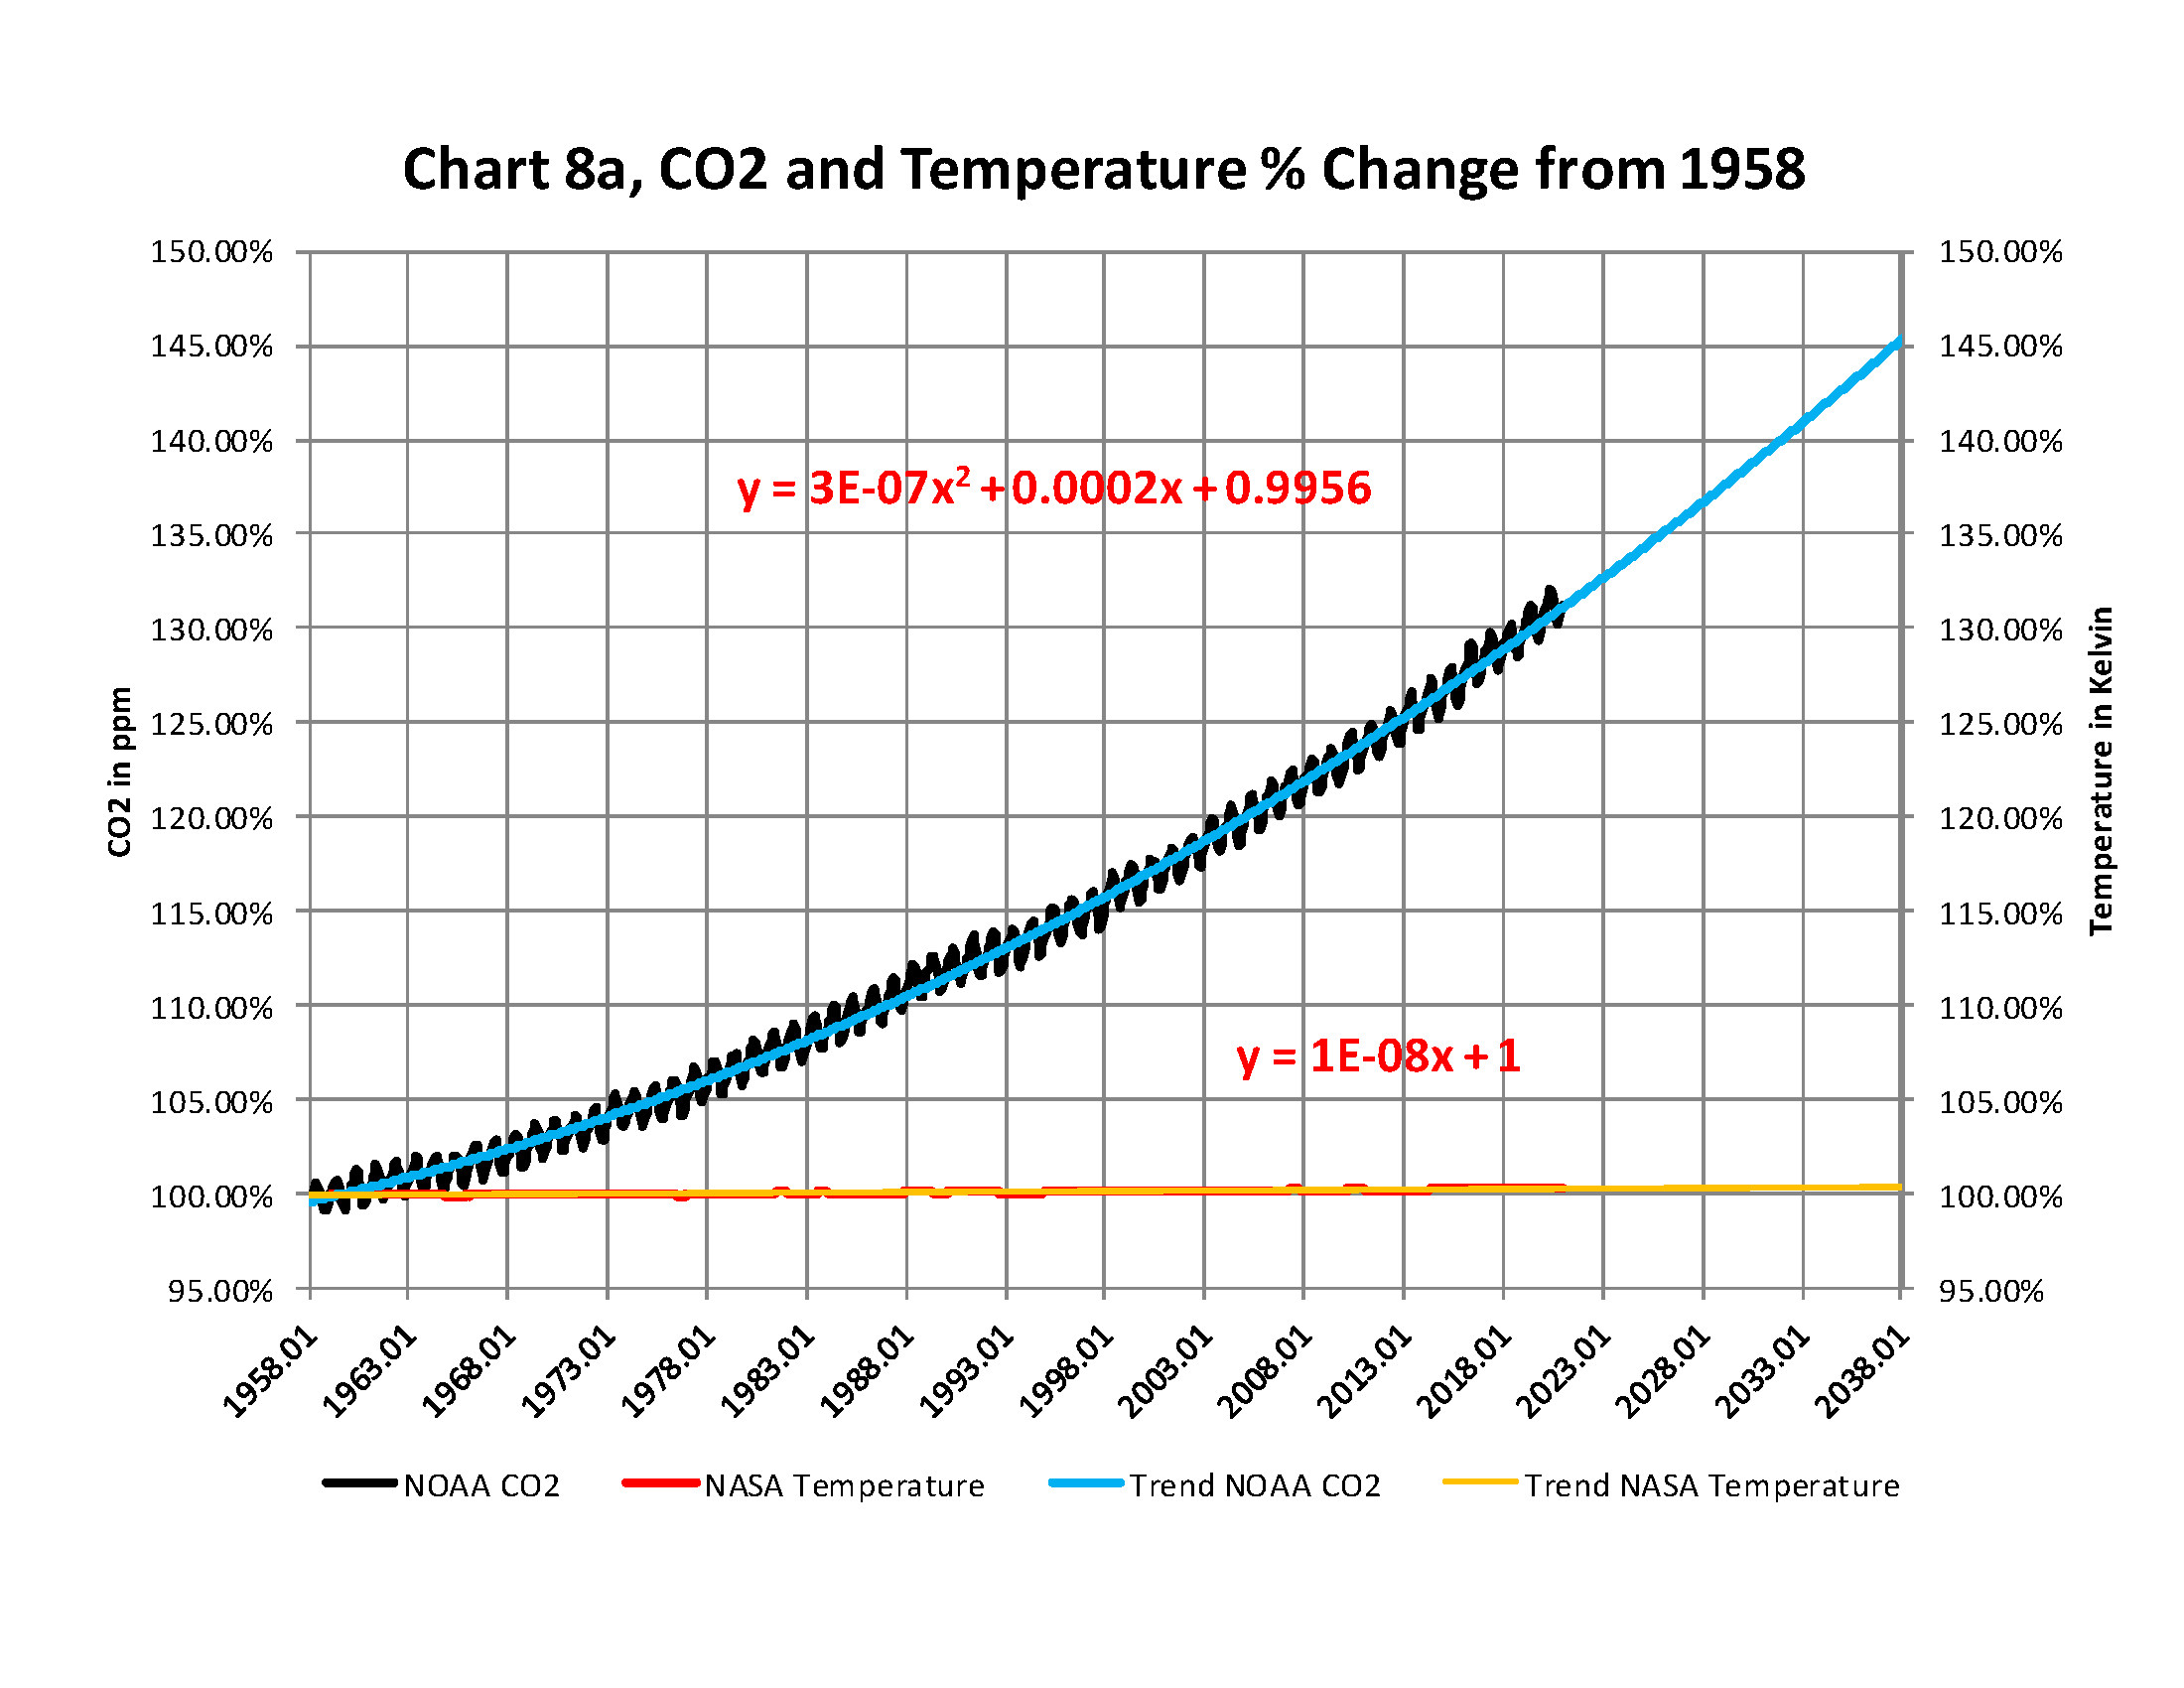
ANSWER: I am not sure what they are referring to or how they arrived at that conclusion. Yes, I have said there remains the risk of a 50% decline in population as the Sixth Wave of the Economic Confidence Model concludes. This is historically standard. It is a combination of disease and global cooling – not warming. Germany has also had the coldest April in 104 years and France lost 80% of its wine crop during to cold. Naturally, these people are claiming the extreme cold is also because of CO2. But they just make up this stuff. There is never any accounting with respect to history.

No US city is the same latitude as Paris. If you look at a globe, you’ll see that Paris is at roughly the same latitude as the northern tip of Newfoundland, Canada. Paris isn’t all that far from the Arctic Circle. This means it’s very dark in Paris during the winter! Keep in mind that the Gulf Stream has kept Europe warming than what you see on the same latitude in Canada.

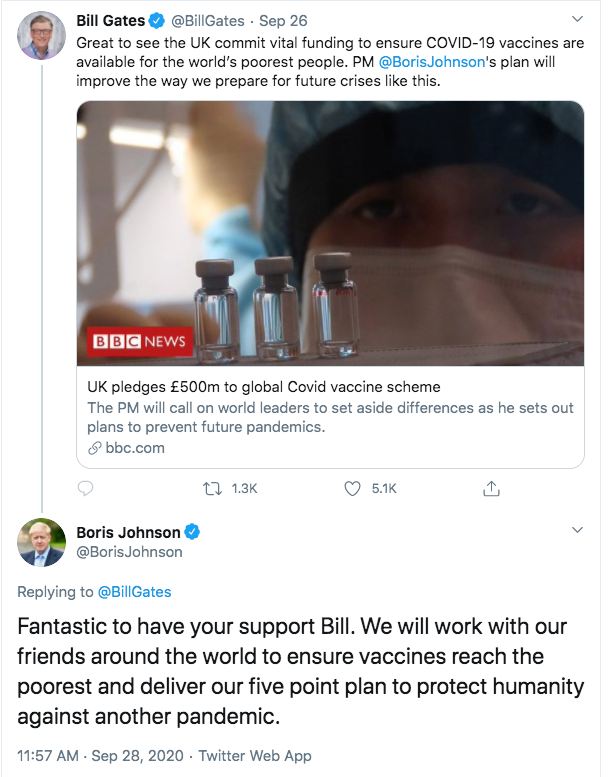
Our models on sunspot warn of a prolonged solar minimum which will not bottom until around 2050. As the climate cools, there will be a rise in disease due to malnutrition and crop failures. This is not CAUSED by Gates, it is a natural cycle. But Gates’ interference is likely to increase the climate crisis and lead to far more deaths than would otherwise take place. He is advocating shutting down fossil fuels which will be needed to save lives.

Keep in mind that our models have also correlated volcanoes to solar minimum. Therefore, volcanic activity increases with solar minimum and it has been the volcanic winters that create the worst crisis because they block the sun as Gates wants to do. There are scientists who are starting to actually correlate these trends. The death rate will be far higher in the less developed countries. But it will also be greater in Europe than in North America.

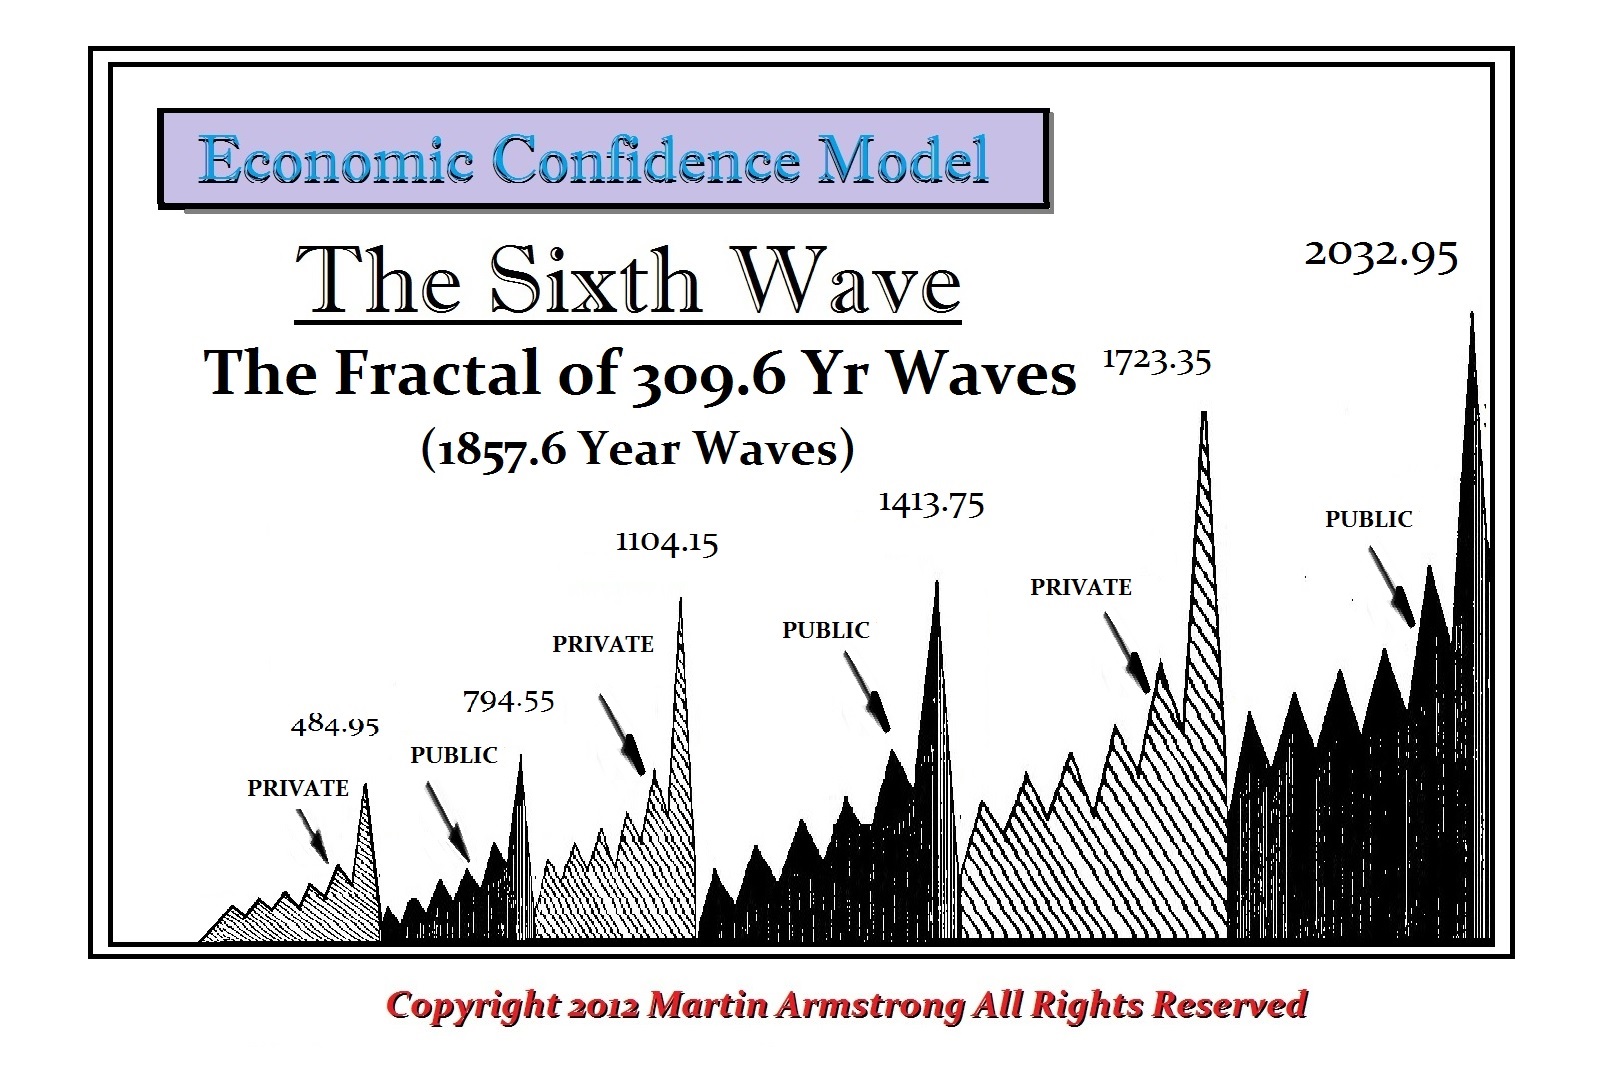
Moreover, we are looking at the collapse of governments on a wholesale level. This is the end of Republics as we have known them. These waves produce complete changes in political systems. Even the last 309.6-year wave led to the collapse of monarchies. This time it will be the Republics and hopefully, we will have a new generation of founding fathers who will turn to direct democracy.


Note:

1723 – Mini Ice Age fall of Monarchy

1413 – Black Plague 50% death rate & fall of Serfdom with the birth of Capitalism

1104 – Fall of Byzantium with Great Monetary Crisis of 1092

794 –  Rise of Charlemagne rebirth of empires and nation-states begins & Japan Capitol become Kyoto in 794

484 – The Huns invade Persia and kill the Sassanian king, Firuz, ending the Sassanid nobility. Rome falls in 476AD

Eyes On The Arizona Audit


Posted originally on GrrrGraphics.com APR 23, 2021 AT 12:06 PM

The Word for today is “Audit,”  the second word for today is “Panic”

The Arizona audit of the 2020 election begins today and the Democrats are panicking. Why? If the election was fraud free and secure then they would have no concerns about the outcome of the audit.  The Democrats filed a last minute law suit this morning trying to block the audit set to begin today.

The Arizona Senate has put security cameras in place to monitor every moment of the forensic audit, no suitcases lugged out from under tables at 4am allowed.

You can watch live on your phone or computer here- Arizona Audit  

This may be the most important audit in American history, Arizona could be the first domino to drop.

Reports are coming in that President Trump is watching the situation and is “very interested” in the audit.

Democrats and the Fake News media have attacked everyone involved with making this ground breaking audit happen. We have seen lawyers connected to the top of the Democrat Party interject and threaten the auditors for performing the work they are hired to do.  General Flynn has warned everyone that Burn Loot Murder and ANTIFA may show up and try to physically stop the audit.

If the 2020 election was not stolen, why would they be so desperate to stop an audit? The results would confirm it was a legit election, right?

The Democrat panic speaks volumes.

The audit will take a few weeks and we will be monitoring it closely.

Remember you’re a racist if you question Democrat gaslighting!

GrrrTeam

A Technical Study in the Relationships of Solar Flux, Water, Carbon Dioxide and Global Temperatures, March 2021 Data


From the attached report on climate change for March 2021 Data we have the two charts showing how much the global temperature has actually gone up since we started to measure CO2 in the atmosphere? To show this graphically Chart 8 was constructed by plotting CO2 as a percent increase from when it was first measured in 1958, the Black plot, the scale is on the left and it shows CO2 going up by about 32.0% from 1958 to March of 2021. That is a very large change as anyone would have to agree.  Now how about temperature, well when we look at the percentage change in temperature from 1958, using Kelvin (which does measure the change in heat), we find that the changes in global temperature (heat) is almost un-measurable. The scale on the right side had to be expanded 10 times (the range is 50 % on the left and 5% on the right) to be able to see the plot in the same chart in any detail. The red plot, starting in 1958, shows that the thermal energy in the earth’s atmosphere increased by .40%; while CO2 has increased by 32.0% which is 80 times that of the increase in temperature. So is there really a meaningful link between them that would give as a major problem?

Carbon Dioxide CO2 is not making “ANY” dangerous changes to the global temperature!

The numbers tell us no there isn’t!

The next chart is Chart 8a which is the same as Chart 8 except for the scales which are the same for both CO2 and Temperature. As you see the increase in energy, heat, is not visually observably in this chart hence the need for the previous chart 8 to show the minuscule increase in thermal energy shown by NASA in relationship to the change in CO2. Based to these trends, determined by excel not me, in 2028 CO2 will be 428 ppm and temperatures will be a bit over 15.0o Celsius and in 2038 CO2 will be 458 ppm and temperatures will be 15.6O Celsius. This is what the data shows no matter what the reasons are, so I have no idea how the IPCC gets to predict that the world will end in ten or even twenty years.

The full 40 page report explains how these charts were developed and why using NASA and NOAA data that are used without change to prove that The New Green Deal is not required and any attempt to complete that plan will be a worldwide disaster.

Click on the link below for the full report that you can download.

Biden is The Only Person Wearing a Mask During Virtual Climate Change Summit


Posted originally on the conservative tree house April 23, 2021 | Sundance | 119 Comments

The current occupant of the United States White House, the optical head of the U.S. government, participated in a global summit to discuss climate change issues.

Apparently he fears being exposed to COVID-19 electronically, while the rest of the world leaders do not….  or something.