Posted originally on Apr 24, 2025 by Martin Armstrong
QUESTION: A recent analysis by Allianz economists claimed that, ordinarily, when yields on Treasuries rise, the U.S. dollar strengthens as foreign capital pursues those higher yields. However, the dollar weakened as yields rose. They said that in this instance, it “suggests major holders were not only selling Treasuries but also converting the proceeds into currencies – possibly reallocating to European markets.”
This does not seem to be correct. It looks like an opinion. Could you comment on this, please?
Thank You
Greg
ANSWER: I think a lot of people fail to appreciate the stark difference between the US markets and Europe. The NYSE is worth MORE in total capitalization than all of Europe COMBINED! The US consumer spending on a bad day is still 25% of global consumer spending. Europe accounts for $1.20 out of every $10 spent. Europe CANNOT be a reservoir for big capital. It is so socialistic, it is a joke. We invented capital flow analysis, and we have the actual data.
This idea is not original about interest rates and capital flows. This is the typical academic theory they still teach in schools today. In 1927, that was the FIRST G4 meeting where Britain, France, and Germany petitioned the NY Fed to lower interest rates in hopes that that would send capital back to Europe. When they did that, it CONFIRMED that there was a debt crisis, and even more money poured into the USA.
The Fed cut rates in the US to help Europe, and the markets continued to rise as capital flows into the US intensified. The money was pouring into the US equities, and the Dow more than doubled as the Federal Reserve raised rates from 3.5% to 6%.
China has been reducing its holdings of US debt ever since the 2014 Ukrainian War began and the Biden Administration threatened China with sanctions if it helped Russia. This is what I have spoken about the BRICS is all about: geopolitical theater, not economics. China saw removing Russia from SWIFT as using the world financial system as a geopolitical tool. The Biden Administration was run by the Neocons, who do not care about the people or the economy, only their myopic desire to destroy Russia.
This is why FOX News or any mainstream news organization would NEVER invite me because I rain on their parade. This is all about feeding people the narrative they agree with. This is never about news.
BLOOMBERG
Bloomberg has crossed to the dark side of propaganda; They are more concerned about hating Trump than they are about reporting just the facts, ma’am. They reported:
“The rotation by investors out of American assets will go on for years if President Donald Trump persists with his global trade war.”
“The Trump administration has arguably opened the door for the country’s financial dominance to be challenged, with the dollar and Treasury bonds losing appeal in what may be a dire shift of fortunes for America. US equities also have been underperforming global peers this year amid fear that Trump’s strategy of tariff chicken will damage growth and stoke inflation.”
This is all based on the Democrats’ propaganda during the 1932 presidential election. As I have said, there is no serious economist I have ever heard blame the Great Depression on the tariffs, which did not come into effect until June 1930, and they were a response to Europeans raising taxes 33 times after World War I.
By the way, Japan and China have also been dumping European Debt. With Europe pushing for World War III, you have to be insane to buy European debt. European shares hold the risk of capital controls, and you will not get your money out when the first bullet is fired.
So, people are selling US shares and debt and moving to Europe as a safe haven? They must be the same people who are still driving alone in their car with a mask on to feel safe.
Posted originally on CTH on April 16, 2025 | Sundance
The State Dept. Global Engagement Center was the epicenter of the Dept of State operation to control speech on social media platforms. Following revelations from within the Twitter Files, and facing increasing scrutiny, the GEC operation was shut down – but the remnants of the operation remained active within the State Dept.
The terms “disinformation, misinformation and malinformation” were weaponized by the State Dept to define speech against their interests and block, deplatform and remove any voices, including in the U.S., they determined were against the interests of the U.S. government. The COVID-19 and vaccine narrative were both examples of speech targeted by the GEC and later the Counter Foreign Information Manipulation and Interference office (R-FIMI).
Today, Secretary of State Marco Rubio and Acting Undersecretary of Public Diplomacy, Darren Beattie, delivered notice to congress the speech and platform control operation has been shut down. Secretary Rubio sat down with Mike Benz to discuss [Transcript Here].
.
Secretary Rubio continues to surprise many, me included. It started when Rubio publicly said, the Ukraine conflict was a U.S. proxy war against Russia. “It’s been very clear from the beginning that President Trump views this as a protracted, stalemated conflict,” Rubio said. “And frankly, it’s a proxy war between nuclear powers, the United States helping Ukraine, and Russia.” [link]
Considering that Rubio previously called for NATO intervention in Ukraine, and considering that Rubio voted to limit the ability of the President to withdraw from NATO policy, the recent remarks by Secretary of State Rubio were shockingly the opposite of his prior stances.
Saying the USA is in a proxy war with Russia, via Ukraine, is not something Marco Rubio can retreat from.
Two days ago, specifically because of my granular research, I was asked this question about Rubio. “What are the odds this is really Rubio?”
Look, I don’t know what happened and would love to ask him some details to get answers; but Rubio’s statements are so far out there against the Deepest part of the Deep State, there is no retreat for the former Chairman of the Senate Select Committee on Intelligence.
Rubio said publicly the Ukraine conflict was a USA proxy war against Russia. For obvious reasons the MSM essentially buried that statement fast; but it’s not something he can ever retreat from, nor does it look like he would want to.
Either Rubio has some pre-approved ability to criticize the darkest elements of the DC Deep State, and this is some rather intense operation to position himself as a stealth agent of the CIA for future benefit, or Rubio really believes what he is saying now and is a changed person.
I’m still undecided, because there are some IC facets at play (even today) that I am still not comfortable writing about, yet.
That said, where do these statements put Rubio in the dynamic of MAGA foreign policy? Right at the tippy top of the spear against the deadliest elements of the U.S. Intelligence Apparatus.
The United States Secretary of State told the world, the biggest conflict zone in the past 20 years is the result of Ukraine being a USA proxy war against Russia.
Put everything else aside for the moment and realize, with that statement the guy just wiped out every Deep State affiliation he ever carried. He cannot enter that camp ever again. Rubio “burned the boat” and carried his weapon into battle for Trump.
The question is, did Rubio burn his boat knowing there is another one beyond the horizon waiting to come in and pick him up later? He really is playing the role of a dragon slayer for President Trump right now.
♦ Suspicious Cat says, if Benz, who can play the piano like a Red Sparrow, is an affiliate of a domestic CIA team, then this whole thing is an op. However, if Benz is a genuine independent voice against the interests of the control system, then Rubio -who touched the flame of the SSCI- might have reversed his worldview.
If legit, this Rubio shift is akin to a leopard changing to zebra stripes; crazy, super rare. He was a 99-0 Senate confirmation vote.
Posted originally on CTH on April 16, 2025 | Sundance
Today White House Press Secretary Karoline Leavitt will hold a press briefing from the Brady press room in the White House with a special guest. The anticipated start time is 4:30pm ET. Livestream Links Below:
Posted originally on Apr 15, 2025 by Martin Armstrong
The United States has about 330 million people, and one in every $3 spent in world trade is by American Consumers. Europe has 450 million people, but it still clings to Marxism, is highly regulated, and is very anti-entrepreneurial. Trump fails to grasp here that trade wars will NOT even the score. The global consumer market seems to be ignored. As I have explained, the Current Account, which people call the trade account, also includes all interest and dividends on stocks, bonds, and investments. In theory, if China bought 100% of the US national debt, then the perceived trade deficit from interest of $1 trillion would flow to China, and this has nothing to do with jobs or manufacturing anything.
Let’s clarify trade. The United States has the largest economy in the world, so it’s the top contributor to global consumer spending. China would be next, followed by countries like Japan, Germany, the UK, India, and so on. Note that China is already the #2 consumer-based economy. Europe is far too Marxist, and it still clings to the old theories of Mercantilism. The average German has less net wealth than an Italian, yet they are the biggest economy.
In recent years, the global GDP has been around $100 trillion. Depending on the economy, consumer spending typically makes up about 60-70% of a country’s GDP. So, if we take 65% of $100 trillion, that’s about $65 trillion in global consumer spending annually in theory. Now, breaking this down by country. The US GDP is around $25 trillion. If US consumer spending is about 68% of GDP, that would be roughly $17 trillion. Therefore, the US share would be 17/65, approximately 26%. That means we have a US consumption-driven economy.
China’s GDP is around $18 trillion. However, consumer spending as a percentage of GDP is lower, maybe around 40%, because their economy is more investment—and export-driven. So 40% of $18 trillion is $7.2 trillion. That would be about 11% of the global total ($7.2T / $65T).
Let’s compare this to Japan’s GDP, which is about $4.9 trillion. Consumer spending there is higher as a percentage, maybe around 55%, so $2.7 trillion. That’s roughly 4.15% globally.
Germany’s GDP is around $4.2 trillion. With consumer spending at around 50% of GDP, that’s $2.1 trillion, so 3.2% globally.
India’s GDP is approximately $3.4 trillion. Consumer spending accounts for a larger part, maybe 60%, so the total is $2.04 trillion, which is about 3.14% of the global total.
The UK’s GDP is about $3.1 trillion. Consumer spending at 60% would be $1.86 trillion, so around 2.86%.
France’s GDP is $2.9 trillion. Consumer spending at 55% gives $1.6 trillion, about 2.46%.
Brazil’s GDP is $2.0 trillion. If consumer spending is 60%, that’s $1.2 trillion, so 1.85%.
Italy’s GDP is $2.1 trillion. Consumer spending at 60% would be $1.26 trillion, around 1.94%.
Canada’s GDP is $2.0 trillion. Consumer spending at 57% gives $1.14 trillion, which is 1.75%.
South Korea’s GDP is $1.7 trillion. Consumer spending at 50% is $0.85 trillion, so 1.3%.
Russia’s GDP is around $1.8 trillion. If consumer spending is 50%, that’s $0.9 trillion, about 1.38%.
Australia’s GDP is $1.6 trillion. Consumer spending at 55% would be $0.88 trillion, 1.35%.
Consequently, the total for these top countries is around 59.65%, leaving about 40.35% for the rest of the world. This is all based on rough estimates. Then we also have nominal GDP vs. PPP (Purchasing Power Parity). However, consumer spending in nominal terms is usually what’s used for such global comparisons, further complicating our exercise.
Another consideration: The figures I used for consumer spending as a percentage of GDP might not be accurate for each country. For example, China’s consumer spending as a percentage of GDP has been increasing but was historically lower. According to the World Bank, in 2022, China’s household final consumption expenditure was about 38% of GDP. The US was around 68%, Japan about 55%, Germany 52%, India was around 59%, UK 63%, France 54%, Brazil 64%, Italy 61%, Canada 57%, South Korea 48%. So my initial estimates were somewhat close but may need adjustment.
US: 25T GDP * 68% = 17T
China: 18T * 38% = 6.84T
Japan: 4.9T * 55% = 2.695T
Germany: 4.2T * 52% = 2.184T
India: 3.4T * 59% = 2.006T
UK: 3.1T * 63% = 1.953T
France: 2.9T * 54% = 1.566T
Brazil: 2.0T * 64% = 1.28T
Italy: 2.1T * 61% = 1.281T
Canada: 2.0T * 57% = 1.14T
South Korea: 1.7T * 48% = 0.816T
Russia: 1.8T * 52% = 0.936T (assuming 52%)
Australia: 1.6T * 55% = 0.88T
Spain: 1.4T * 58% = 0.812T
So total consumer spending from these 14 countries is approximately $41.389 trillion out of about $65 trillion globally.
Now, converting each country’s consumer spending to a percentage of global:
US: 17 / 65 = 26.15%
China: 6.84 / 65 ≈ 10.52%
Japan: 2.695 / 65 ≈ 4.15%
Germany: 2.184 / 65 ≈ 3.36%
India: 2.006 / 65 ≈ 3.09%
UK: 1.953 / 65 ≈ 3.00%
France: 1.566 / 65 ≈ 2.41%
Brazil: 1.28 / 65 ≈ 1.97%
Italy: 1.281 / 65 ≈ 1.97%
Canada: 1.14 / 65 ≈ 1.75%
South Korea: 0.816 / 65 ≈ 1.26%
Russia: 0.936 / 65 ≈ 1.44%
Australia: 0.88 / 65 ≈ 1.35%
Spain: 0.812 / 65 ≈ 1.25%
Others: 36.3%
Please remember that these percentages are estimates of global consumer spending by country based on GDP and consumption patterns. The United States is the largest consumer-based economy in the world, and about 26% of total world spending involves the American consumer. China is only 10.5%, and Japan is at 4.1%. Europe comes in at around 12%.
In summary, China is actively trying to build a more consumer-based economy, with policies and trends supporting this shift. However, structural and demographic challenges might slow this transition into 2028. The progress is evident, but it’s a work in progress. After 2032, they hold the potential to surpass the United States as the financial capital of the world. The problem in the United States is that the Democrats keep trying to oppress the economy like Europe, imposing socialistic goals that are not economically efficient.
Key Evidence of China’s Transition:
Rising Consumption Share of GDP:
Household consumption contributed 53% of GDP in 2023, up from ~35% in 2010. While still lower than the U.S. (~68-70%), this marks significant growth.
Services and high-tech industries are expanding, reflecting demand for healthcare, education, and entertainment.
Policy Shifts:
“Dual Circulation” Strategy:
Emphasizes domestic consumption (internal circulation) alongside international trade, reducing reliance on exports.
Social Reforms:
Efforts to strengthen social safety nets (pensions, healthcare) aim to lower household savings rates, freeing income for spending.
Urbanization and Middle-Class Growth:
Over 60% of China’s population now lives in cities, fostering a consumer class with higher disposable income.
E-Commerce and Digital Economy:
China leads globally in e-commerce (e.g., Alibaba, JD.com) and digital payments, facilitating consumer spending. The digital economy accounts for ~40% of GDP.
Challenges to a Consumer-Driven Model:
Structural Imbalances:
Investment and exports still dominate (e.g., state-led infrastructure, real estate). Transition requires rebalancing toward the private sector and services.
Household debt
has risen to ~62% of GDP (2023), potentially constraining spending.
Demographic and Social Factors:
Aging Population: By 2035, 30% of citizens will be over 60, likely increasing savings and reducing consumption.
Income Inequality: Rural-urban gaps and uneven wealth distribution limit broad-based consumption growth.
Geopolitical and Economic Risks:
Trade tensions and global demand volatility (e.g., post-COVID, U.S.-China decoupling) pressure China to prioritize domestic demand.
Real estate sector
Slowdowns could dampen consumer confidence.
China is deliberately building a consumer-based economy through policy reforms, urbanization, and digital innovation, rejecting the European mercantilist economic philosophy. While progress is evident, structural hurdles, such as reliance on investment aging demographics, mean the transition will be gradual but ongoing. The government’s success in addressing these challenges will determine the pace and sustainability of this shift. China’s economy remains a hybrid model, blending consumption growth with traditional drivers like state investment.
The current account is a key component of a country’s balance of payments, recording international transactions in goods, services, income, and transfers. It consists of four main components:
Trade in Goods (Visible Trade):
Exports and imports of tangible products (e.g., machinery, vehicles, electronics).
The balance of trade in goods is often referred to as the “merchandise trade balance.”
Trade in Services (Invisible Trade):
Exports and imports of intangible services (e.g., tourism, financial services, education, consulting, transportation).
Combined with trade in goods, this forms the trade balance (goods and services).
Primary Income (Income Flows):
Cross-border income from investments and employment:
Investment income: Dividends, interest, profits from foreign investments (e.g., dividends from overseas stocks).
Compensation of employees: Wages, salaries, or benefits earned by workers in a foreign country (e.g., remittances from expatriates).
Secondary Income (Current Transfers):
One-way transfers where no goods, services, or assets are exchanged in return:
Remittances: Money sent by migrants to their home country.
Foreign aid/grants: Government transfers (e.g., disaster relief, development aid).
Pensions, gifts, or donations: Transfers between individuals or organizations.
A Trade War based on just the gross of the Current Account does NOT reflect our trade deficit or surplus.
Foreign investors overall own roughly 10-20% of Manhattan’s high-end residential properties (e.g., condos), with Europeans constituting a significant but minority share of this group. For example, if Europeans account for 30-40% of foreign-owned properties, their stake might be 3-8% of Manhattan’s luxury residential market. While exact figures are elusive, Europeans likely own 3-7% of Manhattan’s total real estate, with higher concentrations in luxury residential and prime commercial sectors. This is only an estimate and not definitive. Any income, such as rents, on that property will flow out through the current account and will appear as a trade deficit when it has NOTHING to do with trade.
As of 2023, approximately 23-24% of the total U.S. national debt is held by foreign entities. This calculation is based on foreign holdings of around $7.4 trillion out of $31.4 trillion at the time. Therefore, of about $1 trillion in interest expenditures. Thus, about $230+ billion is flowing out through the current account that has nothing to do with trade. The major holders of US national debt include Japan, China, and the United Kingdom.
Understanding these components is now CRITICAL in the middle of a trade war. The sale of US debt will go through the capital account, but it will reduce the interest paid to foreigners that go through the current account, creating the illusion of a trade deficit. I disagree with Trump’s formulas, and the risk of a permanent trade war with China is now assured unless he gets on a private phone call. You cannot make public demands against China for then they cannot back down based on their culture.
Posted originally on CTH on April 12, 2025 | Sundance
Regarding the recently released Russiagate files. Again, emphasizing that process matters, let me explain how and why we are being purposefully misled, even with Trump ‘allies’ in control of various govt agencies (silos).
Using the reference of the James Wolfe storyline, let me outline how process matters and how you can tell when the process is being used to coverup corrupt activity in Washington DC.
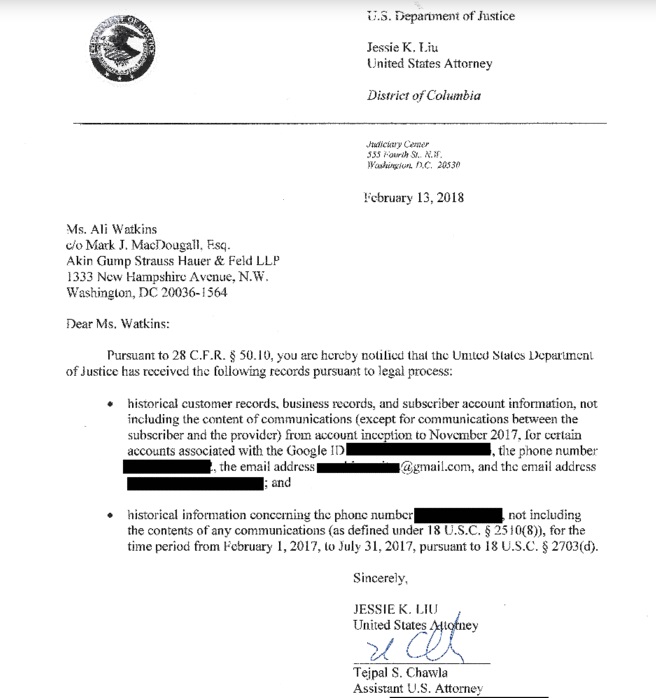
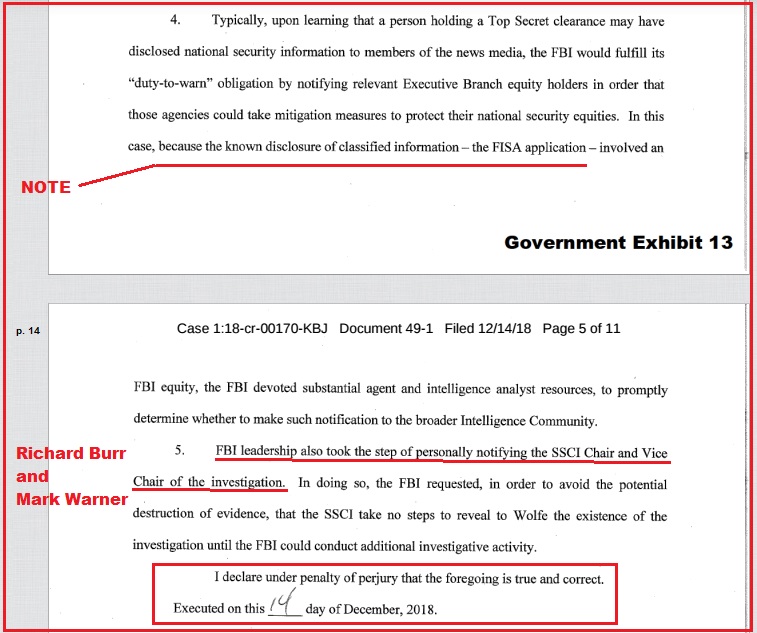
Former Senate Intelligence Community Security Chief, James Wolfe, leaked the Carter Page FISA application to journalist Ali Watkins. We know from the DOJ indictment of James Wolfe [SEE HERE], a very specific set of evidence and key dates that was assembled against him.
James Wolfe was nailed for lying to FBI investigators about his leaks to Ali Watkins on December 15, 2017. That is the date of the second interview with Wolfe. During the third interview a few days later, Wolfe was shown the evidence against him, and he admitted his lies. However, his indictment was not unsealed until June 7, 2018.
Key Dates: Busted for guilt December 15, 2017. Indicted June 7, 2018.
♦ The evidence against Wolfe included text messages between Senate Intel Vice-Chairman Mark Warner, and the lawyer for Oleg Deripaska, an attorney named Adam Waldman. The text messages were made public on Feb 8, 2018, [SOURCE] four months before Wolfe was indicted.
♦ The evidence against Wolfe included text messages between Wolfe and journalist Ali Watkins. Ms Watkins was notified of her phone records being seized by FBI investigators on February 13, 2018, [SOURCE] again four months before Wolfe was indicted.
Why was this evidence, all of which would have been useful at trial, purposefully released by the Mueller investigation who was in charge of everything related to Russiagate at the time.
Shortly after James Wolfe was indicted, the Title-1 FISA application he leaked was then released to the public under the auspices of a FOIA request. Wolfe indicted June 7, 2018, the FISA application released publicly July 21, 2018 [SOURCE].
RIGHT QUESTION: Why was the evidence against James Wolfe being released to the public between the time the case was made (Dec ’17) and the time the indictment was unsealed (June ’18)? Why wasn’t the evidence held until criminal trial processes began?
ANSWER: In hindsight we discover the Mueller team were in charge of the timeline because the Russiagate investigation superseded all other Main Justice outcomes and consequences. The Mueller team were protecting the participants (Ali Watkins, Mark Warner, James Wolfe etc.), who all knew they were being investigated as a result of the Wolfe leak.
All of these players, including the media who received the FISA application from the Wolfe leak, knew they were tangentially and directly connected to the Wolfe investigation. After Wolfe made his admission (December ’17), all of the collateral players knew they were at risk.
The FBI was notifying all stakeholders of the Wolfe admission, and Mueller’s team was helping to mitigate the consequences to those stakeholders. How? With controlled public releases of information.
Each of the corrupt actors had weeks, some even months, to hire lawyers, obfuscate the evidence of their involvement and formulate their defenses. That’s why the information was being “released.”
The biggest single example of controlling damage and public opinion through the selective release of information was also the most brutally obvious, the July 21, 2018, release of the Carter Page FISA itself.
This was a Top-Secret Compartmented Intelligence document (TSCI). Directly related to a national security matter, and directly related to an ongoing investigation, and directly a component of the largest leak of top-secret classified information in decades.
The FISA itself was the easiest of all documents for the DOJ, FBI and National Security Apparatus to keep hidden from public view. There was no court in America who would have ordered it to be released. Quite simply, there was no reason for the DOJ to even consider releasing it; yet they did.
The Title-1 FISA application was released by Main Justice under the ridiculous justification of a Freedom of Information Act (FOIA) release. Name me another TSCI document in the history of the Intelligence Community, that has ever been released under a FOIA (either before, or since); there simply isn’t another example. Yet in the rush to review it, no one ever drew attention to this brutally obvious point.
The FISA was released shortly after James Wolfe was indicted, because everyone in the background network of the James Wolfe indictment, mainly the DOJ under Mueller team control, was operating to control information adverse to their interests. The public release watered down the jaw-dropping leak itself.
Why visit this example again? Because we are seeing a repeat of this pattern in the recently released Russiagate files.
If DC can frame negative information as politically motivated, DC can then avoid the unlawful and illegal activity underneath the information. That is exactly what is happening, and that is why process is important.
If the bad actors in the silos want to remove the concern about illegal activity, they control release the information framing it as political in nature.
…”if the DOJ can claim evidence is political, it then nullifies the evidence and ends the case. This is why SD is pissed they handed this to that [willing] idiot Solomon.”…
I have created this site to help people have fun in the kitchen. I write about enjoying life both in and out of my kitchen. Life is short! Make the most of it and enjoy!
This is a library of News Events not reported by the Main Stream Media documenting & connecting the dots on How the Obama Marxist Liberal agenda is destroying America