The 2017 Closing US$ – Gold – Dow


The Dow failed to OPEN above the 2017 Intraday high so we are not yet ready for prime time. This is still a 0ff-Broadway play, but we are getting closer. The dollar still finished neutral so it too is not yet ready for its move higher. Gold closed in a positive position for the end of 2017 confirming the posture in the dollar.

We will review all the world markets for 2018 in the coming Outlook Report for 2018.

Housing Begins to Crash – Australia – New Zealand – London


Property values are starting to crash hard in Sydney Australia, New Zealand, and London. Politicians are simply idiots. They all targeted foreigners buying property as the leading cause for the rise in housing prices. What they failed to grasp is that people spend more money when they THINK they have equity in their home. Whenever housing starts to decline, so does consumer spending and guess what – you get the economi9c downturn. Dah!

Tugboats Need Rescue in NYC


This winter is very cold. It has even gone down to the 40s at night in Northern Florida. There is a mad rush to run out and buy coats down here. Meanwhile, in the LaLa-Land of corruption, New York City, the ice in the Hudson River keeps getting thicker. Historians had remarked that as the rivers in Europe froze solid, this allowed the barbarians to invade Rome. Perhaps those in New Jersey should sleep with one eye open that the hoards from Manhattan don’t invade looking for trinkets and food.

This ice is gett so think in the Hudson River that even the tugboats have to be rescued. As the ice is getting thicker, most boats just cannot handle this freeze.

Solar Minimum The Fastest Decline in almost 10,000 Years


QUESTION: Hi Marty !

Happy new year! Not written in a while, but wanted to ask a private question related to the forthcoming cold period.

a) How long will it last? (It will start now and go into 2024 – when does Socrates say it will start to reverse and when will temperatures be back to where they are now ?)

b) How far south does someone have to go who is allergic to cold anyway? Is it best to keep away from volcanic islands?

c) Is it in your view a minor cold blip or “OMG we’re all going to freeze to death and run out of food ?”

Just so I know the prognosis. It would be helpful if you could ask Socrates the relevant questions as I think there are a number of folks who would n’t mind knowing the answers to these types of questions – privately !!!

Trust all is well with you.
BR

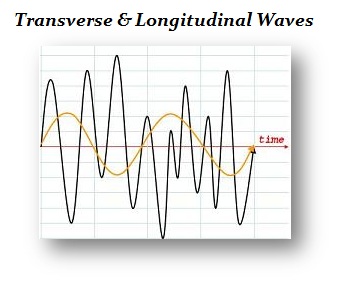
ANSWER: Socrates was projecting that the peak on this cycle aligned with the ECM 2015.75. This is a Longitudinal Cycle, not Transverse. That means peak to bottom varies. This wave should be a 13-year decline from 2015 making it 2028 at best. The outside projection calls for a 17-year decline and that lines up with the peak in the ECM 2032.

Worst still, the rate of decline will be brutal. This implies we are looking at the fastest decline in nearly 10,000 years. I suppose that is appropriate since we are also at a 5,000-year low in interest rates as well.

There is additional research correlating sunspot activity to planetary orbits. Real scientists are exploring climate change as a part of nature rather than man and the correlations are interesting. “The movement of planets, solar activity, and global climate change are increasingly being explored. The periodicity of solar activity along with the physical mechanism of the changing of the Sun is an important topic in solar physics” (may 2017 Annales Geophysicae (EGU). Unlike the Global Warming crowd pushing fake research to get $1 billion grants from government welfare, real investigation into global climate change and solar activity is an incredibly vital and important subject in geophysics, which government is not funding with handouts because it does NOT support raising taxes.

There was a German astronomer, Samuel Heinrich Schwabe (1789–1875), founder of the sunspot theory, who discovered a regular cycle or variation in the number of sunspots occurring over a 17-year span (Schwabe 1843). There was the Russian professor A. L. Tchijevsky (also spelled Chizhevsky) (1897–1964), who initiated Schwabe’s sunspot theory and plotted an 11-year cycle back to the 5th century BC (Chizhevsky 1924).

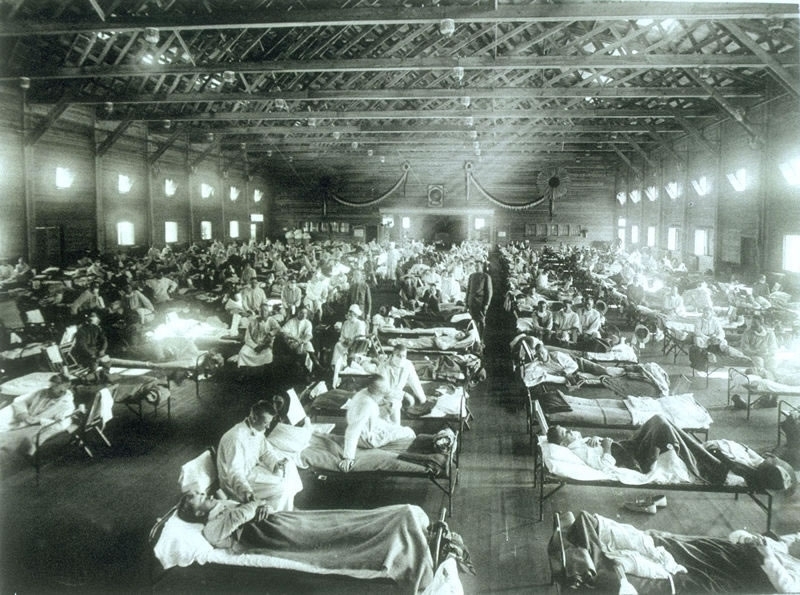
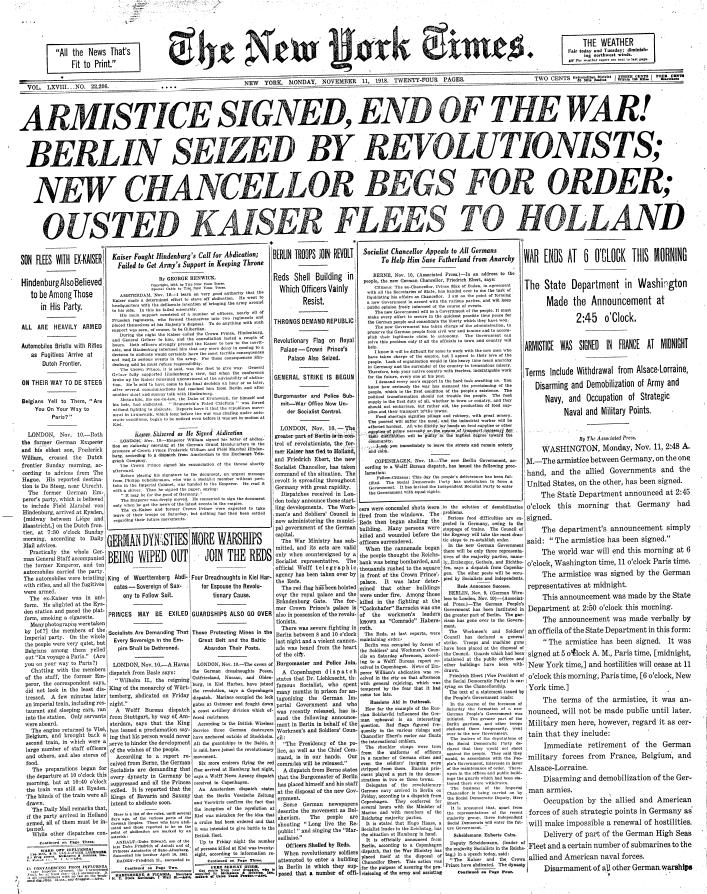
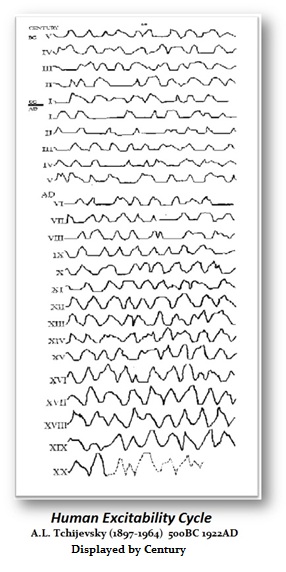
By 1900, the investigations into sunspots by the Russian scientist Tchijevsky began to explore the connections between solar variations, weather, and their impact on human activity. During World War I, Tchijevsky noticed between 1916 and 1917 (the period of peak sunspot activity and the solar explosions that followed) how these correlated with the war. He compared this with events in history to ascertain whether there was any connection. The historical database of 500 BC–1922 AD (a period of 2,422 years) that covered 72 countries was compiled (Tchijevsky 1938). He included in his compilations signs of human unrest and excitability such as wars, revolutions, riots, expeditions, and migrations.

Tchijevsky included additional factors, such as the number of humans involved, the quality of the event, and the size of the area affected. Additionally, he included the time when the unrest began, and its high point, which was reduced to arithmetical values of varying significance. With his volumes of data, Professor Tchijevsky constructed a year-by-year Index of Mass Human Excitability that covered the past 24 centuries in an amazing panorama of man’s emotional moods. After evaluating the most important events, Tchijevsky noticed that the most important human events had occurred during 80% of the maximum sunspot activity (Tchijevsky 1938).

The only problem with Tchijevsky’s work was still the one-dimensional thought process of trying to discover the single cause to the effect. The actual results are far more complex and dynamic. Yet Tchijevsky made a major contribution in investigating sunspots. Combining this data with ice core samples broadens the scope and now we begin to see climate take shape.

Additionally, we have to inject disease, plagues, and pandemics. When we add this data, we then begin to see it is the lack of sunspot activity that leads to disease, plagues, and pandemics. This, in turn, feeds migrations and was a leading cause of the invasion of Europe by the Huns. However, it was the Huns pushing West that drove the Goths to invade Rome.

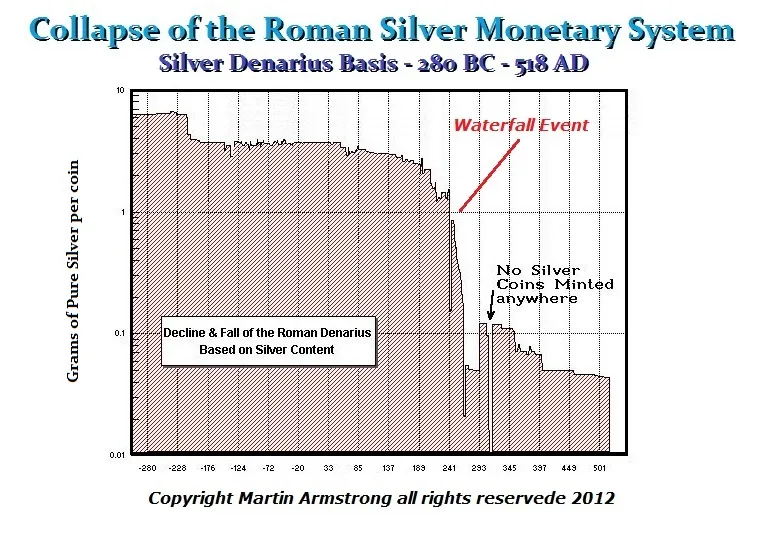
Is the decline of the Roman Empire was in part also caused by climate change. Scientists have used tree rings to catalog the climate’s history. In fact, trees grow more during fertile years that result in thick tree rings. During dry years, trees rings grow far more narrowed and thus identify the climate cycle. Wood samples from sites throughout Europe collected from ancient Roman ruins have revealed that the Decline & Fall of the Roman Empire coincides with a period of unusually thin rings implying cold and dry periods.

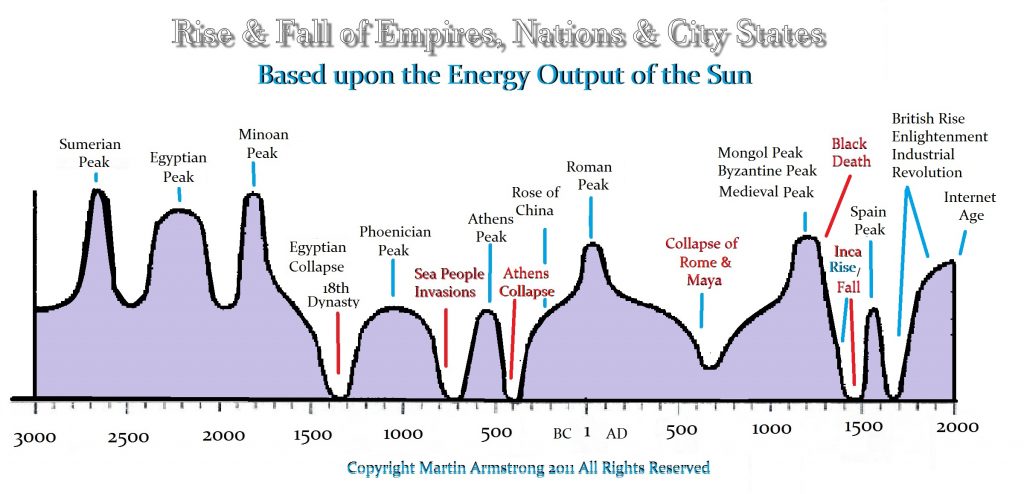
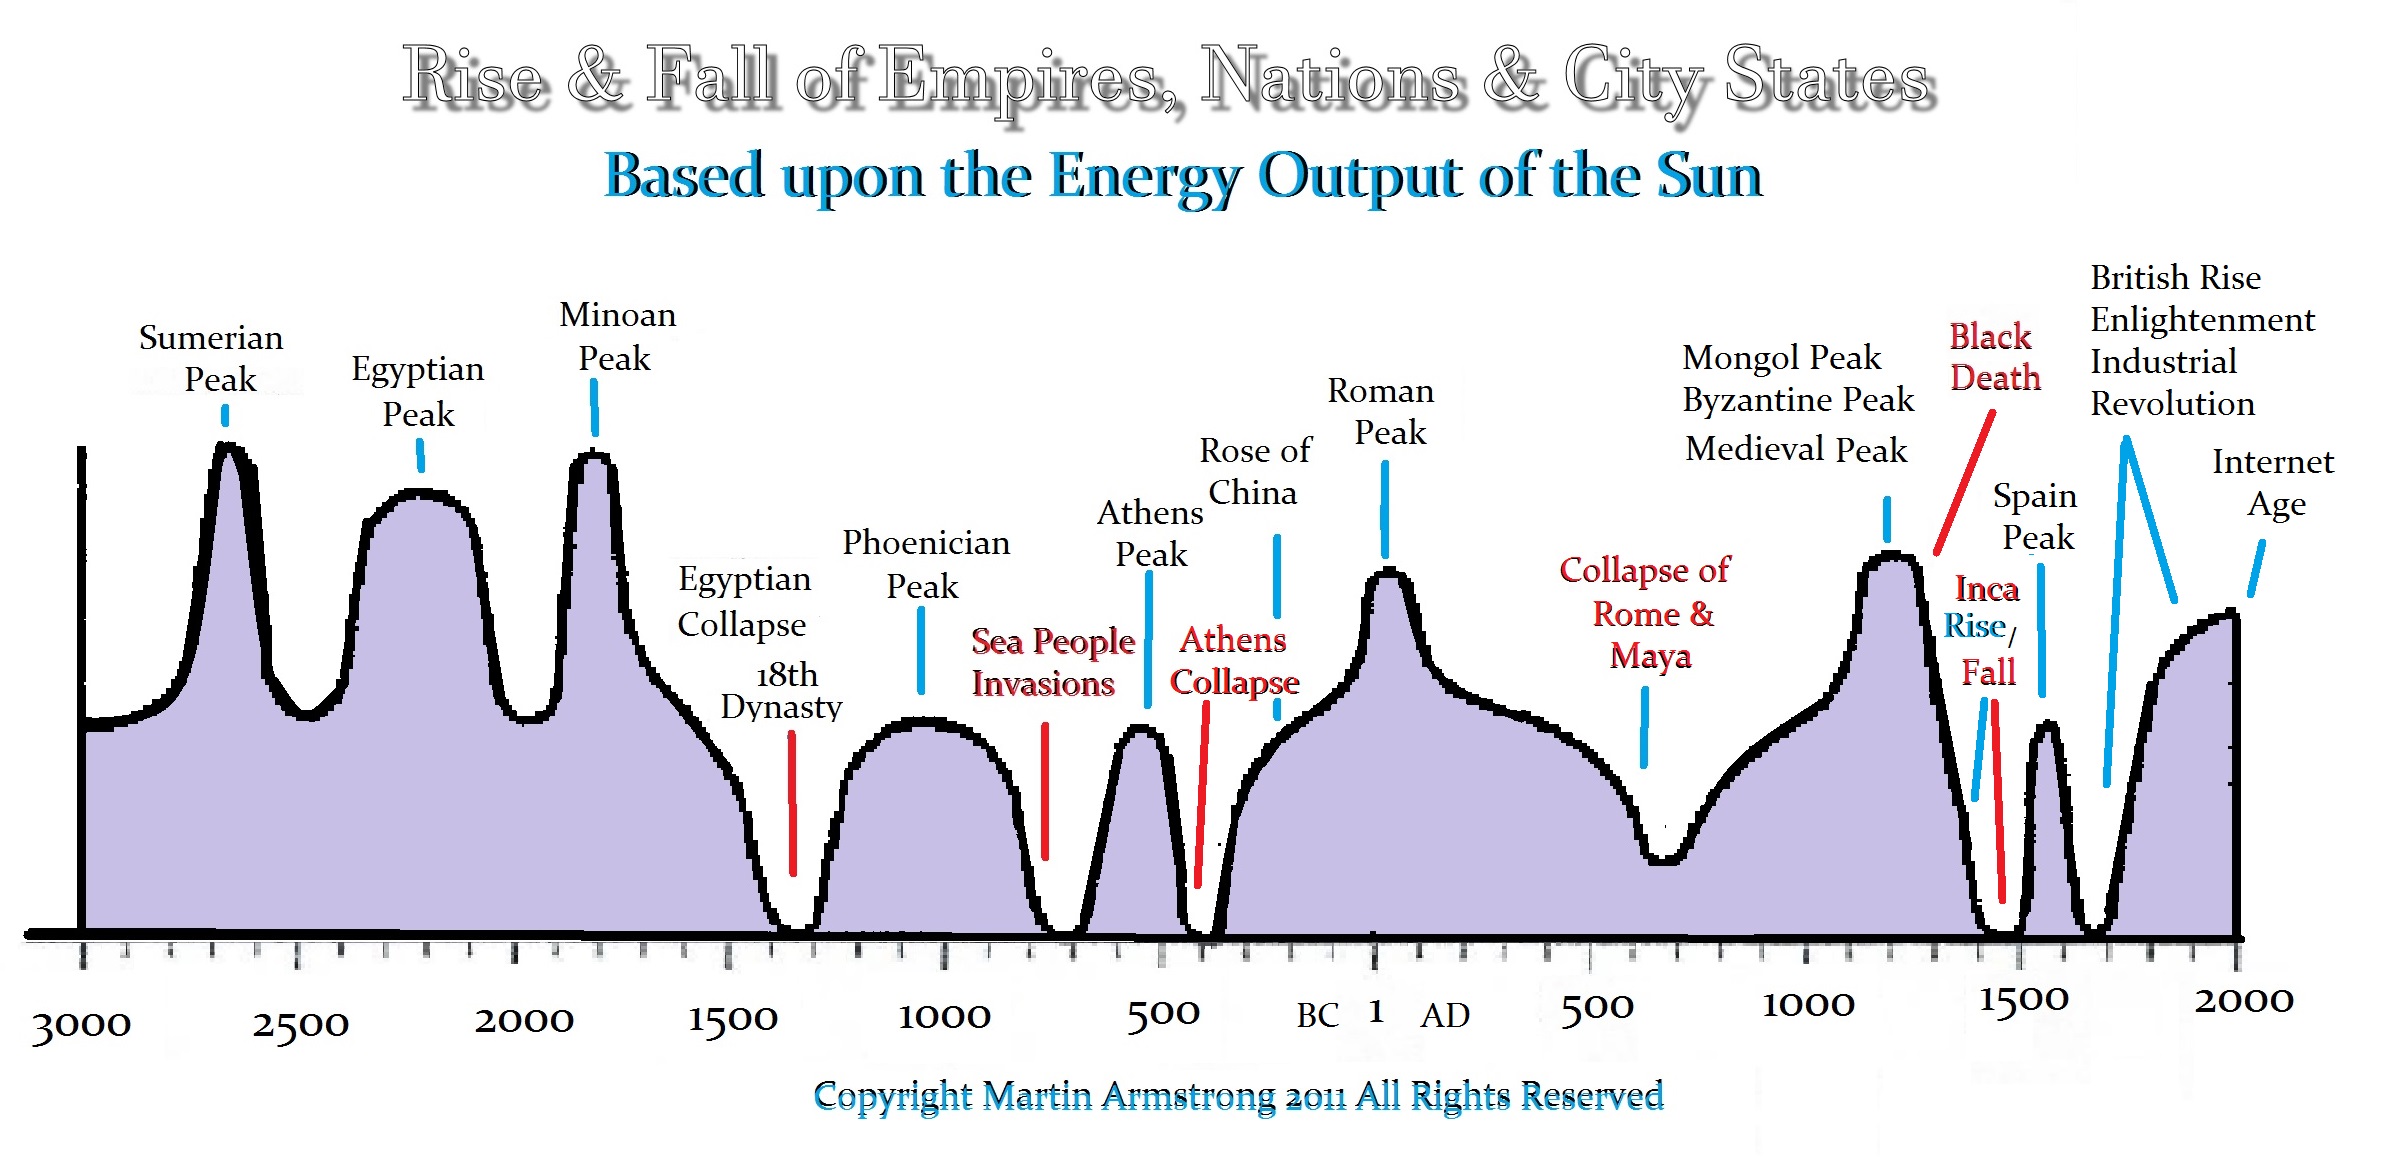
Correlating all the data from tree rings to ice cores and sunspot activity, what is clear is that society expands with Global Warming and collapses during Global Cooling. Voting for some political party (left or right) cannot change the climate. Politicians cannot even balance a budget, so they can play God?

Wet and warm summers occurred during periods of every expansion of civilization be it Sumerian to the modern Internet Age. The decline in the energy output of the sun is lethal to civilization. This contributed to the Decline & Fall of the Roman Empire that was already economically weakened. The climate turned down from about 200AD and bottomed around 600AD.

The dry and cold period of the 3rd Century AD coincided with the economic decline of Rome, but it also provided the reason for the barbarian invasion. This led to the economic and political turmoil that resulted in the barbarians invading the northern provinces including Gaul. Once again, climate change was not the sole cause of the decline and fall. This contributed to the cause behind the barbarian invasions.

There were two major plagues that became pandemics during the Decline & Fall. There was one right following the top in about 180AD known as the Antonine Plague. But this was followed by Plague of Cyprian in the middle of the turbulent 3rd century and then the 6th-century Plague of Justinian, which may have finished the job. The ancient sources make the Plague of Justinian sound apocalyptic. The death toll in Constantinople was horrific died by the tens of thousands per day. The Emperor Justinian appointed a special officer, by the name of Theodore, in charge of coordinating the removal of corpses from the city’s streets. Theodore created mass graves with each pit filled with 70,000 corpses. We do know that archaeologists have assumed that mass mortality events go hand in hand with large, communal burials. The Justinian Plague appears to have resulted in a death toll of 35-55% of the population within just a few months during 555 AD quite similar to the Black Death of the 14th century.

Mass graves have been discovered concerning the Plague of Cyprian, in Egypt and Rome. The Plague of Cyprian (the Carthaginian bishop and eyewitness for whom the plague is named). Here the Plague began in Ethiopia around Easter of 250AD. It reached Rome in the following year by travel through trade and spread to Greece and then onto Syria. The plague lasted for about 20 years. At its peak, it was reported to have killed as many as 5,000 people per day in Rome.

Periods of drought, cold, floods, and famine exhausted the populations of the Roman Empire. St. Cyprian (200-258AD), bishop of Carthage, said at that time that it appeared as if the world was at an end.

There have been several protracted solar minimums since 1000 AD:

  1. Oort minimum (1040–1080 AD)
  2. Medieval Minor minimum (1150–1200 AD)
  3. Wolf minimum (1270–1350 AD)
  4. Spörer minimum (1430–1520 AD)
  5. Maunder minimum (1620–1710 AD)
  6.  Dalton minimum (1787–1843)

This post-Dalton minimum peaked strangely with the Economic Confidence Model 1989.95. The peaks in solar activity have been declining with each wave subsequent to that turning point. It is now declining faster than ever previously know for nearly the last 10,000 years. So keep an extra supply of canned goods. They might come in handy.

Universal Basic Income – Insanity or Rational?


QUESTION: What is your opinion of Elon Musk and Mark Zuckerberg idea of universal income?

ANSWER: The idea of free money being touted by Elon Musk and Mark Zuckerberg only demonstrates that they know nothing about humanity or economics. They see universal free money as a cushion for workers whose jobs might be replaced by automation or robots. They argue that free money could provide workers with the flexibility to retrain for a new career, pursue creative interests, or start their own business.

If we are talking about a temporary benefit during a retraining period, then that is an entirely different idea from a universal basic income guarantee. You can drive down the streets in New Jersey and you see hand-made signs posted that they pay cash for diabetes medical material handed out free by the government. They also sell food stamps. You cannot change humanity. Some people will obey the rules and others will circumvent them.

The last thing you want to do in society is provide to the population some sort of guaranteed income where people can stay home and do nothing. This will foster the same hatred of anyone who works and has more than they do and it will promote hatred and class warfare.

When the automobile was invented, that displaced people who were carpenters making wagons. When the Dust Bow hit during the Great Depression, it added to the displacement of farmers. The tractors replaced people tilling the soil just as the cotton gin replace slave labor in the South. Technology will always replace workers and the greater the tax burden, the greater the incentive to replace workers.

Neither Elon Musk nor Mark Zuckerberg has any clue about economic history for if they did, they would understand that technology always advances and displaces segments of the workforce. This is also one reason governments like war to thin the herd when unemployment rises.

Providing free money is actually an experiment in Finland. It began one year ago taking 2,000 unemployed Finns who were randomly selected from across the country for a trial testing universal basic income. Each month for two years they would receive €560 euros from the government, tax-free. They can spend the money however they decide. The plus of this program is the reduction in bureaucracy. As I said, the US government hands out food stamps but people sell them. From an economic standpoint, this system is less costly than the current one in play with bureaucrats determining what they will allow people to have or not. The full report on the Finland experiment will not be issued until the 2-year program is complete after January 1st, 2019.


Bitcoin Still in Trouble


The rally in BitCoin was a perfect 13 weeks up from the last strategic low. It peaked with the Weekly Array the week of 12/18 which was both a Panic Cycle and a Directional Change. However, with the impending ban in South Korea on trading cryptocurrencies, the high of December appears to be at least an important temporary high. A weekly closing back below 9425 will ten to confirm the end of the bull market for now.

South Korean plans to restrict cryptocurrency trading. Bitcoin investors saw the collapse to $13,600 from the previous day trading at $16,500 dollars. South Korea, one of the world’s most important countries for virtual currency trading, wants to ban the opening of anonymous accounts for cyber currencies, among other things. There will also be a new law that will allow regulators to close stock exchanges where Bitcoin & Co. is traded under certain circumstances. “We share the view that cryptocurrency trading is irrationally overheating,” the government said. “We can no longer tolerate this abnormal speculation.”

Nearly a million people are estimated to own Bitcoin. South Korea is very important because it represents around one-fifth of Bitcoin’s global trade. Regulation by South Korea is extremely important. Even the German financial supervision warns that the risk is total loss for investors. Many view this as if it were the Dutch Tulip Bubble since BitCoin cannot be used in the economy in a fair and orderly manner.

Understanding Cycles & Dynamic Inter-connectivity


COMMENT: Mr. Armstrong; I really do not think the world respects your work. I read on your blog there was going to be a bad flu from Australia that would hit Britain. Then a few days later, the headline here is all about what you forecast. You really have to go public and let people support your work in a meaningful way. The world really does need to listen.

All the best from your former home.

EB

REPLY: I understand. I get a lot of emails on this subject. The world is not ready to understand cycles. All the methods of analysis are generally wrong. All the analysts who try to compete with me do so on an OPINION basis, not methodology. They offer their OPINION and pound their chest. This is not about OPINION. This is about global correlation. We all have opinions and they are never 100% perfect. There have been times my personal “opinion” has been proven wrong by Socrates. This is why I always try to make sure “opinion” is separates from a forecast.

How many times have we heard some food is bad for you and then they reverse it a decade later? The standard method of analysis is always trying to reduce everything to a single cause of action. That methodology is lethal to knowledge and the future. It blocks our advancement in every field of science like Global Warming. Let’s see, it has gotten warmer in the past 25 years so that must be because of cars. They start with that assumption and never test the data before 1850 because there were no cars then. Why bother? We know the cause is cars, they say. So look for data to prove the assumption.

This to me is absurd. You can also say everyone who has ever eaten a carrot had eventually died and that means carrots must be long-term deadly. It was assumed that illness was in the blood. So the logical conclusion was to bleed people. If they died, it was never because they took too much blood, but they did not bleed them soon enough.

I just am tired of beating my head against a brick wall. Society has to break and only then will we look to new dynamic interconnectivity that is the path to understanding. There are those in New York City who just cannot stand what I do. They refuse to consider there is a methodology at issue here and prefer to blame me the messenger claiming I have too much “influence” and that is why they are wrong. They would try to kill me if they could since they tried that one before but I survived. Why admit you may be wrong when you can blame someone else for your failures? That, unfortunately, infects a large part of humanity.

Going public is the only way to preserve this research and push it forward for posterity. I have not changed my mind. We were granted our business license in China. It took three years of investigation and that is by no means an easy accomplishment. So we now have the seal of approval from China and that will be the biggest market the other side of 2032. Now we are getting closer to going public

Why Models Fail


QUESTION: Mr. Armstrong; Did AIG use the Black-Scholes Model and that is what created the crisis again in 2007?

WJ

ANSWER: No. It’s my understanding that AIG developed different models, they called a “Value-at-Risk Model,” (VaR) which used a binomial-expansion-technique to start valuing their positions. I believe the original model was developed at Moody’s. However, like the Black-Scholes Model, it too lacked depth. In model development, it is extremely complex.

Virtually every model created tends to be predominately flat with a minimum of dynamic variables lacking understanding of TIME. Then the testing period lacks the database reflecting all conditions. In the case of Black-Scholes, they back-tested only with data to 1971. If I created a model with only data from 2009 forward, then it would be biased to presume a bull market is normal in the stock market.

The Value at risk (VaR) model is a measure of the risk of investments. It estimates how much a set of investments might lose, given normal market conditions, in a set time period such as a day. VaR is typically used by firms and regulators in the financial industry to gauge the number of assets needed to cover possible losses. It obviously failed in 2007-2009 because once again it was not a “normal market condition” for it fails utterly to understand CONTAGION when sound assets are sold to raise cash for other assets that collapse. The assumption of the model is its own nemesis.

For example, if a portfolio of stocks has a one-day 5% VaR of $10 million, this actually means that there is a 5% probability that the portfolio will fall in value by more than $1o million over a one-day period if there is no trading. Therefore, a loss of $1o million or more on this portfolio would be expected on 1 day out of 20 days given a 5% probability. A loss which exceeds the VaR threshold is termed a “VaR breach“.

So you can see, such models are incapable of determining TIME and as a result, they will always fail during a CONTAGION that they cannot see coming.

This is why the bulk of portfolio models fails during a financial crisis. This is also why some of the top Institutional portfolios come to our firm because they have realized that only TIME determines the success of any model and making broad assumptions of probability have ALWAYS failed. If you cannot model TIME and CONTAGION, you will be wiped out during a crisis and VaR will fail just as Black-Sholes.


The Coldest New Year – Ever?


NASA’s photo of the Blizzard of 2018 shows just how cold this season is turning into. I have made it clear I moved from New Jersey to Florida trying to get closer to REAL Global Warming. Our computer, which correlates absolutely everything in all fields, forecast that this would be the coldest winter many have felt in their lifetime.As NASA wrote: “While the cold streak has not broken all-time records, it is breaking records for individual days.” It has made all-time records for most people’s lifetimes and that is cold.  Even here in Florida, it is down into the 50s (10-12 c) and that is about 10 degrees below normal.

It certainly gives me no pleasure to make such forecasts. But the sun is turning down in energy output and the Global Warming crowd is committing a heinous offense for their nonsense has distracted society from the real danger – Global Cooling. Correlations between temperature and disease are 100%. Turn down the temperature and you get an increase in pandemics.

What you also get is rising civil unrest that often manifests also into revolution. It was the 1918 pandemic that killed so many people and that same year stood witness to revolutions. It was the revolution in Germany during 1918 which installed the Weimar Republic and as capital fled, the government was left with nothing but paper to print currency to make reparation payments. So 1918 was a major event in politics as well as disease.

I suppose if Dick Cheney were still the real president, he would announce this cold weather is created by Russia and a secret machine to justify invading Canada, nuke the Northern Territories to warm things up a bit, and then hand all the natural resources to Haliburton.

What Did the Pivots Confirm or Deny for 2017?


QUESTION: Marty; At your training seminar you did a couple of year’s ago, you said your pivot numbers will confirm or deny a high. What was the status on the Pivots in the Dow for the close?

PS Another training session would be nice.

GD

ANSWER: The 2006 closing was 12463.15 and the Pivots were 10949.43, 10727.38, and 14234.29. We closed above two and below one leaving the market still bullish looking to higher prices. Then 2007 closed at 13264.82 and now it was below two 13836.74, 10727.38, and 14234.29. The high for that year came in at 14198.10. So we closed under two and above the lowest which indicated it was then turning bearish into 2008.

The 2017 Pivots were 21982.03, 1528.79, and 22282.07 with the closing coming in at 24719.22. Here we closed above all three Pivots indicating it is still long-term bullish. Looking at 2018, the Pivots move to 20202.77, 27434.90 and 28054.53.

We warned back in October 2014: “[W]e are looking at a rally into 2017-2018 with the Dow reaching the 25,000-28,000 level. ”

We can see that we have reached the beginning of our Pivot projections made 10 years ago for this time period. This suggests CAUTION and with our volatility models turning up and a Panic Cycle for 2018, this is not going to be a walk in the park. This will take a lot of skill to trade this one. No emotions and no preconceived expectations. We have to play this by the numbers and cycles – no choice. This is not the time for boasting opinions.

If I have time to do a training session again I will let everyone know. The seat price of $5,000 last time because it is a lot of work and we have to keep the audience in a more intimate session.