New mortgage originations have reached their lowest level since Q2 of 2014. Inventory remains historically low, shelter costs are historically high, and it makes no sense for most to refinance with current mortgage rates over 6% on the 30-year. Originations, including refinances, came in at $323.5 billion during Q1 of 2023. The NY Fed reported that borrowing in general has reached $17.5 trillion, a $150 billion increase, as families grapple with inflation. The refinance boom in 2020 and 2021 will impact real estate for generations to come.
The NY Fed discusses the COVID refinance boom (Q2 of 2020 to Q4 of 2021) in a recent article. Fourteen million mortgages were refinanced during this period when mortgage rates reached record lows. Mortgage rates plummeted 200 bp from Nov. 2018 to November 2020. The last upticks in refinances occurred in 2003 and again in 2013 when rates also fell 200 bp. However, rates were at their lowest level during the COVID refinance boom, allowing many to take out equity from their homes and reinvest. Home equity reached a record high in the time leading up to the pandemic, and the continued rise in home prices provided numerous owners with additional equity.
One-third of all outstanding mortgages were refinanced over the span of 7 quarters. About 64% of refinances were “rate refinances,” classified as those with a balance increase of less than 5% of the mortgage amount. Those who chose this route saved an average of $220 per month. Cash-out refinancers took out $82,000 on average, increasing monthly payments by $150. Around 5 million borrowers extracted a total of $430 billion during the COVID refinance boom—a significant sum.
The 9 million who did not extract equity reduced mortgage payments by $24 billion annually. These figures are something I do not expect to see again in my lifetime. Those holding their breath for rates to drop under 3% again should come up for air. Homeowners are disincentivized to sell at current rates, not to mention home prices are AT LEAST 36% higher than before the pandemic. Everyone’s investment strategy is unique, but those who were able to use their home’s equity to invest during the bottom of the market made out well. The period between Q2 of 2020 to Q4 of 2021 will be a reference point for years to come.
COMMENT: Mr. Armstrong; I think it might be helpful to explain to people that the government can subpoena any third party with regard to cryptocurrencies and they will turn over whatever they have that will incriminate a person. As a lawyer, I have to defend a client who thought Bitcoin was exempt from central banks and totally safe. He even seemed to think if there was a nuclear war that Bitcoin would still exist in South America. Some people are just so gullible it is sad and now he faces several years in prison for tax evasion. Perhaps it would help to explain how a third party will turn over whatever they have on you and that includes Google etc.
Many people listen to you because you are not a conspiracy junkie.
All the best
WH
ANSWER: You have a good point. DO NOT even allow Microsoft One Drive to have anything. The government will subpoena any third party and they will give up everything. I do not understand why people are such diehard Bitcoin lovers. ANYTHING that will be on the power grid the government will control if you believe it or not.
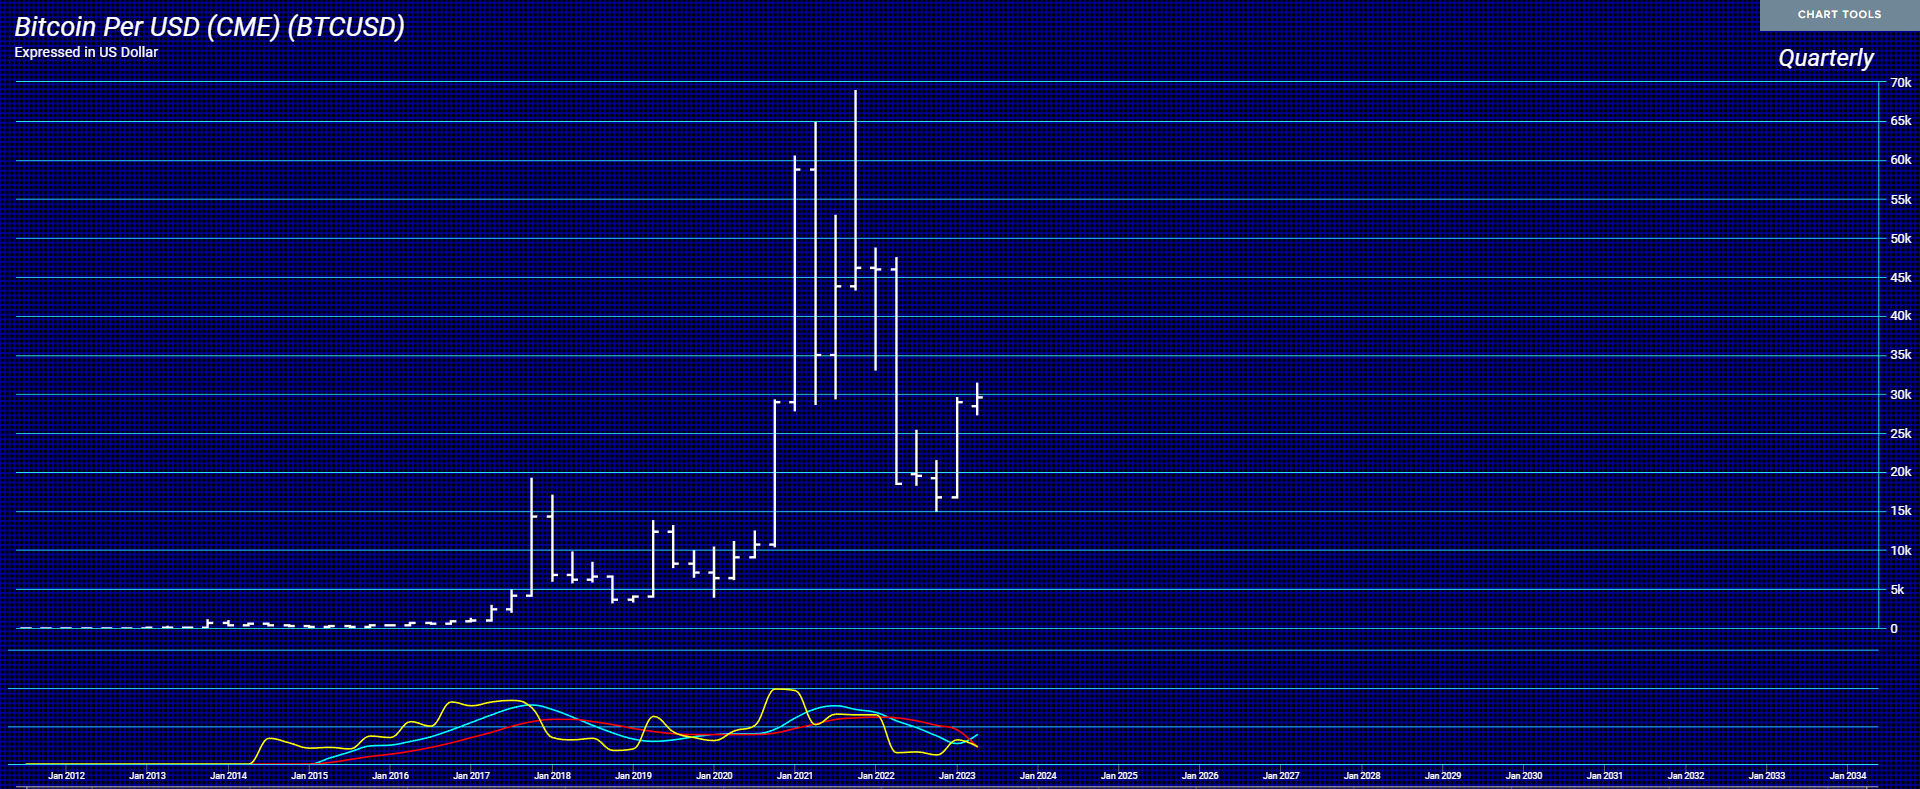
Bitcoin is a TRADING vehicle no different from cattle. It is NOT a store of wealth, as it fluctuates like everything else. This is a quarterly chart of Bitcoin. It rises and falls no different than any other instrument. It is not a “store” of value maintaining some constant value to park your money.
ALL cryptocurrency is on the target list for the Biden Administration. We are entering the final stages of the Decline & Fall of Western Civilization. You can see as we progress, they will become more and more aggressive because they can feel their power slipping away. ONLY tangible assets make the transition to the new value on the other side of 2032. NOTHING digital will make that transition.
Both the United States and Europe will split. That means the rules will be different everywhere, and there will be places without power. No power = no value for any digital currency. Let’s get realistic here.
Inflation was only 1.4% when Biden took office. He began implementing policies on his first day that directly created the energy crisis in the US. He refused to reopen the economy under the pretense of COVID for as long as possible, disrupting the supply chain and damaging small businesses. Biden has created multi-trillion dollar spending programs that saddled the nation with more debt and increased price volatility. His team has been working to divide the people and create civil unrest. I could go on about his failures, but his worst move was involving America in the Russia-Ukraine war. Inflation has steadily risen to unsustainable levels nearly every month since Biden took office.
Biden’s team toys with the numbers to tout that inflation has gone down, but they are comparing the high and low both created under Biden. Wages cannot support the increase in costs and absolutely no one is better off under Biden. Considering the dire situation, it is infuriating that the US had a 1.4% inflation rate not long ago.
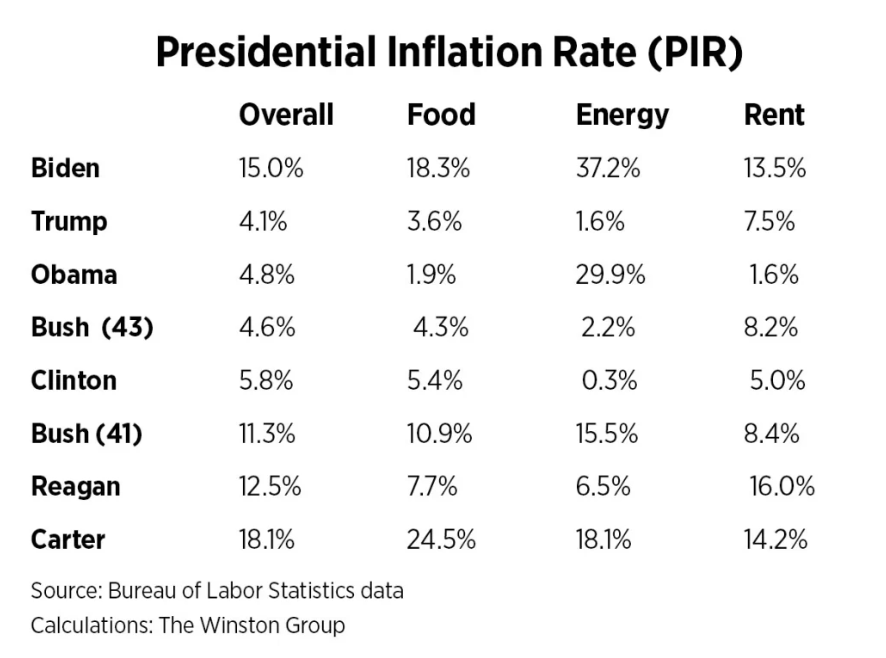
Inflation has soared by over 15% since Biden’s inauguration in January 2021. The “Presidential Inflation Rate,” (PIR) developed by the Winston Group, measures a president’s progress in handling inflation over time, from their inauguration month to the month of the most recent CPI report. As of March, inflation under Biden is 15%, which makes him the most inflationary president since Carter. Biden’s 24% “Presidential Inflation Rate” for rising electricity costs is higher than any of the previous seven presidents as it is now up 37.2%. The cost of food rose 18.3% under Biden, and eggs alone have soared by nearly 80%. Shelter costs are now at a 42-year high, and Biden’s PIR for rent has surpassed 13.5%.
Joe Biden takes no responsibility for the inflation caused by his policies and failures as a president. Inflation will continue to increase under Biden. He has absolutely no plans to address the issue, and the legislation he creates to address the problem only exacerbates it. Biden is a corrupt politician who lines his pockets with money from Ukraine and China. The investigation into his crime family that the media is sweeping under the rug reveals the truth. This man needs to be removed from office immediately, but the people alone must decide when they’ve had enough.
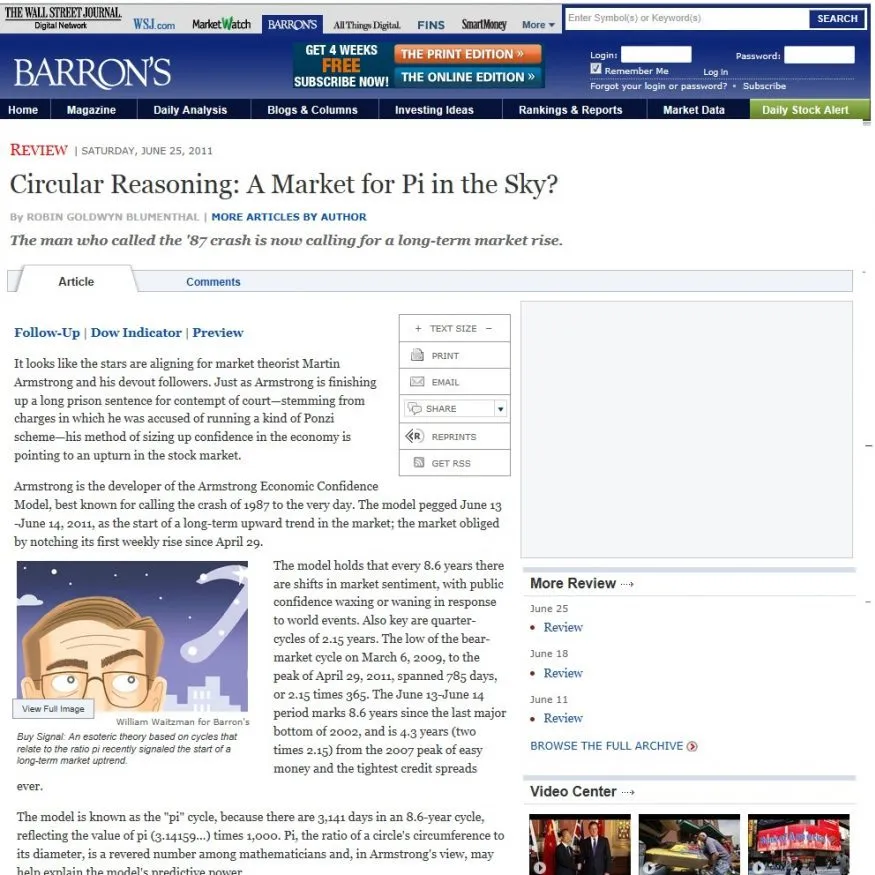
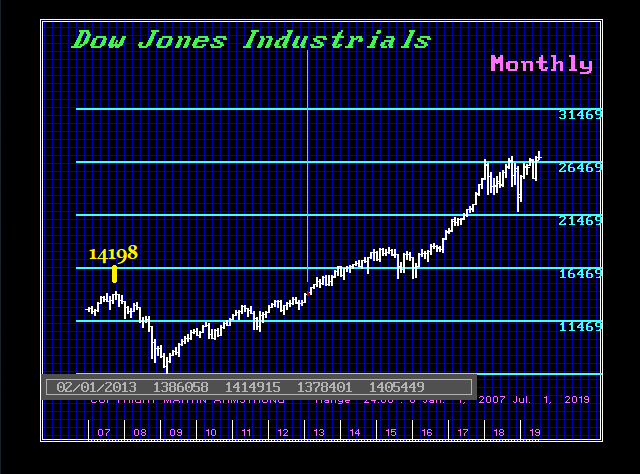
In 2010, Barron’s wrote a piece on me effectively laughing at my forecast that the share market would rally to new highs. What seems to inevitably unfold is this notion that whatever the event might be in motion, the mere thought of a reversal in trend appears impossible. When the press disagrees with Socrates, I know it will be the press who is wrong. And because they end up being wrong, of course, they cannot print a retraction so they will just pretend you do not exist rather than admit – Sorry, we were wrong. The Dow made that new high above 2007 by February 2013. That was 64 months from the October 2007 high.
I have been in the game for many years. With each event, it appears to be like Groundhog Day. They pop their heads out and declare they do not see their shadow, so the entire world will disintegrate and that is always based upon opinion. It is never backed by real analysis. Just the standard human trait of assuming whatever trend is in motion, will remain in motion.
Being an institutional adviser, I have never had that luxury. We have had to deal with some of the biggest portfolios in the world. They want accurate forecasting, and it has to be long-term – not day trading. They are not interested in the typical headlines of doom and gloom that the press love to print with every financial event simply to get readership. That is all they care about. It has been the financial version of the fake news.
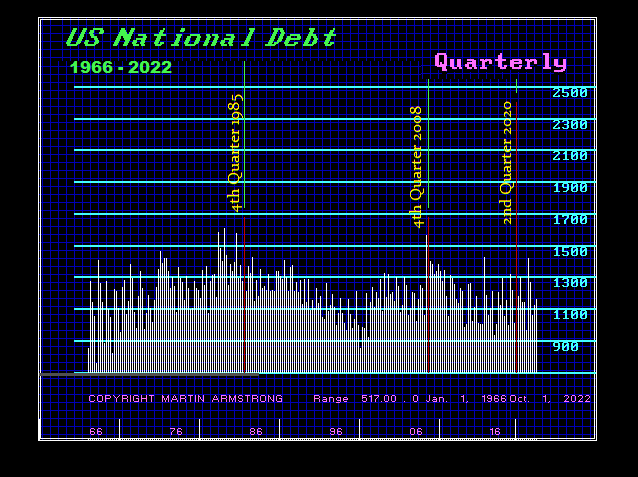
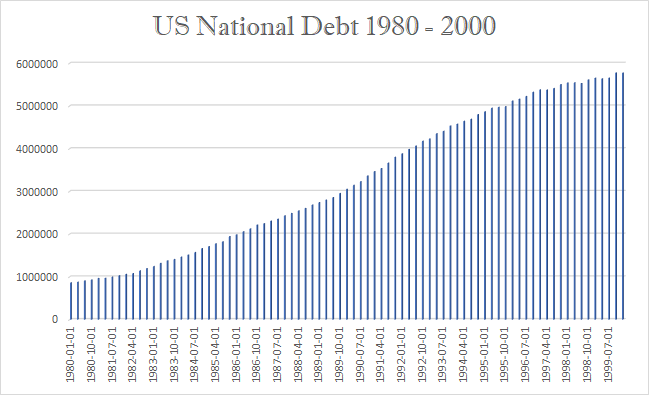
When we step back and look at this favorite fundamental that people beat to death to predict the end of the world, the national debt, and the collapse of the dollar. Little did they know that the increase in National Debt during the 2007-2009 Financial Crisis was supposed to bring down the sky and end the existence of the dollar. We can see the sharp rise in debt simply made a double top with the Financial Crisis of 1985.
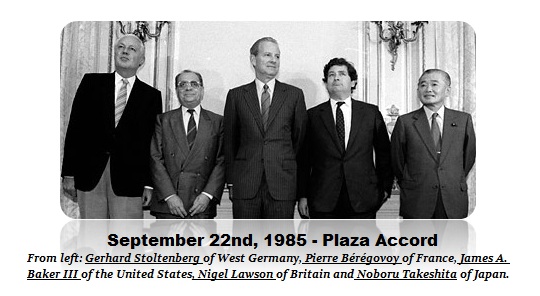
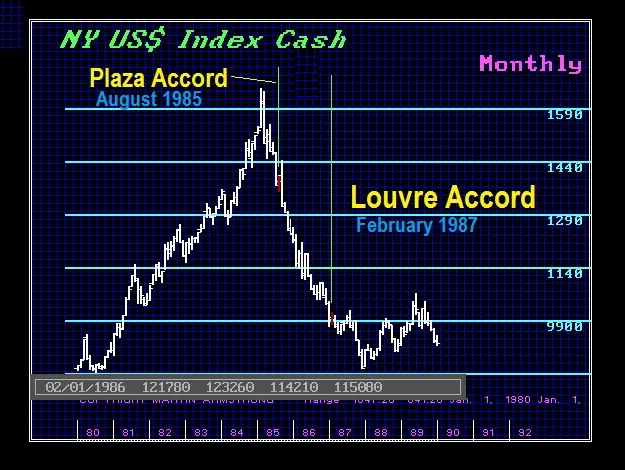
It was that previous 1985 Financial Crisis that set in motion the Plaza Accord which brought together the central banks creating what was then the G5 – now G20. Of course, like every government intervention, the side effect was the 1987 Crash and their attempt to reverse their directive at the Plaza Accord became the Louve Accord. When the traders saw that failed, the collapse in confidence led to the 1987 Crash.
It has always been a CONFIDENCE game as I pointed out with the 1933 Banking Holiday previously. In this case, the failure of the Louvre Accord which came out and said the dollar had fallen enough, once new lows in the dollar unfolded and the central banks could not stop the decline, led to financial panic by 1987 which manifested in the 1987 Crash.
This chart shows the quarterly change in the National Debt since 1966, Here you can see the 1985 and 2008 Financial Crises were on par. Neither one ended the dollar no less the world economy. So when I warned the share market would rally and make new highs and Barron’s laughed in 2010, I said the same thing after the 1987 Crash and people laughed.
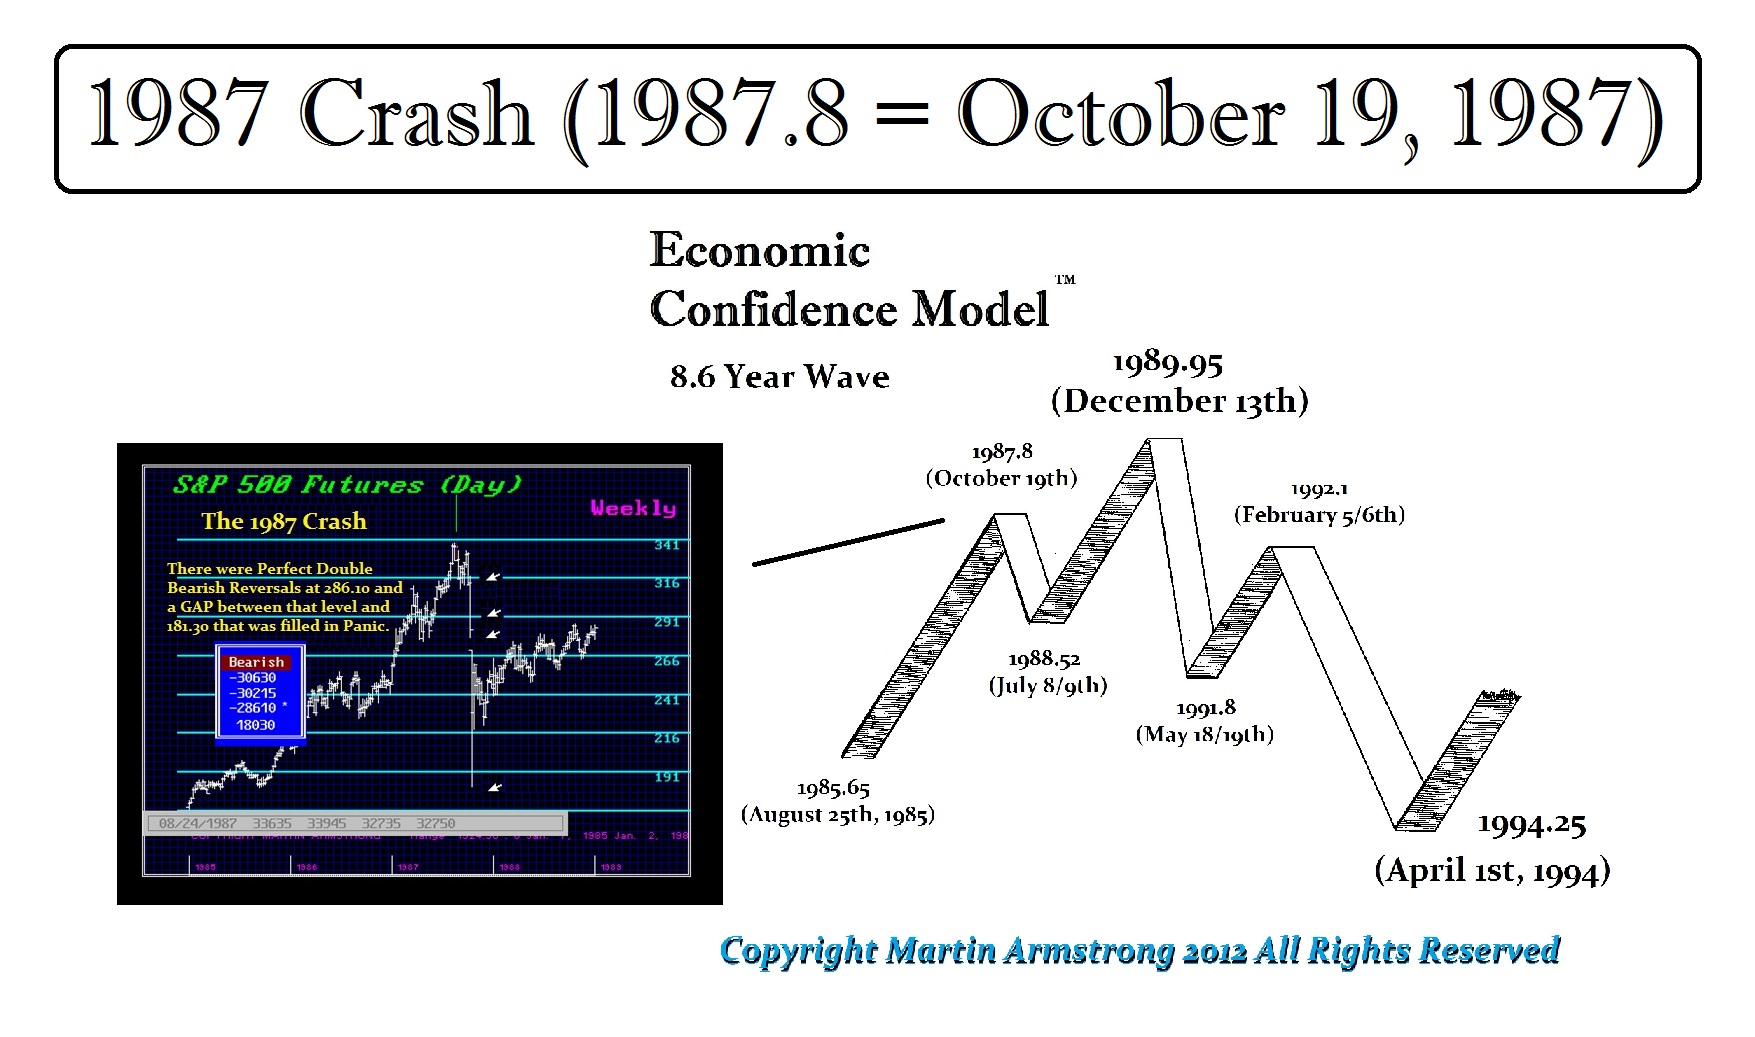
In fact, on the very day of the low, I said this was it and that we would rally back to new highs by 1989. That was perfect and the market responded to the Economic Confidence Model (ECM) which has been published back in 1979. This was more than simply forecasting the 1987 Crash and the very day of the low. It clearly established that the ECM had revealed that there was a secret cycle behind the appearance of chaos even in economics.
Larry Edelson was actually a competitor at the time. But Larry respected that the forecast from the model was far beyond what people would ever expect. If we are ever going to advance as a society, we have to stop the bullshit and understand HOW markets trade and WHY. Larry did that. He understood that the model was something larger than just personal opinion.
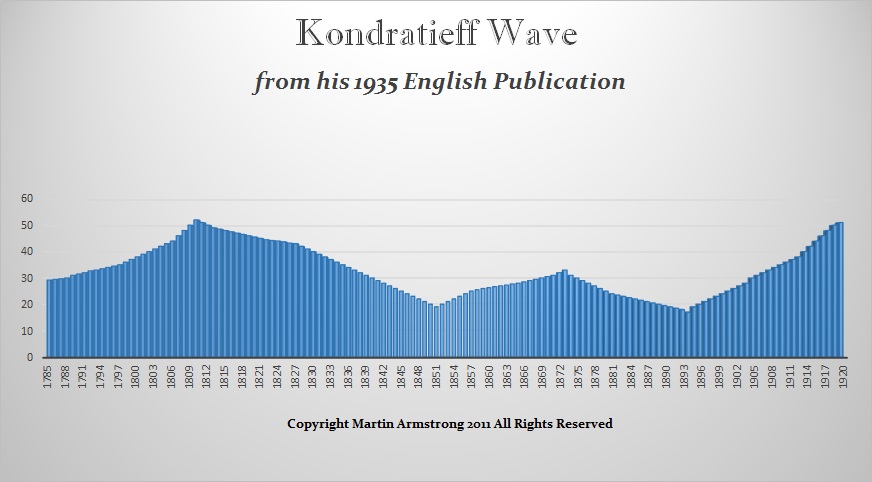
Even those claiming to be using the K-Wave cannot make real forecasts. The basis of Kondratieff’s argument came from his empirical study of the economic performance of the USA, England, France, and Germany between 1790 and 1920. Kondratieff took the wholesale price levels, interest rates, and production and consumption of coal, pig iron, and lead for each economy. He then sought to smooth the data using an averaging mathematical approach of nine years to eliminate the trend as well as shorter waves. Kondratieff thus arrived at his long-wave theory suggesting that the economic process was a process of continuous waves of boom and bust.
Kondratieff’s work was compelling and contributed greatly to the Austrian School of Economics that first began to develop the concept of a Business Cycle. The general central principle of the Austrian Business Cycle Theory is concerned with a period of sustained low-interest rates and excessive credit creation resulting in a volatile and unstable imbalance between saving and investment. Within this context, the theory supposes that the Business Cycle unfolds whereby low rates of interest tend to stimulate borrowing from the banking sector and thus then result in the expansion of the money supply that causes an unsustainable credit source boom which leads to a diminished opportunity for investment by competition.
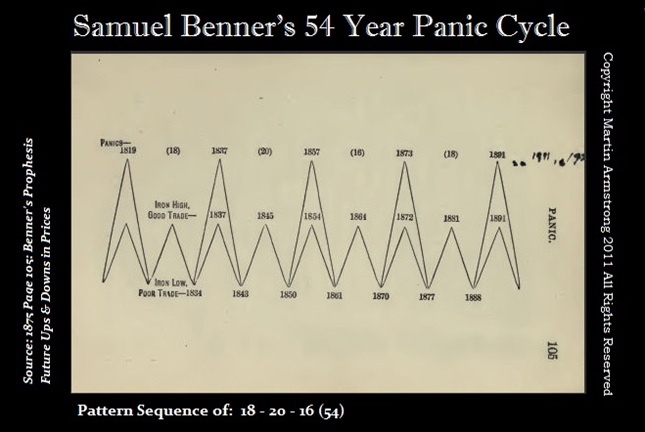
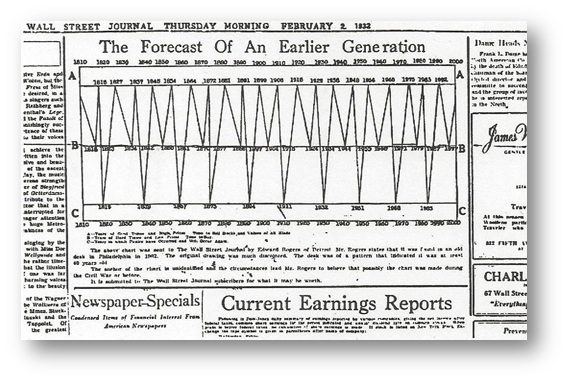
Here is a chart of the business cycle that was created by a farmer named Samuel Benner. Benner based his work on Sunspots, which actually incorporated solar maximum and minimum that today’s Climate Change zealots refuse to consider. Nevertheless, someone manipulated Brenner’s work and created a chart to try to influence society handing it in with a wild story to the Wall Street Journal published this cycle on February 2nd, 1932, when the market bottomed in July 1932. Still, nobody knew who had investigated this phenomenon in 1932.
When I was doing my own research reading all the newspapers to understand how events unfolded, I came across this chart. I found it interesting that during the Great Depression people were reaching out and some began to embrace cyclical ideas. The problem with both Kondratiff and Brenner was that the period they used to develop their cycles was the 19th century because the real Industrial Revolution was unfolding and in the 1850s, 70% of the civil workforce were all in agriculture. Consequently, if you constructed a model based entirely upon one sector, it would work only as long as that sector was the top dog.
Being a historian buff, it quickly hit me that NOTHING remains constant and that the economy will ALWAYS evolve, mature, and then crash and burn. Where agriculture was 70% of the workforce in 18590, it fell to 40% by 1900, and then down to 3% by 1980.
Just look at energy. The earliest lamps, dating to the Upper Paleolithic, were stones with depressions in which animal fats were burned as a source of light. In cultures closer to the sea, they began to use shells as lamps which they would burn at first animal fat. Clay lamps began to appear during the Bronze Age around the 16th century BC and the invention quickly spread throughout the Roman Empire. Initially, they took the form of a saucer with a floating wick.
We even find Roman oil lamps as luxury items crafted out of bronze. There are collectors of terracotta oil lamps for there is a vast variety of motifs. There is everything from dolphins, and various entities, to erotic oil lamps, which may have been used in brothels. The point is, if you constructed a model on oil, you would have surely accomplished similar results to Kondratief and Brenner.
Then of course, just as the energy moved from animal fats to vegetable oils, by the 19th century it returned to whale oil which was extracted from the blubber. Emerging industrial societies used whale oil in oil lamps and to make soap. However, during the 20th century, whale oil was even made into margarine.
Then the discovery of petroleum and the use of whale oils declined considerably from their peak in the 19th century into the 20th century. Ironically, it was fossil fuels that probably saved whales from extinction. Hence, now we are entering a period where they deliberately want to end fossil fuels and move to solar and wind power. Obviously, just a cursory review of energy reveals the problem of basing a model on the current energy source or major economic industry. Things change with time.
Honest journalism has become a crime. I have appeared numerous times on Maria Zaric’s program, Zeee Media. Maria is a professional journalist who asks thought-provoking questions to the experts that appear on her show. Her content goes against the grain and traditional narrative. The Australian-based journalist has been questioning COVID, the Great Reset, governments, globalists, the war in Ukraine, and many other topics that are completely taboo in the mainstream media. They attempted to shut down her channel in the past. Now, she has been de-banked with no explanation.
“Do you shut down peoples accounts due to their political views by any chance?” Maria asked the bank representative, only to be met with silence. Maria had been banking with ING Bank for numerous years without issues. Her account was suddenly shut down shortly after releasing a story on domestic terrorism in Australia. ING Bank has been unable to explain why her account was canceled.
Interestingly, ING is a partner of the World Economic Forum. Maria has extensively covered the WEF’s agenda to “enslave humanity.” Is Australia secretly keeping track of journalists’ “social credit scores” to silence skepticism?
The idea of eliminating someone’s ability to bank is essentially eliminating them from society. We saw Canadado the same thing to those protesting the Trucker Convoy. Trudeau took things a step further by also de-banking people who simply donated to the cause. The Canadian government used the premise of money laundering as a way to coerce the banks into reporting any activity that could have been intended to help the protestors. I know of numerous people who were frantically attempting to remove their funds from the bank during this time.
As if the public needed more reasons to lose trust in the banking system. This is not limited to one bank or country. I discussed how banks have the ability to “cancel” someone after JPMorgan Chase de-banked the rapper Kanye West for antisemitic remarks. The bank acts as the jury and judge. Epstein was permitted to hold funds at JPMorgan Chase despite an ongoing pedophile ring trial. Bernie Madoff banked with JPMorgan Chase. The bank has secret ties to the Third Reich and helped the group funnel money through South America during World War II. Again, the bank acts as the jury and judge; anyone can be de-banked anytime for any reason.
Most countries may not openly have social credit scores, but they’re keeping tabs on us. They are keenly aware that resistance to this New World Order is building. So they are now using professional journalists as examples hoping that people will stop asking questions to learn the truth. That is one of the reasons why this blog is free of charge – you deserve to know the truth.
COMMENT: Marty, it’s refreshing to have Socrates that is totally unbiased. It projected continued rising rates into next year and the Fed just proved its point. It is not backing down.
Thank you. Socrates is very enlightening.
GS
ANSWER: I know there were a lot of talks that surely the Fed had to lower rates and start QE all over again. Most of those sorts of comments have no real experience in markets. They just mouth a lot of hot air. Perhaps instead of putting masks on cows, we should do that on the shills. The Federal Reserve had no choice but to raise interest rates although it was just by a quarter point. Not to do so and the Fed would lose all credibility and the market would then not take them seriously.
You MUST understand that this crisis has unfolded because too many banks were wrapped up in WOKE culture and hired people who were UNQUALIFIED to run risk management. Some were more excited about cross-dressing as a woman and winning the Rainbow award in banking than actually protecting the bank from the risk of rising interest rates.
In a statement released at the conclusion of the meeting, Fed officials acknowledged that recent financial market turmoil is weighing on inflation and the economy, though they expressed confidence in the overall system. “The US banking system is sound and resilient.” They had no choice but to make this statement.
“Recent developments are likely to result in tighter credit conditions for households and businesses and to weigh on economic activity, hiring and inflation. The extent of these effects is uncertain.”
The Fed is saying that their rise in rates will in fact reduce inflation and economic activity. The banks have this yield curve risk and that is different from the 2007-2009 crisis where the debt was based on fraud. Here, the debt is US Treasuries so they are not going bankrupt from that aspect, but it is a liquidity crisis.
If these people who scream loudly but know nothing really about finance keep up the nonsense, they will only add to the uncertainly. This inflation is accelerating thanks to the war.
The banking crisis continues and it is impacting funds that have been buying bonds. Allianz, a subsidiary of Pimco, is writing off countless millions with Credit Suisse bonds. The banking crisis has been the result of artificially low-interest rates for far too long and banks were used to free money and buy long-term bonds all because they were making their money on the spread. Now that rates are rising, their risk management was effectively nonexistent, and thus the losses and widespread.
The Allianz subsidiary Pimco is one of the largest asset managers in the world. They have to now write off a loss in Credit Suisse bonds and it’s ain’t over yet as we head into April 10th.
COMMENT: Marty; Two former Merrill Lynch traders were each sentenced to a year and a day in prison Thursday for manipulating the precious metals markets, the US Department of Justice announced. Of course, —- —–, which is forever bullish metals, claims they moved the metals in the “direction they wanted from 2008 to 2014.” It just seems that people claim it is always manipulation when they have been wrong. They only look at gold in dollars as you have said it’s a global market. They would have to manipulate all the currencies as well.
This latest affair of so-called manipulating trades during the day proves what you have been saying. They have always been gunning for stops during the day, but they cannot manipulate the trend between a bull or bear market. Do you think people will ever understand this is a global economy?
HD
ANSWER: I know. Unless people have actually been a trader, they will never understand the market. They will blame people like this to pretend they were not wrong. The problem is that this nonsense of manipulation is driving a stake through the heart of the market. Trading is like a poker game. Do you reveal your hand before everyone starts to bet? Sometimes you bluff, but the point is if you are bluffing, you have to stand behind your bet.
The mere fact that someone is blaming this type of “manipulation” for being the reason they have been wrong demonstrates that they know nothing about investing no less trading. The DOJ is now big on calling placing large “spoof” orders as manipulation. That is absurd and it is no more than bluffing in a poker game. This is the way all the markets have always functioned. Everyone would know where the stops were anyway. Sometimes they traded ahead of them using the stops as your risk point to exit the trade, and other times they would sell or buy to push the market through the stops when it was obvious that was even possible.
When I was trading in precious metals back in the ’90s, the biggest “local” dealer on the floor was Oni Morrison. He would do “spoof” orders all the time which I called “flash” bids or offers. The difference was he was good for it if hit. I was long one time in gold and I wanted out for the computer projected a crash was coming. But if you offer a thousand lots and the market was heading lower, everyone will read that and jump in front of you. That is how the Hunts went bankrupt. The Hunts did not know how to trade. Just as in poker, you cannot show your hand and expect to trade.
Oni would do “flash” bids or offers. I told my broker not to offer anything. I told him just to watch Oni and as soon as he would do a 1,000 flash to buy – say done! Sure enough, Oni was trying to push the market back up and he did one of his famous flash bids for 1,000 lots. My broker, Emerald Trading, instantly said “DONE!” Oni did it again, and they said “DONE!” Again he did a fash for 1,000 and again they said “DONE!” That was it. Oni was full and everyone began selling as the metals tumbled.
That is the way you have to trade SIZE. This is the very foundation of trading all markets for everything is just a poker game. To now call a “spoof” trade manipulation is just wrong. It is totally different when you do not have the backing. Now that would be a fraud and trying to manipulate the market for that moment – not changing the overall trend. But when you have the backing to honor your “spoof” it is just a “flash” bid or offer that you must stand behind when hit. That is just trading.
It is total BS to pretend that these guys manipulated the entire market. That is just absurd. Not even the central bank can manipulate the economy. You cannot “manipulate” a market against the trend for everything is connected. That caused the Panic of 1893 when the Silver Democrats overpriced silver. The Europeans hit the arbitrage and dumped silver in the US and took the gold back to Europe. That led J.P. Morgan to have to arrange a $100 million gold loan to bail out the treasury. That alone proved that you CANNOT manipulate ANY market against its trend for it will be arbitraged internationally – plain & simple.
Gold trading around the world in different exchanges is arbitraged. You cannot have gold $20 high in one market v another. It will be arbitraged instantly. Those who claim this as “proof” that the metals have been manipulated so that is why they have not rallied and why they have been wrong are fools who have been separated from the money. They will never understand the markets no less be able to see beyond the end of their nose. It will be instantly arbitraged.
The collapse of the Soloman Brothers was precisely that. They were putting in bids at the Treasury Auction using other people’s names to goose the market. They got caught and the firm was taken down. I know PhiBro from the ’70s and ’80s. They took over Solomon Brothers and brought that style of trading from the commodity pits to Wall Street.
This excuse by goldbugs that the metals were actually “manipulated” in their long-term trend, shows their hopeless ignorance of the markets and how they even trade. There is NOBODY who could possibly do such a thing for everything connected. As soon as the dollar would rise, the metals in terms of foreign currency would be so overvalued they would all sell and they will end up broke the same as the Silver Democrats bankrupted the country by overvaluing silver.
Trading internationally, with clients in all currencies, we have to look at each market in terms of their currency for that will determine if they made a profit or loss. Anyone who claims the metals have been manipulated and that is why they have not rallied is obviously oblivious to the world around them.
Gold does NOT rise with inflation – that is the sales pitch of a used car salesman. Gold rises in times of UNCERTAINTY with respect to the government. In times of war, it rises because it is NEUTRAL and you are not betting on who will win.
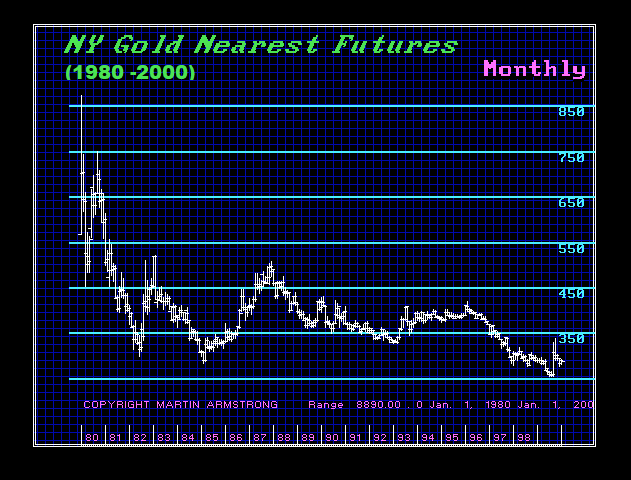
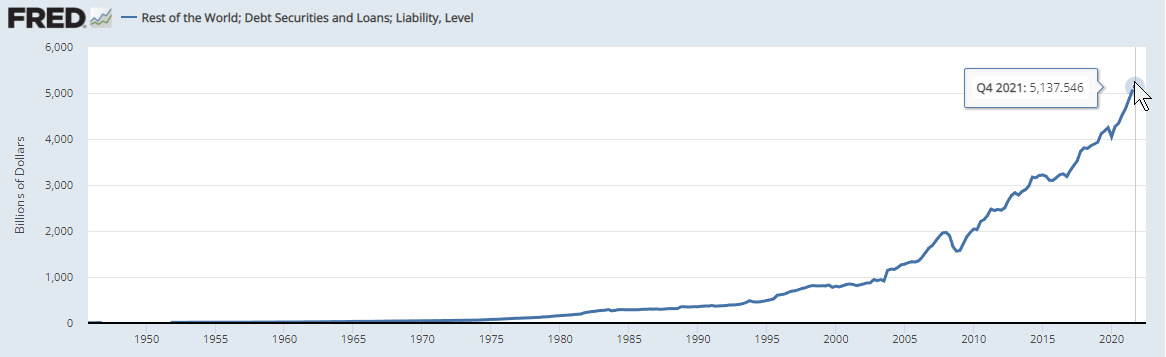
All we hear is that the debt is rising and therefore gold will explode. Once again, they offer no proof of their sophistry because there is no such proof. Gold declined for 19 years while the national debt climbed endlessly.
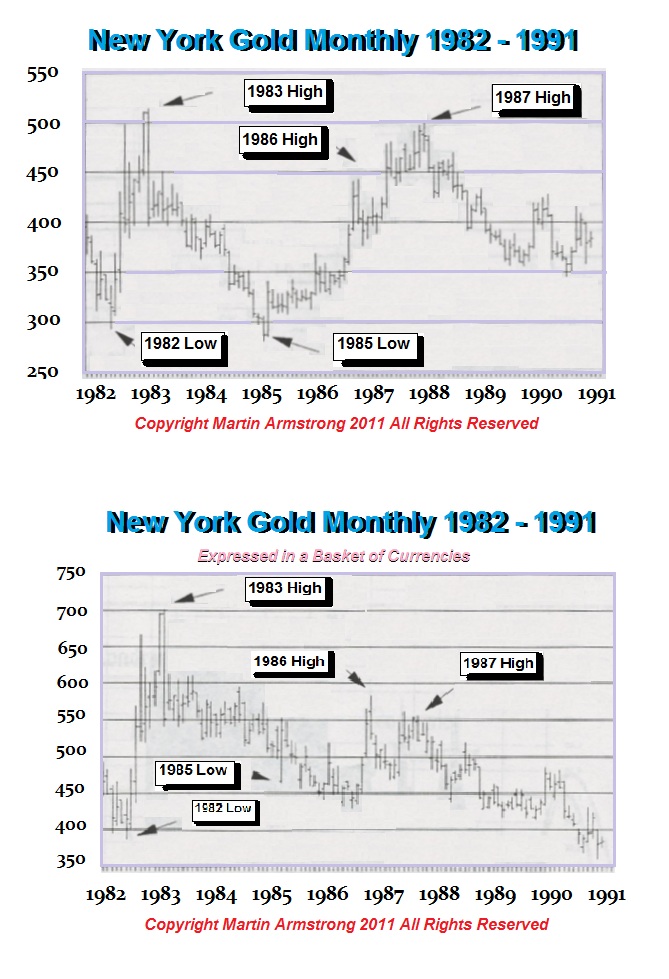
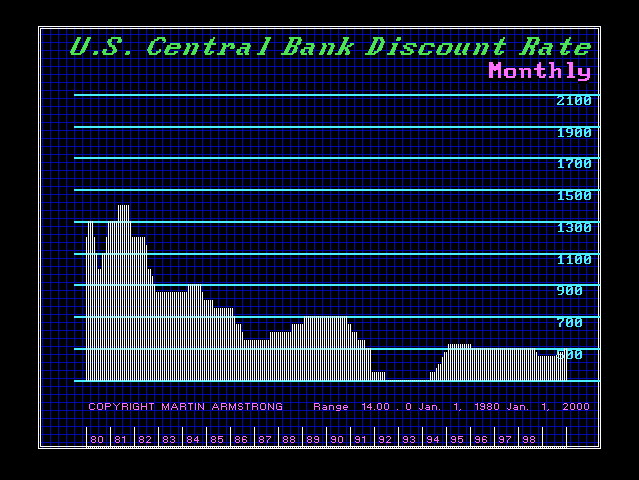
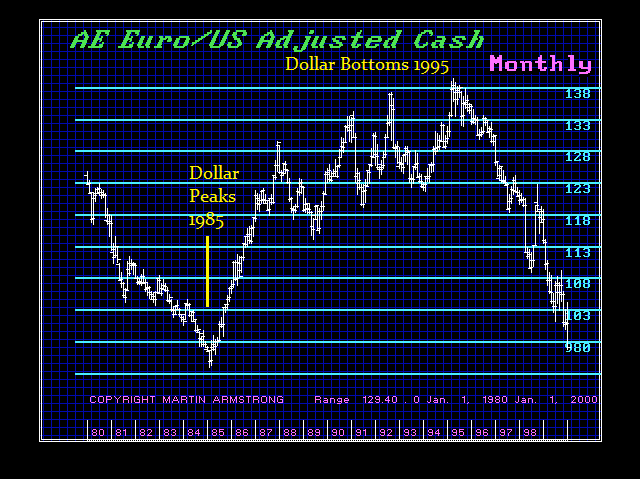
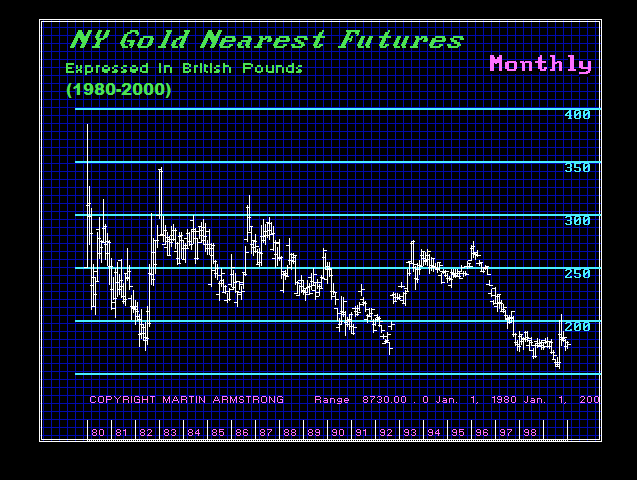
Then there is the myth about interest rates and gold that higher rates are bearish and lower rates are bullish. Well, interest rates peaked in 1981 and declined in 1994 before they began to rise marginally into 1995. Yet then contrast that myth with the performance of the dollar. There the greenback rose to a record high in 1985 but then declined for 10 years into 1995 all the while gold declined into 1999.
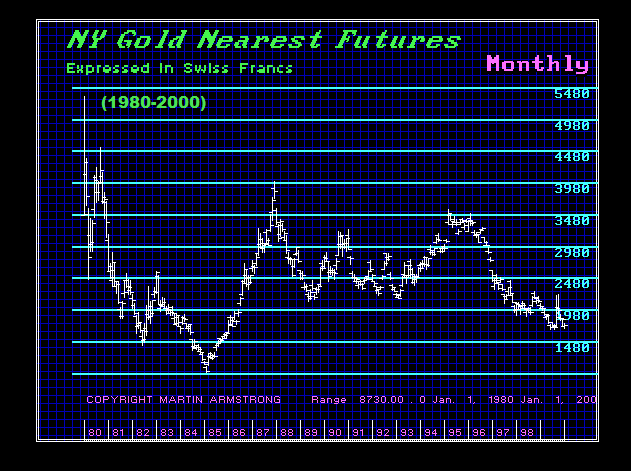
OK, so now let’s look at gold between 1980 and 200 in terms of Swiss francs and British pounds. We can instantly see that gold bottomed in 1985 in terms of the Swiss franc. In terms of British pounds, gold did not bottom until 1999.
People come up with theories all the time. However, they always try to reduce everything to a single cause and effect. They are doing that with climate change. They are telling the world it is CO2 that has changed the climate without ever addressing anything else.
The world we live in is not only complex, but it is also so dynamic it appears that no human can correctly forecast the future with an “I think” scenario. Sometimes they will be right, and others they will be wrong. Typically, they fail because they try to reduce the world to a single cause and effect.
Gold Rises with UNCERTAINTY with respect to the question of will the government survive its own madness.
QUESTION: The sales pitch seems to be that there is this $2 quadrillion in global debt that overhangs everything. Paper assets, therefore, will all implode! They seem to be saying that everything has risen due to this debt bubble and it was all created with Zero interest rates. Now that they are going up, the debt bubble will burst and everything will decline. The story seems to be that this decades-long Boom Bust cycle was created over and over by the Federal Reserve.
This seems to be like you have said, they try to reduce everything to a single cause and effect.
What really happens?
PCJ
ANSWER: These people seem to keep preaching the same story but have no historical understanding whatsoever of how the monetary system has ever worked. Their focus on the Federal Reserve shows that they are not looking at the world economy and they do not even comprehend how bad things really are outside the United States. They do not comprehend what is an interest rate. It is the compensation to a lender for his anticipation of inflation plus a profit. If I think the dollar will decline by 50%, why would I lend you dollars for a year if when you pay me back it buys half of what it did when I lent it to you?
Debt can be a performing asset. I advised many of the Takeover Boys during the 1980s. We would borrow in one currency to buy the asset in another using the computer to distinguish the long-term trends. I would not recommend that to someone just operating on a gut feeling.
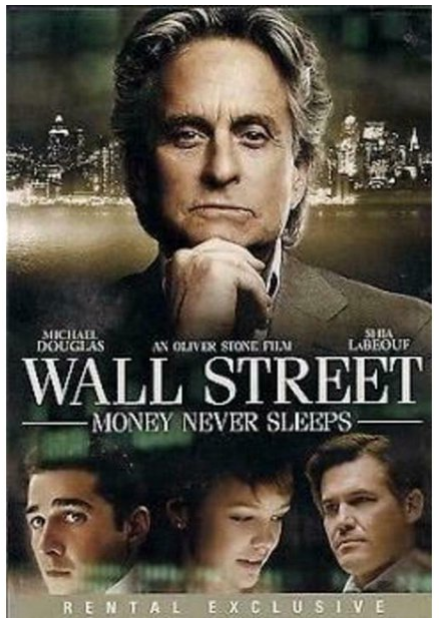
We were also advising on real values, which Hollywood distorted and based the movie Wall Street with Michael Douglas and his famous speech on greed. What they did not really understand was that after a Public Wave that peaked in 1981, stocks were suppressed and the full-faith in government created the broadly supported bond market. Hence – bonds were conservative and stocks were risky. There were two aspects that were behind the entire Takeover Boom.
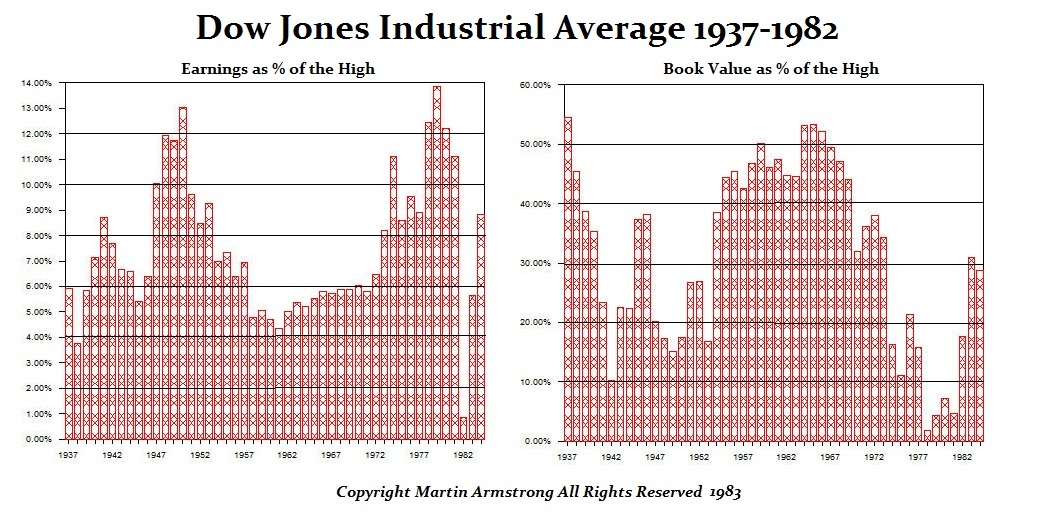
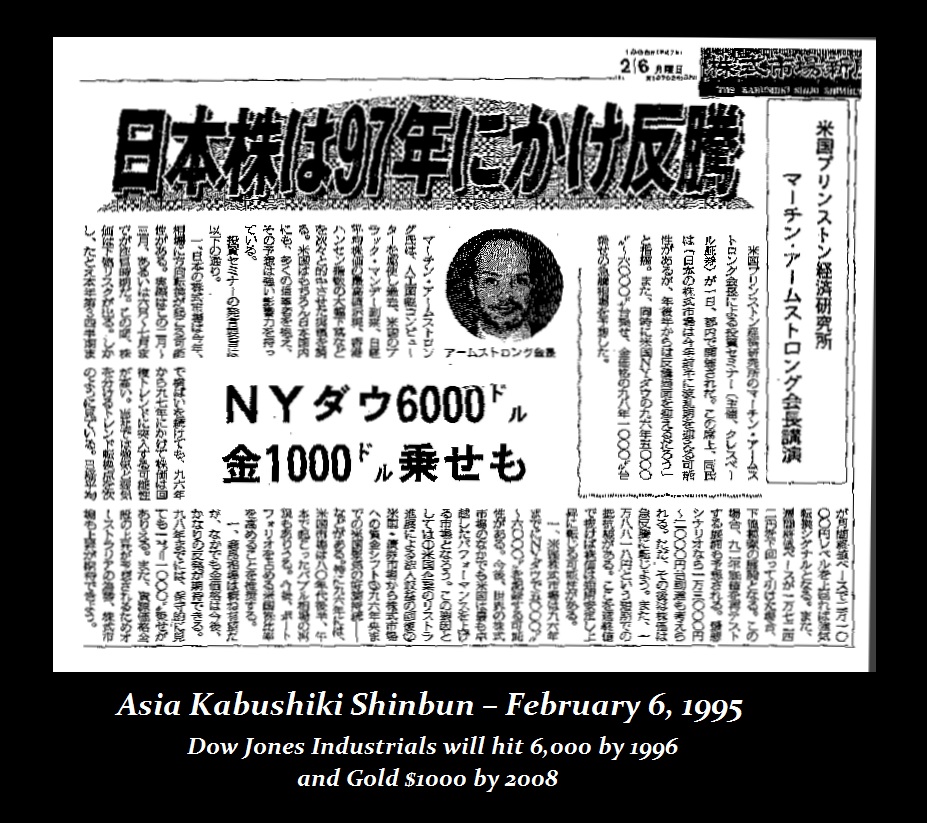
First, I was showing these charts and how in terms of book value, the Dow Jones bottomed in 1977. It was obvious that if you could buy a company, sell its assets, and double or triple your money, then the market was obviously not overpriced. We had forecast that the Dow was undervalued and that it would rise from the 1982 low of 769.98 and test the 2500 level in two years in 1985. Indeed, it reached 2695.47 by September 1987. We also projected that by the next decade, the Dow would test 6,000 on its next rally.
Even the press in Japan was shocked. We were also projected that Crude would fall below $10 in 1998. Indeed, that forecast was covered by Mark Pitman at Bloomberg News. It bottomed at $10.65 in 1998. In gold would forecast that it would drop to test $250 by 1999 completing a 19-year cycle low. Then gold would rally to test 1,000. Gold reached the $1,000 level by 2008. The Japanese press thought those forecasts were wild, to say the least.
The SECOND aspect of our advice to the takeover boys of the ’80s was something the press NEVER understood. We would advise borrowing in one currency for an asset in another. We were able to turn debt into a performing asset. We would make 20-40% profit on the currency alone. Often, the press would just look at the debt and not understand what we were even doing.
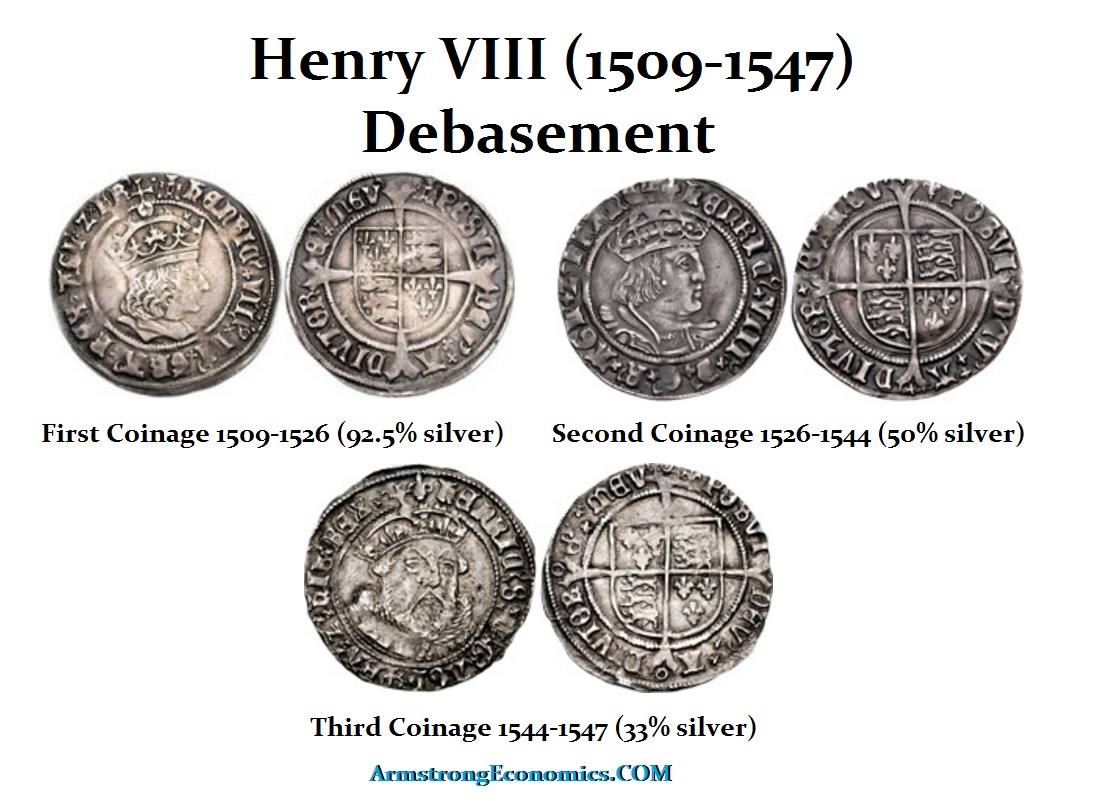
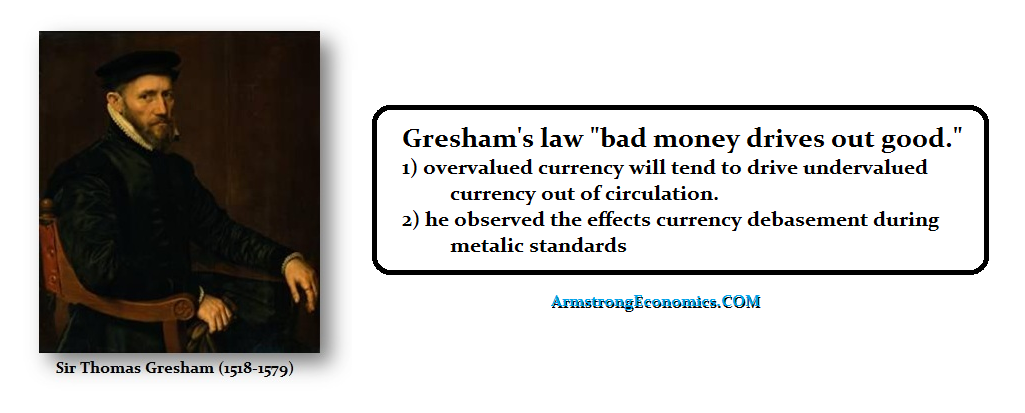
Most of this reasoning stems from Sir Tomas Gresham’s observations when he represented England at the Amsterdam exchange during the reign of Henry VI’s reign and debasement. As Henry debased the silver coinage as was taking place in Spain, the more they debased the coinage, the higher the inflation took place. His observation that bad money drives out the good has been grossly misunderstood. When I was growing up, they took the silver out of the coinage in 1965. People were culling out the silver showing that the debased new coinage of 1965 drove out of circulation the old silver coinage. The same thing has taken place with the copper pennings.
Because people hoard old coinage, the money supply shrinks. That then forces the government to issue far more debased coinage to compensate for the coinage that has been withdrawn from hoarding. Consequently, inflation unfolds for all tangible assets to rise in value as expressed in the newly debased coinage.
What these people always try to sell is the same old scenario that they cannot point to a single instance in history where everything collapses to dust but only gold survives. Such periods will typically result in revolution. When Caesar crossed the Rubicon, that was also all bout a debt crisis.
You must also understand that interest rates will be at their LOWEST internationally in the core economy of the Financial Capital of the World – which is the USA right now. The further you move from the center, the higher the interest rate will be. Hence, I have warned that the United States will be the LAST to fall – never the first. This is not based upon my opinion, this is simply historical fact.
The Bottom Line is very simple. There is just no such period as people describe where everything turns to dust and only gold survives. Even if that were true, they what good would the gold do if everything else is worth ZERO? Gold would have also ZERO value since nothing would have value.
The real issue is that as government defaults unfold, tangible assets will rise in value for the amount of money in debt always dwarfs that in even the stock market. We are in a Sovereign Debt Crisis and that is very different from a private debt crisis.
Posted originally on the CTH on February 14, 2023 | Sundance
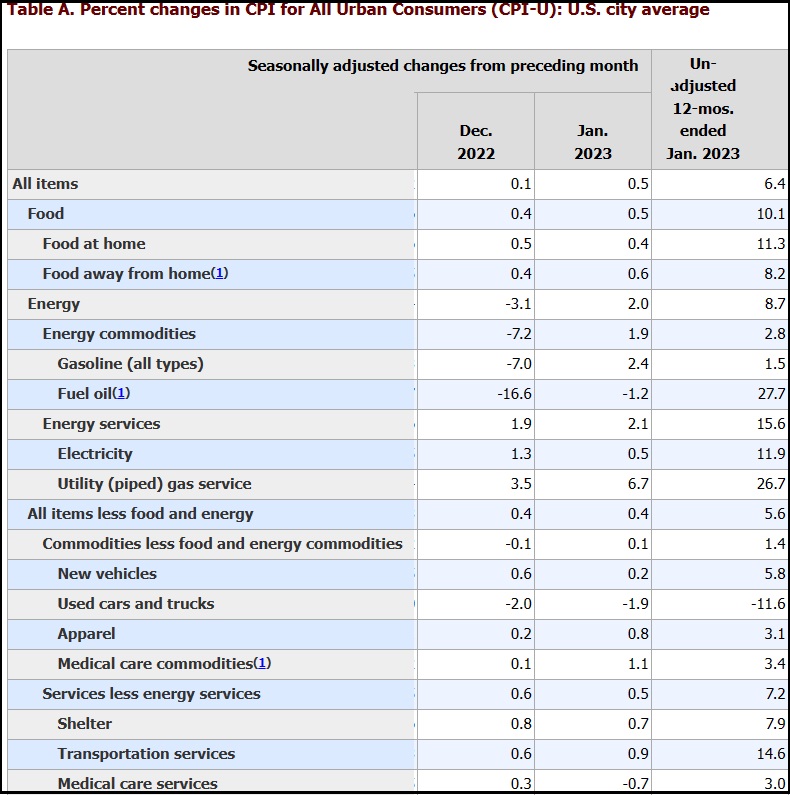
The Bureau of Labor and Statistics released the January consumer price index today [DATA HERE] reflecting what you already know. The overall inflation rate stands at 6.4%, after the anniversaries of the first two waves of price increases have now tolled.
Inflation is the measure of price increases over time. Following two years of massive jumps in price, we are now cycling through and comparing current prices to the previous period when prices had already skyrocketed.
This gives a false impression of price moderation (hindsight inflation); however, the price of goods and services is significantly higher, and those prices will not drop. The higher prices are now embedded in the economy.
After a brief respite, a plateau, in energy price increases over Nov (0.5%) and December (0.4%), the January energy prices began climbing again (0.6%). This is what we have all noticed in the past three months.
Additionally, “shelter” costs, rent and housing, continue to increase in price (0.8%, January). Overall shelter costs now +7.9% for the 12 months preceding January, 2023, with rents up 8.6% for the period [Table-1].
We have also cycled through the anniversary of the first two waves of massive food price increases, ending January 2022. Despite that cycle, food prices still show an increase of 10.1% for the preceding 12 months. Cereals +15.6%, dairy +14.0%. These food price increases are on top of similar jumps in the period that preceded January ’22. Most of these volatile food price increases are attributable to the overall scale of energy and transportation costs. These prices will never reverse.
The issue is compounded because the inflation rate is still far exceeding the rate of wage growth. This means workers and working families are going backwards and spending more than they earn for the exact same housing, food and energy products they were purchasing a year ago.
This wage squeeze means little to no disposable income, which then applies to the rest of the household checkbook economics. With less disposable income, fewer non-essential products and/or services are purchased by working families. This situation creates the snowball effect of lessened overall economic activity.
(Via CNBC) – […] Rising shelter costs accounted for about half the monthly increase, the Bureau of Labor Statistics said in the report. The component accounts for more than one-third of the index and rose 0.7% on the month and was up 7.9% from a year ago. The CPI had risen 0.1% in December.
Energy also was a significant contributor, up 2% and 8.7%, respectively, while food costs rose 0.5% and 10.1%, respectively.
Rising prices meant a loss in real pay for workers. Average hourly earnings fell 0.2% for the month and were down 1.8% from a year ago, according to a separate BLS report that adjusts wages for inflation.
While price increases had been abating in recent months, January’s data shows inflation is still a force in a U.S. economy in danger of slipping into recession this year. (read more)
According to the wage report: “from January 2022 to January 2023. The change in real average hourly earnings combined with an increase of 0.3 percent in the average workweek resulted in a 1.5-percent decrease in real average weekly earnings over this period.” Workers are working longer hours, making slightly more pay, but the rate of inflation means their actual “real wages” are still dropping.
The way to break out of this cycle is to first unleash the U.S. energy sector and drive down the costs of oil, gasoline, diesel fuel, home heating oil, natural gas and electricity rates. However, the entrenched nature of the climate change ideology, blocks the professional political class from providing the energy sector relief. Both Democrats and Republicans want the Joe Biden “green new deal” energy policy.
I have created this site to help people have fun in the kitchen. I write about enjoying life both in and out of my kitchen. Life is short! Make the most of it and enjoy!
This is a library of News Events not reported by the Main Stream Media documenting & connecting the dots on How the Obama Marxist Liberal agenda is destroying America