Armstrong Economics Blog/Armstrong in the Media Posted May 20, 2023 by Martin Armstrong

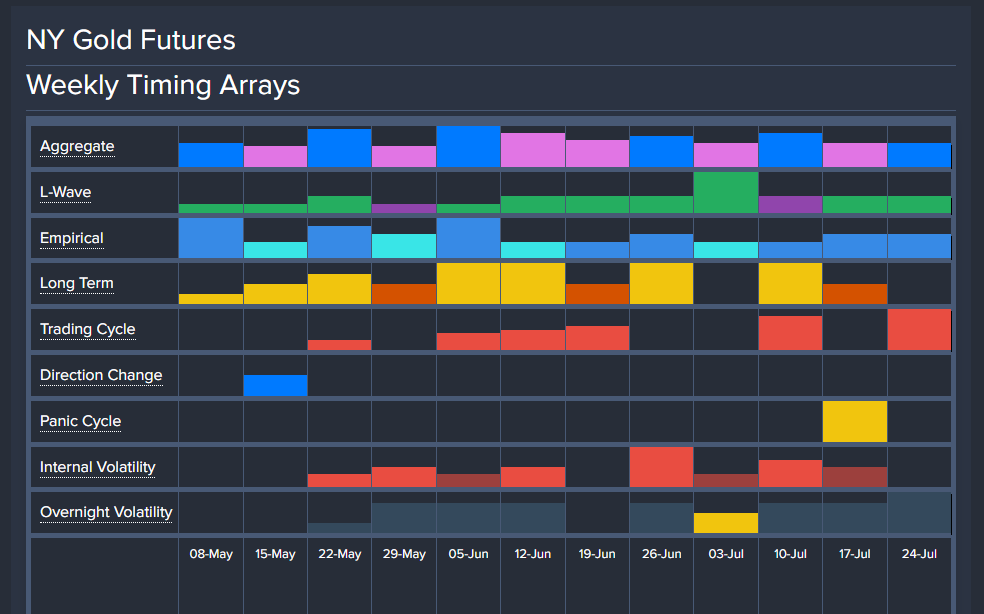
COMMENT: Marty; Socrates is absolutely amazing. At the start of the year, you showed April as a key turning point in gold followed by May June. The weekly array projected this was the week for the Directional Change. There is nobody with a system like this, which brings to mind its forecasts for war. Ukrainians are out of their mind to go against the trend. They never even considered what if they lose. It seems like a fool’s bet. This not about just occupying the Donbas which has always been Russian. This is about destroying Russia. They should listen to Socrates to save their own country.
Thank you so much for bringing Socrates to the public rather than just institutions.
HR

ANSWER: I know. These forecasts are not my personal opinion. When you put the entire world together, the trend becomes obvious. Just as I said Ukraine needs to lose to save the world, I also know that we will not all escape the end conclusion. Just as a Serb assassinated the Archduke in Sariavo which began World War I, this entire region is notorious for personal grudges and hatreds that draw in the entire world.
Schwab may have taken our forecast for 2032 and rephrased it as his Great Reset and is hoping to push the falling tree into his direction, that too will fail. But between here and 2032, we are entering a phase of chaos and havoc. I wish I could prevent it, but that is just our fate.
Recently I went to the supermarket to pick up some general provisions. Given the nature of previously predicted food price increases, and proactive measures to mitigate the predictable prices, I haven’t needed to purchase basic foodstuffs in a while. Yikes! The prices… Wow.
Since we originally warned in ’21 about the waves of food price inflation that were coming, the prices have more than tripled on many food commodities. That part is not as surprising in current review; however, the prices of processed foodstuffs is, well, quite frankly astounding.
I am left to wonder how working-class people are able to afford the jaw dropping price increases in highly processed food products like condiments (mayo, ketchup, mustard, etc), and even coffee and milk. I knew the processing costs would drive those prices, but the scale is just astounding.
Beyond the foodstuff, what was truly stunning was the current price of non-food items at the store. Items like chemical cleaners, soaps, aluminum foil, trash bags, Styrofoam products, ziploc bags, paper goods, etc. I mean seriously, $8 for a box of trash bags, good grief.
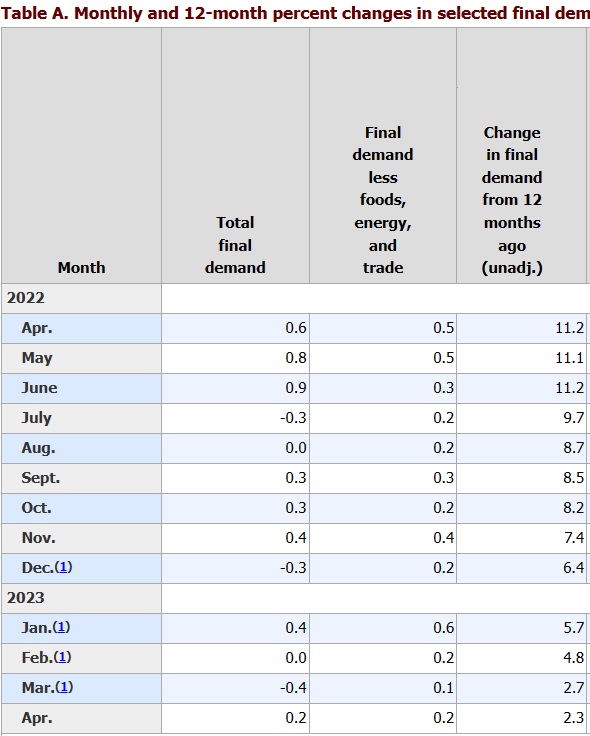
After a review of the non-food item prices, I went back to the recent BLS report [DATA HERE] to look at the producer price index to see if the data reflected the scale of the processing cost that I was reviewing across a broad spectrum of goods.
Are consumers getting gouged by manufacturers who are taking advantage of the price shock inside the ongoing inflation?
Or are the processing costs, mostly driven by energy price increases, really that big a factor in the end product as it is generated?
In the topline final demand Producer Price Index [Table A above] you can see how we are cycling through the second wave of inflation that hit in the spring of 2022. The rate of price increase is lower, but the prices are still rising. That means the prior massive price increase is now baked into the product, and the current price will never decline. Instead, it will just increase at a slower rate than before.
However, that’s not the full story… and that is not the data I was most curious about.
The intermediate product costs are really where the story is found.

Table B [DATA HERE] Tells us a remarkable story.
Raw materials (unprocessed goods) are essentially in a deflationary status [-19.2% in April]. Meaning demand for the raw material has dropped well below the available supply. However, look at how much of the deflationary price is consumed in the processing of the raw materials.
A full 16% is consumed by processing cost increases [energy, physical plant, transit, production costs etc]. That is remarkable.
A random example might be citric acid. The price of the citrus base drops 19.2%, but the processing of the base into the intermediate good phase chews up 16% of the drop in raw material price and exits processing only 3.2% lower in price than a year prior.
Another example might be found in plastics. The petroleum base, and/or a combination of each material additive, might be 19.2% lower than prior year, but processing negates the lower raw material price, and exits into intermediate essentially even -.04, and then toward the ending +2.3% final demand change in the rate of price increase.
The PPI data is essentially showing the flow of costs of production as reflected in the impact during processing. We can assume mostly increases in energy, transport and distribution costs to bring the raw material forward to final good status.
Key takeaway, the demand side of the raw material is diminished. There is less raw material demand. However, processing costs are continuing to drive the final production price of goods that head into the hands of wholesalers who then bring the product to market.
The outcome of this are the prices of processed goods as noted in the products on the shelves.
As far as the 12 Caesars are concerned, I am doing my best to assemble a few sets. These are not easy to put together. Nevertheless, I am giving it a shot to see what I can do that would be reasonably priced, under that $100k people ask on the market. I believe reasonably excellent VF/XF sets for around $50,000. But this is not something that quantity exists. This is very hard to assemble. I’m still trying to fill in some gaps. They will be presented in a nice wooden case.

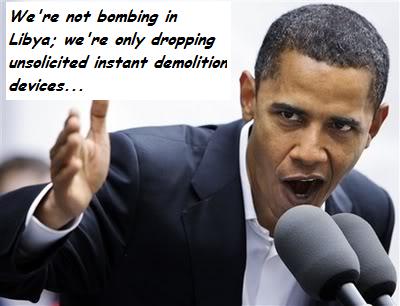
In 2010 and 2011 the Hillary Clinton State Department, working with NATO allies (particularly France), triggered a crisis in Libya during the Obama administration’s intentional effort to remove Muammar Gaddafi from power. This was a key element to the Arab Spring (Islamist Spring or Color Revolution) that flowed from the Cairo, Egypt, speech of President Obama a year prior.

Hillary Clinton, Susan Rice and Samanta Power (R2P) were the architects of the destabilization plan. After the country was destabilized and thrown into severe violent crisis by the U.S. support for radical Islamists in eastern Libya (Benghazi region), President Obama then signed (Feb, 2011) a national emergency declaration in regard to the destabilized Libya his administration created.
Five years later, in April 2016, President Obama expanded the Libya emergency declaration to extend the 2011 declaration and envelop a larger portion of North Africa, under the auspices of expanded threats from AQIM (al-Qaeda in the Islamic Maghreb). This extension allowed the state dept to frame actions in neighboring Egypt, and block any effort to counteract Obama’s mid-east policy which was established to support the Muslim Brotherhood. In April 2016 it was presumed Hillary Clinton would win the election and continue the policy.
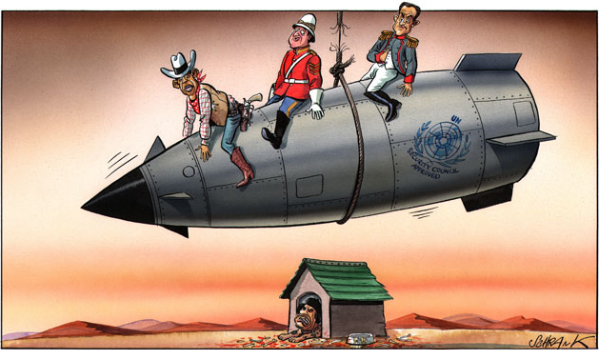
Today, a full twelve years after Barack Obama and Hillary Clinton destabilized Libya throwing it into a tribal civil war, Joe Biden signs an executive order continuing the extension of the U.S. National Emergency with regard to Libya {White House Link}.
[…] “The situation in Libya continues to pose an unusual and extraordinary threat to the national security and foreign policy of the United States, and measures are needed to protect against the diversion of assets or other abuses by members of Qadhafi’s family, their associates, and other persons hindering Libyan national reconciliation.
For this reason, the national emergency declared on February 25, 2011, and expanded on April 19, 2016, must continue in effect beyond February 25, 2023. Therefore, in accordance with section 202(d) of the National Emergencies Act (50 U.S.C. 1622(d)), I am continuing for 1 year the national emergency declared in Executive Order 13566.
This notice shall be published in the Federal Register and transmitted to the Congress. (read full)


There is a significant lag in all data within the housing market. That said, the third quarter (July, Aug, Sept) data reflects a significant drop in institutional investment within the housing market.
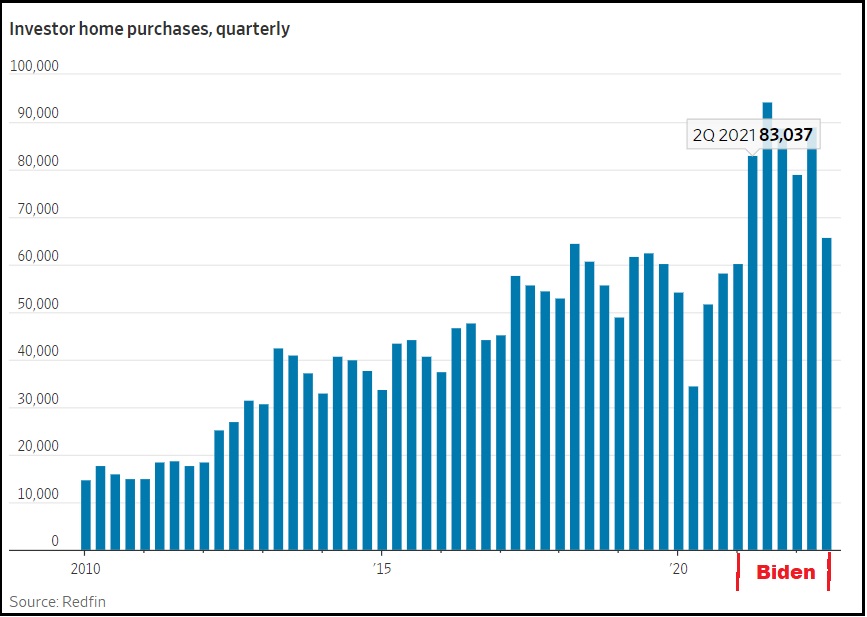
If you look closely at the timing (keep in mind the data reporting lag) what you will notice is that financial institutions began a big surge in purchasing hard assets, specifically real estate, as soon as Joe Biden took office (Jan ’21), and the economic policy became evident. Intangible financial instruments became an immediate risk as the professional financial control groups recognized energy policy would drive inflation (supply side) and devalued money would fuel it (demand side).
As an offset to predictable inflationary policy (the insiders’ game), institutional money (Blackrock, Vanguard etc) was moved into hard assets with tangible value. This shift in asset allocation, institutional sales, helped fuel a false surge in home prices and their valuations. CTH was writing about this in 2021, and sounding alarms as it took place. 25% of all real estate purchases were being made by institutional investors.
The dynamic was predictable. The Biden administration economic policy, energy policy and monetary policy, was going to cause massive inflation. CTH was shouting about it in early 2021 and warning everyone to prepare for waves of price increases that would naturally surface first on high-turn consumable goods, and then embed into longer-term durable goods.
Despite claims to the contrary, this 2021 inflationary explosion had nothing to do with the pandemic or supply chain shortages. It is entirely self-created by western governmental policy; the collective ‘Build Back Better’ agenda. You can see now from the background moves within the financial sectors, they too knew the reality and their money shifts reflected that despite their ‘transitory’ pretending they were mitigating their own exposure.

We the People were yet again going to be victims of specifically intended monetary, regulatory, energy and economic policy.
The investment class rulers of the WEF assembly shifted assets to avoid the pain that we would feel. We “would own nothing and be happy,” and their shifts would position them to own everything and be in control.
Overall govt spending and regulatory controls drove inflation for these past two years. The ‘demand side’ was blamed, despite the lack of demand. I will be proven right when history is concluded with this. Interest rates were raised by central banks in an effort to support the policies that are driving ‘supply side’ inflation, not demand side.
Energy policy was/is crushing the consumer by driving up the cost of all goods and services. To support the overall goal of changing global energy resource and development (a false and controlled global operation), central banks raised interest rates. Various western economies, including our own, have been pushed deeper into a state of contraction by central banks crushing consumer demand, and eliminating investment via increased borrowing costs.
In short, the goal was/is to lower energy consumption by shrinking the economic activity. This, according to the BBB plan, was needed at the same time as energy development was reduced. These economic outcomes are not organic, they are all being controlled by collective western government agreement.
Within this control dynamic, there was always going to be a point where the reaction of the people to their economic reality means the financial control elements need to shift direction. They will always maximize profit and minimized risk, while knowing what the larger objective remains.
Just like every other durable good, housing demand contracts as prices and costs become unaffordable. The loss of equity within your home is damaging to your own value or ability to borrow against it. From the perspective of an institutional asset, that same equity drop is an investment loss. Thus, just as a consumer would exit the housing market, so too will institutional investment groups now control the slow dumping of the asset to remove the equity they pumped into it.
Much of the investment housing will be retained as rental housing, with the monthly rents being part of the returns on the investments. However, as this dynamic unfolds further purchases of houses stop, because the asset overall is declining in value.
(Via Wall Street Journal) – Investor buying of homes tumbled 30% in the third quarter, a sign that the rise in borrowing rates and high home prices that pushed traditional buyers to the sidelines are causing these firms to pull back, too.
Companies bought around 66,000 homes in the 40 markets tracked by real-estate brokerage Redfin during the third quarter, compared with 94,000 homes during the same quarter a year ago. The percentage decline in investor purchases was the largest in a quarter since the subprime crisis, save for the second quarter of 2020 when the pandemic shut down most home buying.
The investor pullback represents a turnaround from months ago when their purchases were still rising fast. These firms bought homes in record numbers last year and earlier this year, helping to supercharge the housing market.
Now, investors are reducing their buying activity in line with the decline in overall home sales, which have slumped with mortgage rates rising fast. (more)
At a macro level, if you bought a home in the last 18 months, or refinanced your home to pull out equity, you still have significant downside exposure. Home prices will continue dropping until they plateau on the downside at the price that existed in roughly June of 2021.
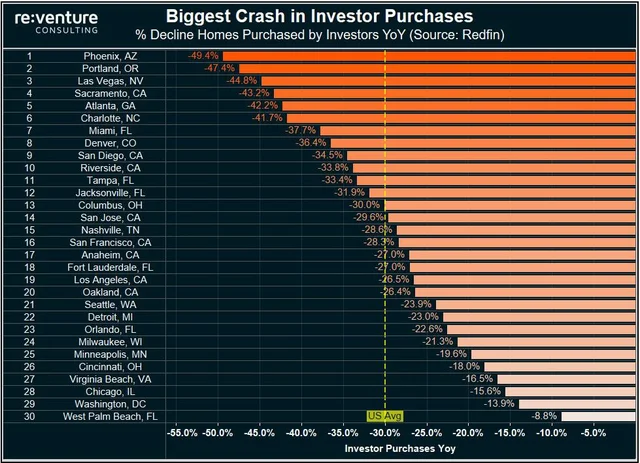
The drop in value is directly related to the regional purchases by the institutions. In areas where higher percentages of overall home sales were made by institutional investors, the subsequent drop in value will be larger (see chart above). In areas where actual people purchased homes to live in, the drop in value will be less significant.
I keep getting this buying question, so with the above in mind I will answer it in the most brutally honest way I can present…..
At a macro level, if you are going to purchase a home on this downslope, look at the historic valuation of that property (or a comparable property) in/around approximately the spring of 2021. Start there, and put your offer in that vicinity, then hold firm without any emotional attachment to it. Do not purchase another groups loss.
Fed Governor Christopher Waller appeared on CNBC to announce we have reached peak inflation, and things will moderate from here. All of these fed moves are political moves, not monetary policy-based moves. Here’s the thing they will never admit to the non-institutional investor.
The fed has been painfully slow to raise interest rates on purpose. They did not make a mistake. The reason for their delay is they needed to wait for the beginning of the first 2021 inflation wave to cycle through before they raised interest rates. It’s a game of mirrors that almost no one sees. WATCH:
The rate of inflation will drop once the statistical year-over-year comparisons reach the same moment in the prior year. The fed will raise interest rates in May and then use the June inflation rate decline as a false talking point to highlight how their policy is working. They wait for May, because they need to wait for the calendar, nothing else. Inflation is measured as the percentage of change from the prior year. By waiting until the inflation is measured against the first wave of rising prices, it will give the illusion of a decline in inflation.
So that’s why they waited. But here’s the worse part….
All of these U.S. Fed monetary policymakers are in full ideological alignment with the global and central bankers. They are all following the same Build Back Better agenda and policy instructions.
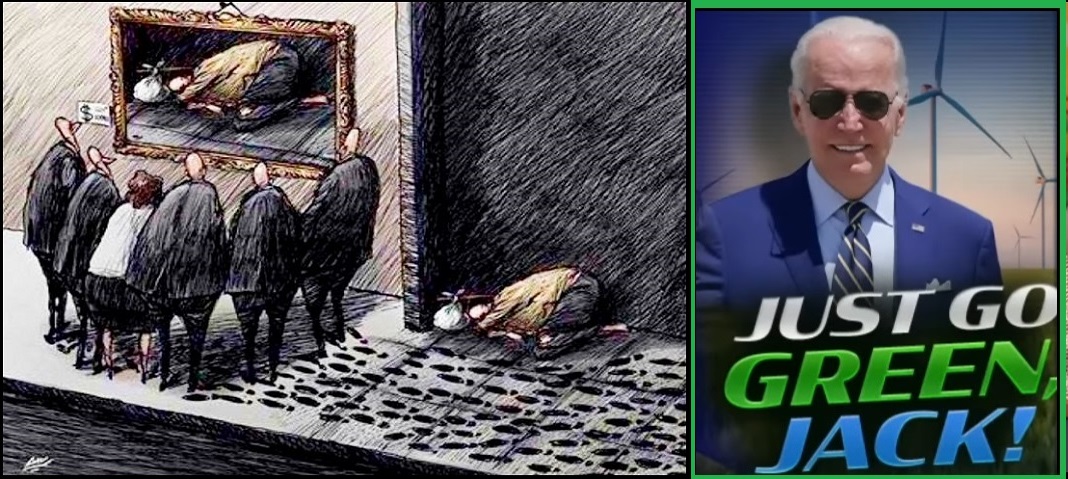
All of bankers know the shift from ‘dirty energy’, coal, oil, natural gas, will create inflation. All of the bankers know there is no economic bridge within the plan to shift from oil to their unicorn dust. All of the bankers know that shutting down oil exploration as a matter of western unified policy will, as a factual matter, destroy the economic systems that rely on energy….. which is to say everything.
All of these bankers know the severity of the inflation crisis this energy shift creates. None of them do not know.
Everything they are doing is coordinated to assist the climate change agenda.
That’s what this is all about.
Everything is politically motivated.

he “Producer Price Index” (PPI) is essentially the tracking of wholesale prices at three stages: Origination (commodity), Intermediate (processing), and then Final (to wholesale). Today, the Bureau of Labor and Statistics (BLS) released March price data [Available Here] showing a dramatic 11.2% increase year-over-year in Final Demand products at the wholesale level. This is the fifth consecutive month with the highest rate of inflation the PPI ever recorded.
The single month increase in wholesale prices of 2.3% was driven by inflation built into the supply chain at every level that shows up in the final wholesale price. Those price increases then get passed along to consumers along with the additional costs for warehousing, transportation and delivery. I modified Table-A (FINAL DEMAND) to take out some of the noise.
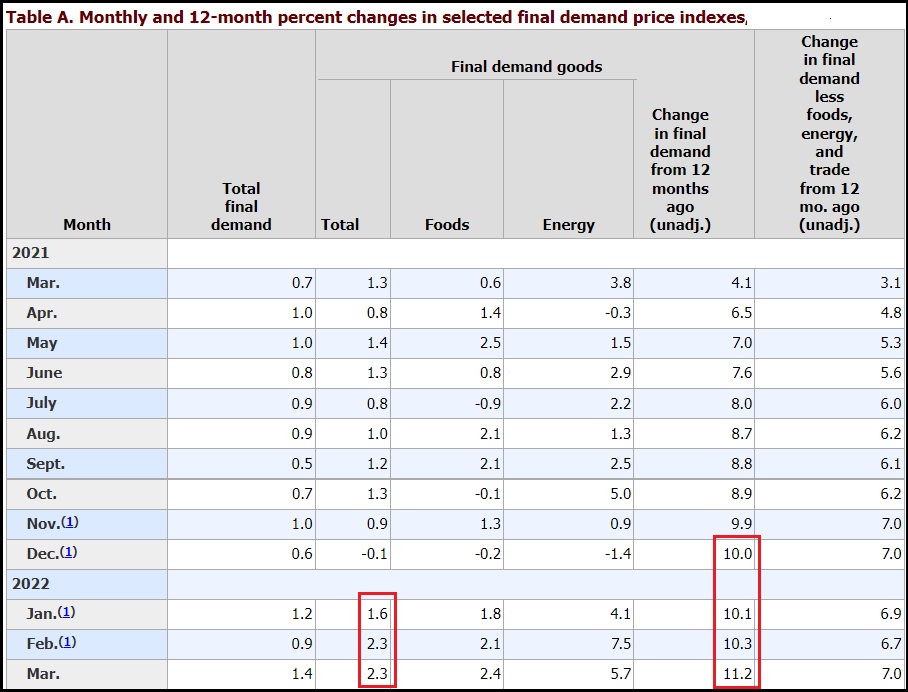
Wholesale prices of goods jumped 2.3 percent in March, and the wholesale price of food products jumped 2.4 percent. The total demand inflation compared to last year is 11.2 percent, the highest rate ever recorded since the PPI tracking was first started.
The total final demand monthly calculation (1.4%) is lower than the final demand goods (2.3%), because final demand services are offsetting. You may remember the discussion/analysis about prices beginning to stabilize after this month due to a contraction in demand for goods and services. I see support for that thesis within this data.
The three phases of wholesale product creation: (1) origination, (2) intermediate, and (3) final, cycle through the economic analysis in reverse chronological order. Roughly speaking, the flow of goods quantified is done in 30-day sequences. Final demand this month is comparing to final demand in March 2021. The intermediate demand goods this month will become final demand goods next month (April).
The rate of inflation behind this set of final demand goods is beginning to soften. See Table B, Intermediate goods. Again, modified to take out the noise:
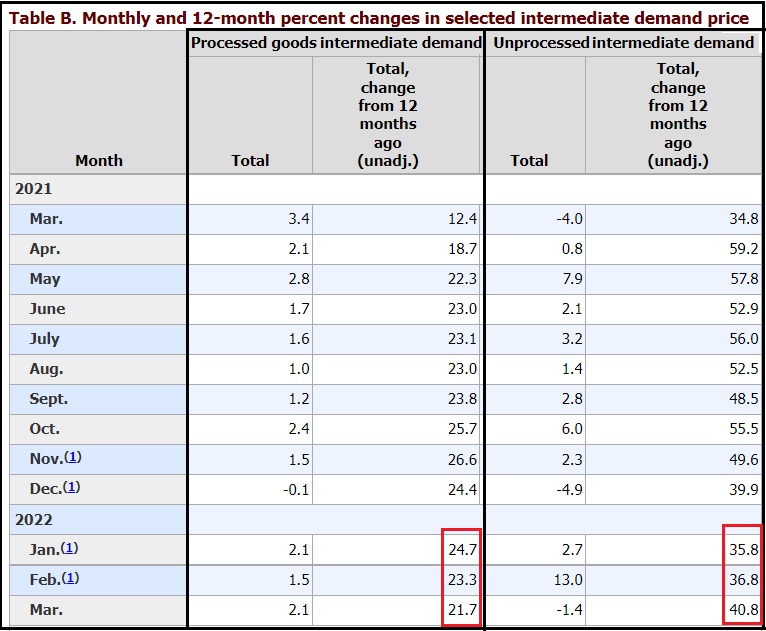
While the yearly comparison for both processed and unprocessed intermedia goods is eye dropping, in the unprocessed intermediate demand goods, we are starting to see a lessening of monthly price increases.
In essence, prices have been rising so fast and for such an extended period of time, that we are now cycling through the rate of increase and starting to compare it to last year when the rate of increase was originally going high. As a consequence, the rate of price increase will likely lessen, even though the actual price may still keep climbing within the manufacturing process.
The price of raw materials, and the wholesale energy costs to process those materials into finished goods, are still rising. In addition to the consumer prices reported yesterday, this wholesale price data is showing the most recent increases (March) in fuel and transportation costs. For the next report these figures should now plateau.
♦ BOTTOM LINE – We have not yet reached PEAK INFLATION – However, the price increases from wholesalers to retailers are now at parity. The increased price of things coming into the supply chain are now at similar rates of increase when compared to the stuff on the shelves.
Inflation from field to fork is now fully matriculated and embedded in the total economy as a result of two massive price waves (July to October 2021 and November to March 2022). Those prices will never fall.
Highly consumable goods like food, fuel and energy will remain at approximately the price today for a period of around five months, then we will see the third wave kick in as the new higher harvest prices hit the processors in late summer.
The prices for non-essential durable goods, like cars, electronics, appliances etc. from this moment forth will now be determined by demand. Highly sought after goods will increase in price as more customers chase fewer products. However, ordinary or widely available durable goods will likely start to come down in price very soon as inventories climb because consumer spending has prioritized and dropped non essential goods from their shopping lists.
To put it more succinctly: The stuff we need will cost more. The stuff we don’t need will cost less.
Let’s Go Brandon

I have created this site to help people have fun in the kitchen. I write about enjoying life both in and out of my kitchen. Life is short! Make the most of it and enjoy!
De Oppresso Liber
A group of Americans united by our commitment to Freedom, Constitutional Governance, and Civic Duty.
Share the truth at whatever cost.
De Oppresso Liber
Uncensored updates on world events, economics, the environment and medicine
De Oppresso Liber
This is a library of News Events not reported by the Main Stream Media documenting & connecting the dots on How the Obama Marxist Liberal agenda is destroying America
Australia's Front Line | Since 2011
See what War is like and how it affects our Warriors
Nwo News, End Time, Deep State, World News, No Fake News
De Oppresso Liber
Politics | Talk | Opinion - Contact Info: stellasplace@wowway.com
Exposition and Encouragement
The Physician Wellness Movement and Illegitimate Authority: The Need for Revolt and Reconstruction
Real Estate Lending
