COMMENT: Mr. Armstrong, I just wanted to inform you as a loyal reader of your blog, it is snowing here in Kuwait for the first time in history. Your computer is the only non-passionate forecaster I have ever encountered. It relays just the facts without an agenda.
Thank you so much. You have a large group of supporters here in the Middle East.
SBB
REPLY: This entire climate change agenda is a hoax. They are not interested in the truth. This is about using climate to restructure society into the one-world order which is why they are supporting Ukrainian Nazis that follow the same beliefs as Adolf Hitler. We have turned 180 degrees from our basic fundamental values.
I am deeply concerned that by calling this global warming and now they are experimenting with shooting particlesinto the atmosphere to “cool” the planet, we may be pushing ourselves into an ice age much faster than anyone suspects. Napoleon was defeated by a Volcanic Winter. These people are risking the entire planet for several volcanoes erupting, and we may not survive by deliberately shooting particles into the atmosphere. All of this is because our current debt system cannot be sustained.
All of this anti-Russian warmongering that the West needs desperately to create a war to hide the total collapse of our Marxist-based Socialist Economy where politicians only know how to run by promising free programs for everything.
Blowing up the gas pipeline from Russia to Germany to economically undermine Russia has undermined the German economy as well – the heart of Europe. Pollution levels in the country have indeed at times reached those of the worst polluting countries.
The energy shortages that have been deliberately created have resulted in surging power prices. Germany has been compelled to turn to cut down trees for wood and to boost coal use. All of this has taken place while they are supposed to be committed to fighting climate change and the Greens object to any nuclear power.
To keep the factories operating and just the lights on, Germany is now burning coal at the fastest pace in at least six years. Europe’s largest economy is in serious danger of an economic crisis despite the EU’s drive to phase out all fossil fuel.
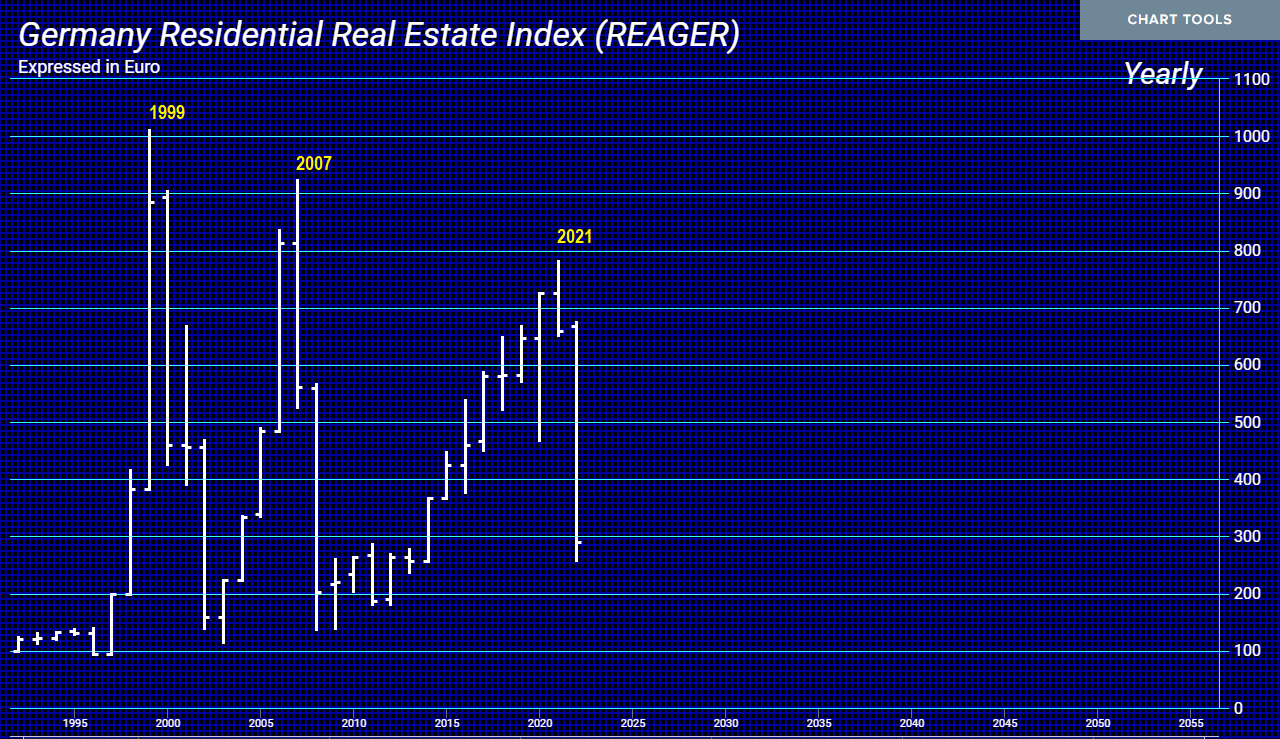
Many have asked why our computer has been so bearish on the Euro. Just look at German Real Estate. The high was in 1999 in both nominal and real terms. Then look at 2007. That was the real estate boom in the USA with the Mortage-Backed disaster. It never exceeded 1999 high. Now, look at the 2021 high. Once again, we see a lower high. Here we are 23 years from the 1999 high and still making corrections. Add to all of this the deliberate energy crisis and the rising costs just to stay warm are very serious.
Germany is the heart of the EU. Without a solid economic performance from Germany, the Euro is doomed.
When this hit upper midwest I was in middle school in San Diego. I was in the library every morning before school following this, Voyager and Viking.
I watched another rendition of this video on youtube and it cut out the portion where the chief scientist at Lamont-Doherty (Columbia) stated ice-age conditions can return inside of 10-20 years time at any time (or something like that).
Regards
RD, San Marcos Ca
REPLY: With Ice Ages, we find a similar pattern of cyclical pattern formations as we do in markets. About 2.6 million years ago, that is when the Earth entered the Pleistocene period. This was marked by an interesting cyclical pattern whereby there were these deep ice ages that came at regular 43,000-year intervals. Then about 1 million years ago, the Earth entered what is known as the Mid-Pleistocene transition period. It was here where these ice age cycles suddenly expanded from 43,000-year intervals to nearly 100,000-year cycles. The last one was about 11,000 years ago. This is not referring to the Mini-Ice Age of the 1600s.
What we do know is that there were tiny changes in Earth’s orbit. These events are known as Milankovitch cycles. They are believed to have driven the planet in and out of these ice ages. However, it is also now assumed that these Milankovitch cycles have not correlated to the sudden jump in nearly doubling the Ice Age cycle length.
Preliminary data from Antarctic Ice Core saw a transition from glacial to interglacial conditions about 430,000 years ago which is known as (Termination V). This transition into the present interglacial period needs to be looked at from intensity using our Energy Models. Scientists look at the magnitude of change in temperatures and greenhouse gases. What seems to be overlooked is the cycle of these warming periods. The interglacial stage following Termination V was quite long running the course of about 28,000 years compared to the 12,000 years period so far in the present interglacial period.
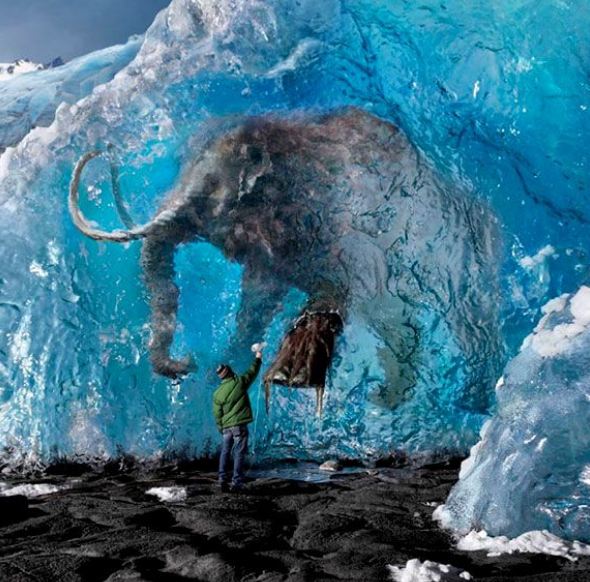
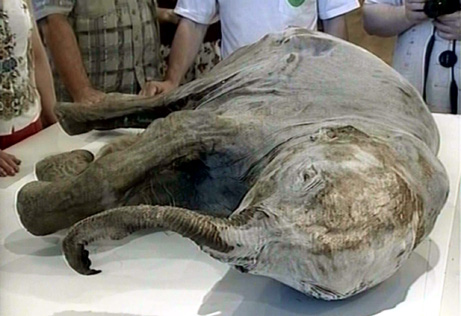
What this is warning is that an Ice Age is not entirely out of the question post-2032. I am awaiting access to the data from the 2.7 million-year core and then run it through Socrates to see if we are indeed going to see a 12,000-year interval or a doubling effect. What does appear to be likely, which explains the frozen animals in Siberia, is that we can see an Ice Age hit within less than 10 years.
What is absolutely astonishing, is that this entire global warming propaganda that they then changed it to climate change because it was not just getting warmer – but colder. The entire premise is that the climate is changing all because of the Industrial Revolution and they REFUSE to address the fact that there are natural cycles to weather since the Earth was born.
I had to go to New Jersey for the Holiday. OMG – it was 10 degrees. It reminded me why I moved to Florida to get closer to real Global Warming. There us a cycle to absolutely everything. Only a complete idiot would argue against that.
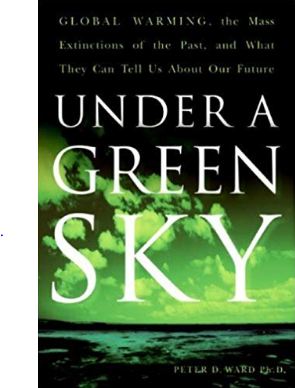
During the 1970s, scientists were all predicting a new ice age. That was the popular view. Then there was a totally theoretical proposition laid out in the book Under a Green Sky that has become the bible for the total destruction of our modern society and just maybe they know that and are looking to deprive energy to reduce the population.
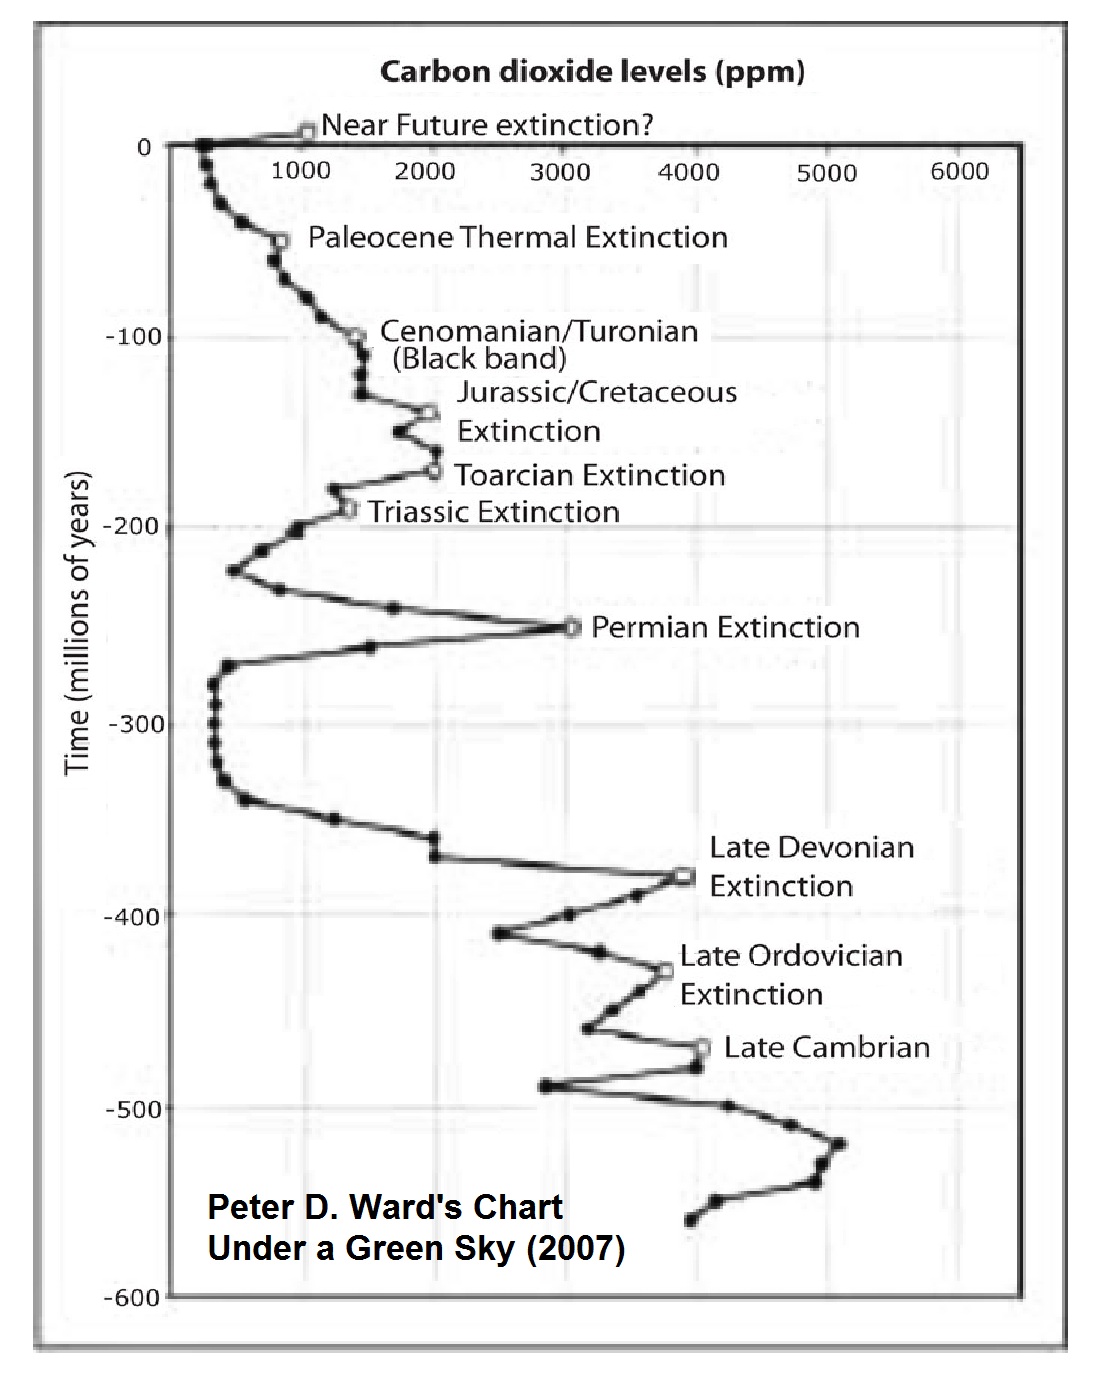
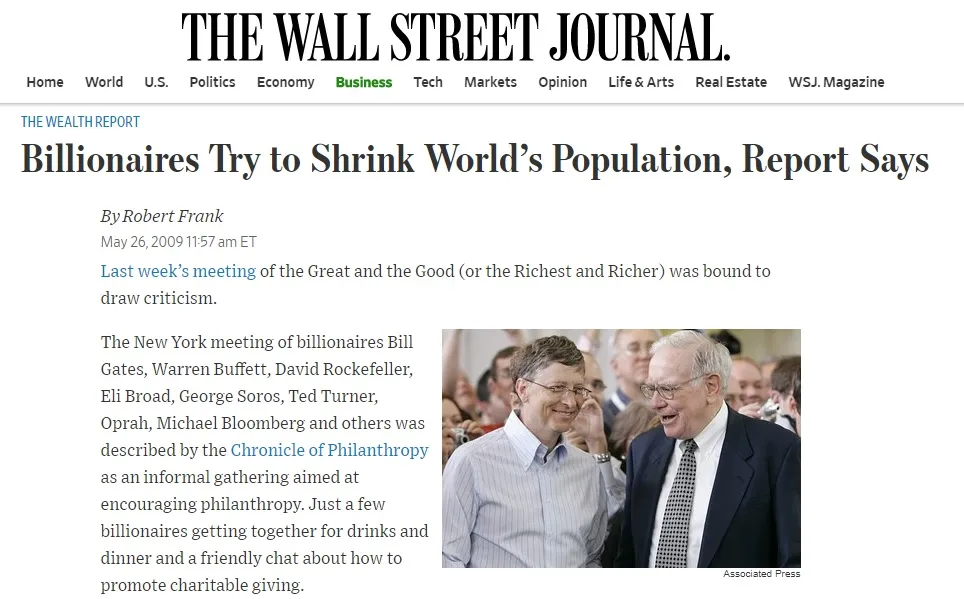
If we take the graph from the paleontologist Peter D. Ward’s book, “Under a Green Sky” published in 2007, this is what has inspired this whole climate debate and there is no evidence that it was CO2 that created an extinction of hundreds of millions of years ago. This has been a theoretical model that appears to be as reliable as the one funded by Bill Gates to justify locking down the entire world economy for a man-made virus – COVID19.
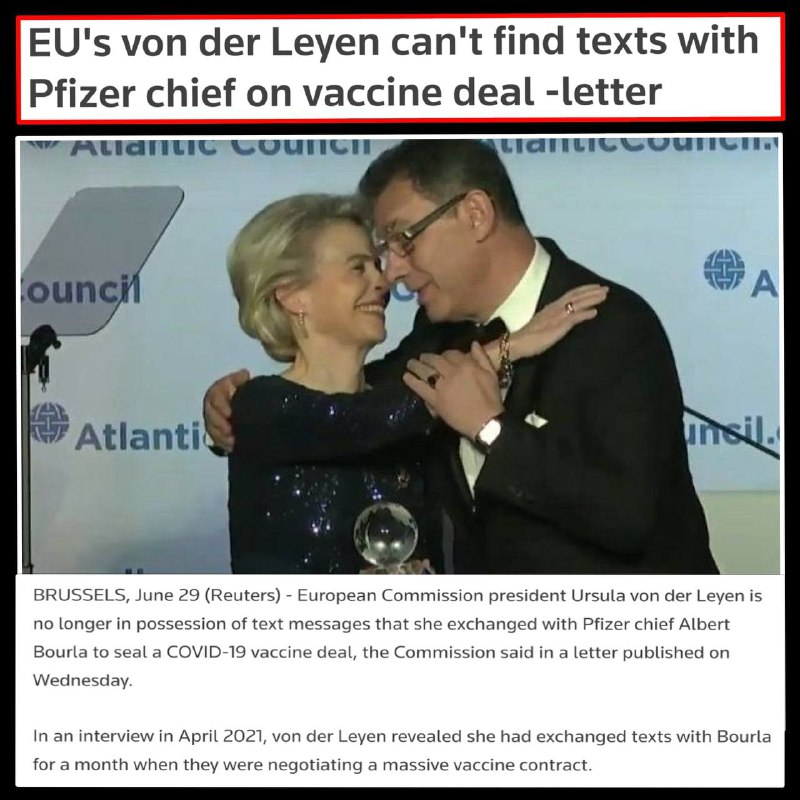
I find it really hypocritical that they want to imprison Trump, but not people pushing to reduce the world population and mandating a vaccine that FAILED to prevent the virus and more people who died of COVID who were vaccinated than not.
When the head of Pfizer seems to be way too close to heads of state and he has ABSOLUTE IMMUNITY that not even the International Criminal Court wants to charge Putin but not Pfizer, is just another example of the political cesspool we live in today.
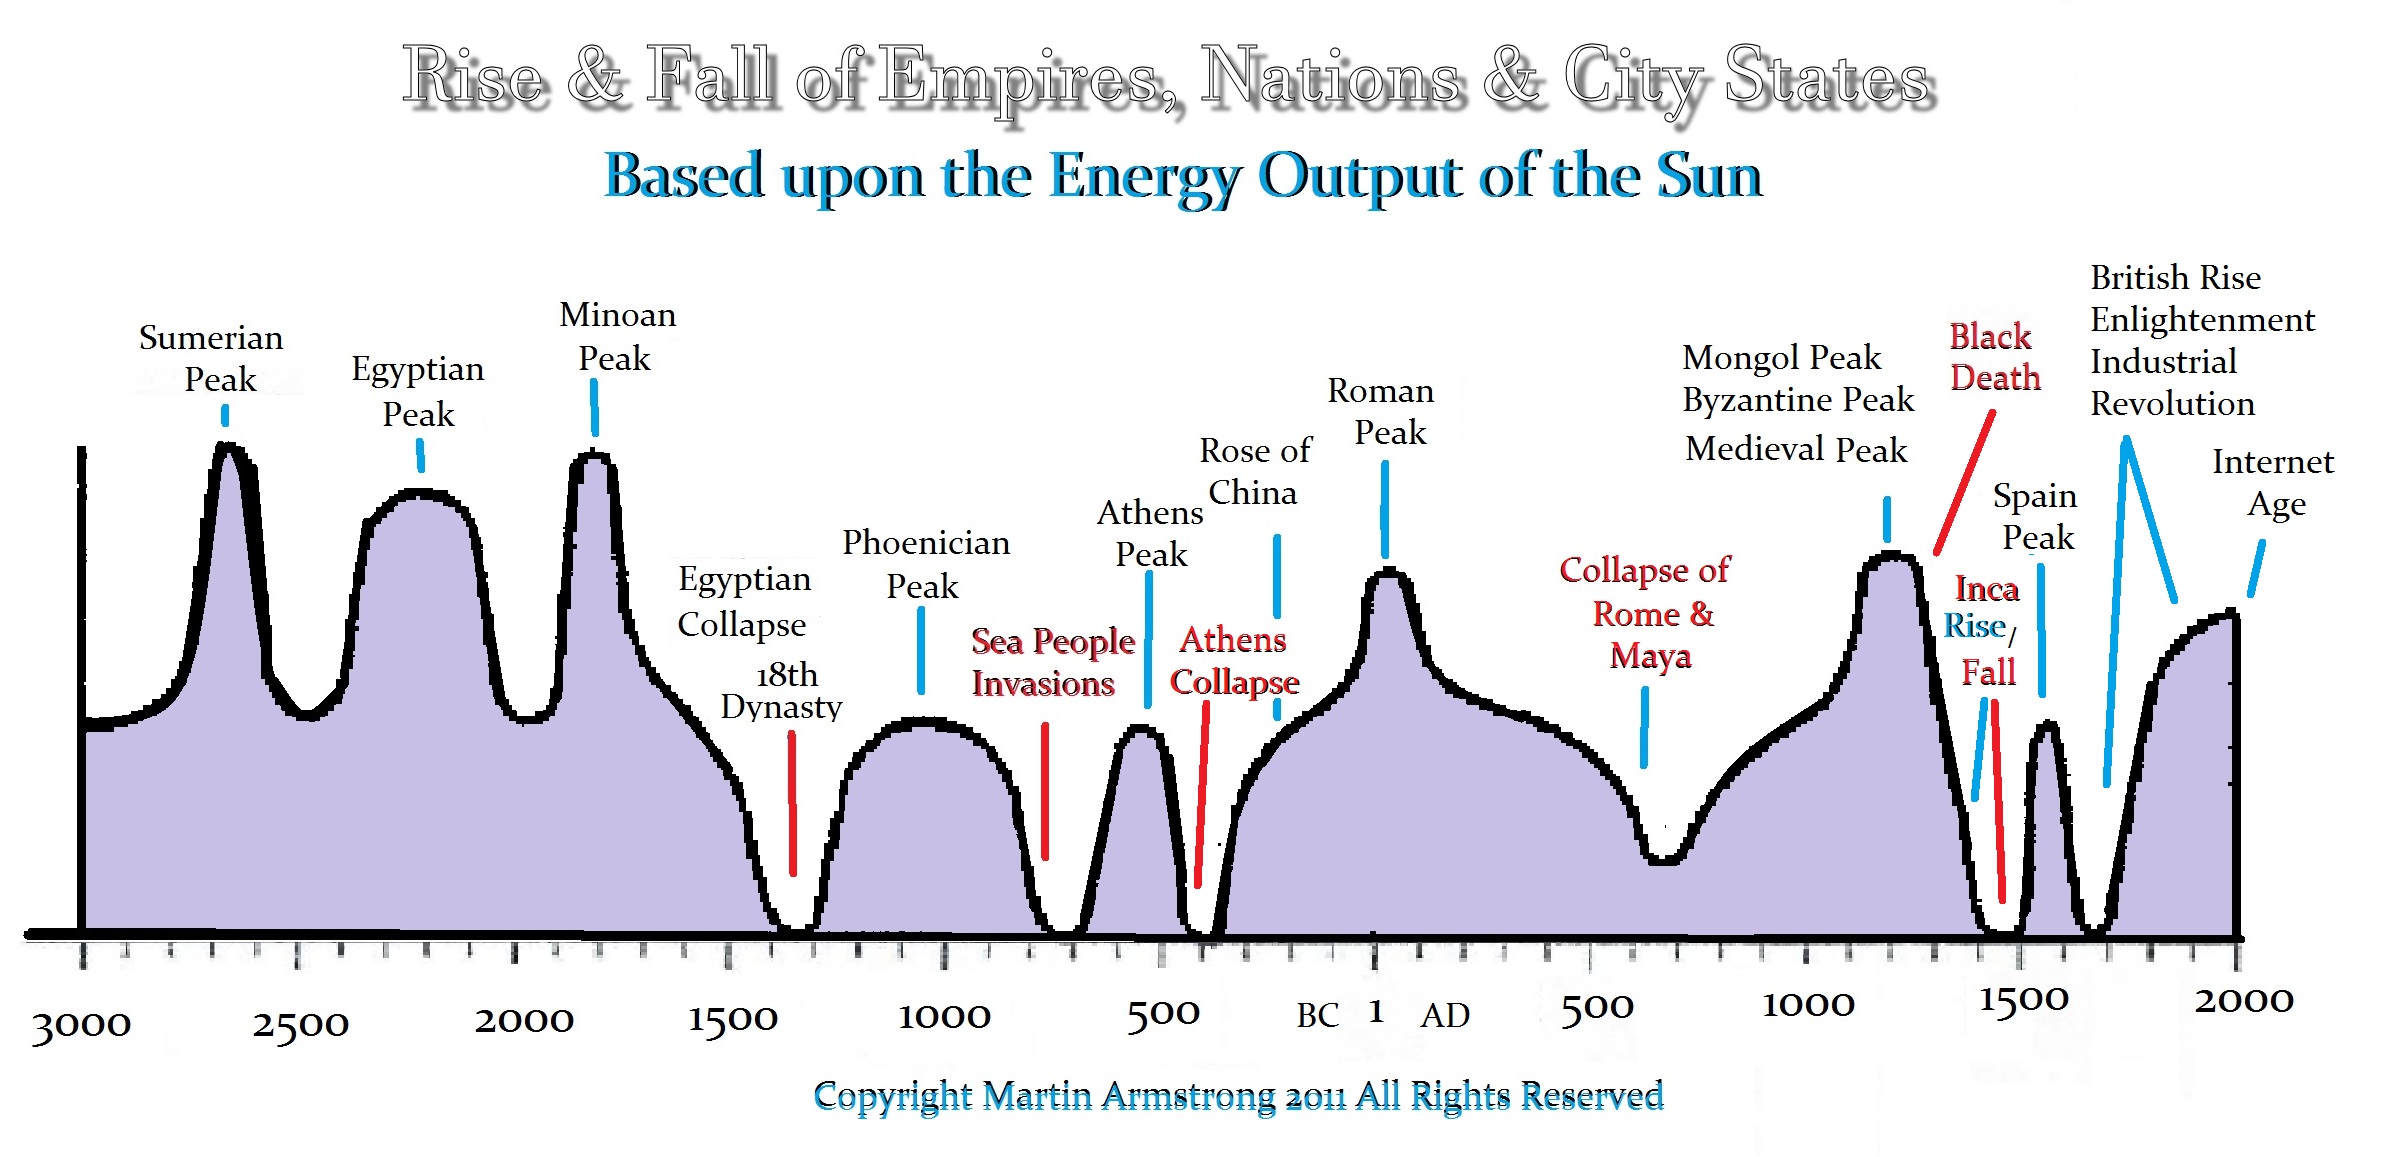
The rise and fall of civilizations have been tied to climate. They ignore history and refuse to comprehend that there are simply cycles to everything. When Rome was the dominant power, there was pollution and CO2 which was created by burning wood. The first clean air act was put into law in 535 AD. These people act like we will all become extinct unless we reduce CO2 to zero. They have no science to back them up, just a book that put the theory about CO2 creating one of the extinctions without any evidence — just an assumption.
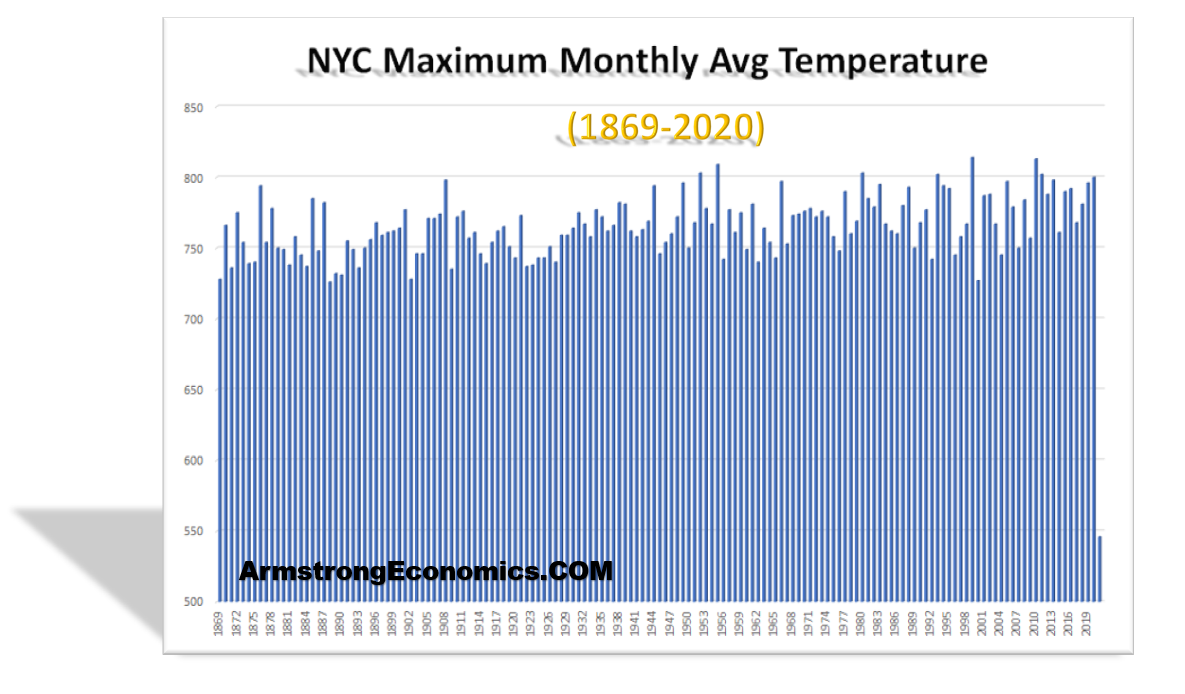
There is ABSOLUTELY no statistical evidence whatsoever that there has been any Global Warming. Here are the monthly maximum temperatures for New York City since 1869.
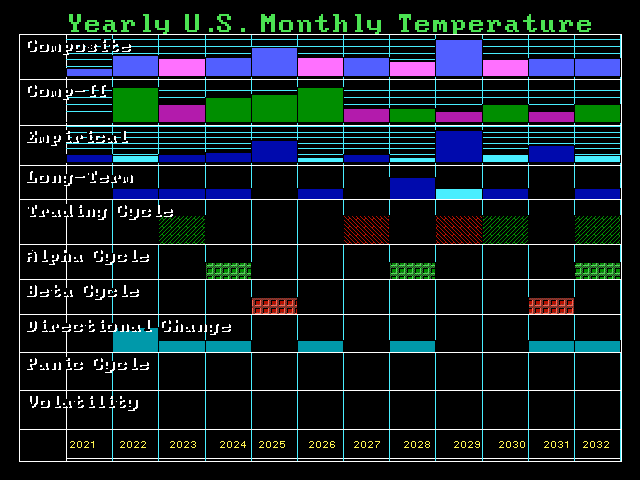
Here is the Computer cyclical forecast for 12 years. This year 2022 was a Double Directional Change and it was on target. The big targets for the climate crisis will be 2025 followed by 2029 – and it will not be warming.
The real question remains unanswered. Are these people claiming Climate Change to deliberately reduce the population?
QUESTION: I find it interesting that the Roman coin the academics said was fake has now been shown that it had been in circulation. Is this what you talk about how academics are always trying to reject anything that upset their established view of science or history?
SC
ANSWER: Absolutely. It does not matter the field. It is always the same. The Book Historia Augusta they swore was a fake and attributed it even to a monk a few years before. Then there was Homer. They declare that was all fiction until Schleman set sail and discovered Troy, Mycena, Thebes and all the cities they said were fiction. Why this is the standard I cannot explain. They rejected Keynes until the politicians turned to the idea. They reject the existence of a Business Cycle to this very day. You have to beat them over the head with something to prove your point.
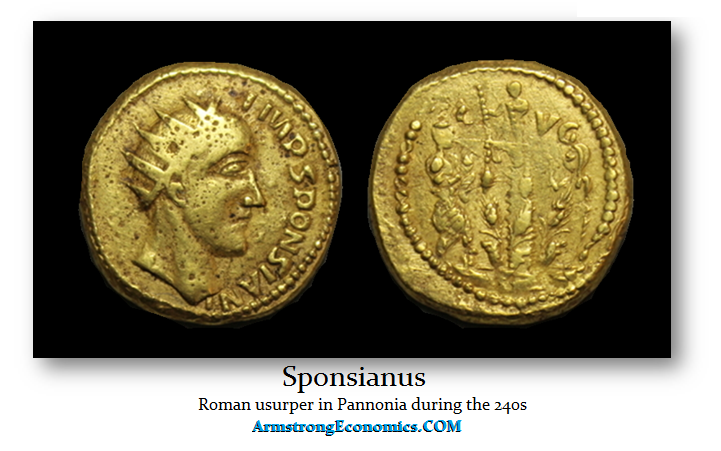
Sponsianus was aA second usurper from the Danube region, which today they claim is Ukraine. Sponsianus appears to have come to power briefly in Dacia defending the area from an invasion of Germanic tribes of the Alamanni in 244AD during the early reign of Philip I (244-249AD) based upon coin finds bearing the name Sponsianus who was otherwise unknown to history. Like Historia Augusta, the academics immediately called the coin a fake. Anything that seems to upset the academic narrative they immediately reject regardless of the field.
In 1713, two gold aurei bearing the name of Sponsianus were unearthed in Transylvania, Romania together with coins of Gordian III and Philip I known as the Arab. This was followed by the suggestion that Sponsianus was a usurper during the reign of Philip I after he murdered Gordian III. Instantly, most academics declared them as forgeries. Simply because they found no written record mentioning this usurper, they conclude the coin must be fake.
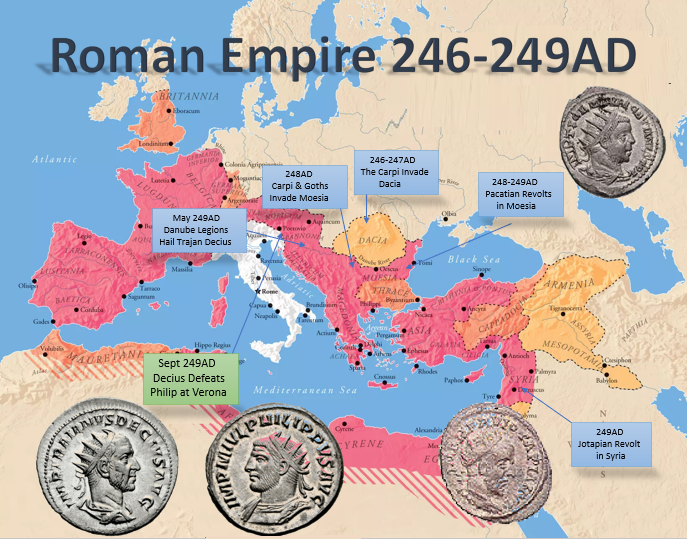
However, this was the precise period when the Goths began to invade. We know that the Carpi began to invade Dacia no later than 246AD and within one year they were joined by the Goths to invade Moesia, which included the find site which was in Transylvania, Romania. We know of one other usurper at this time in the same region Pacatian (248AD), but in the end, he was murdered by his own troops. There was yet one other usurper – Silbannacus who is known only from a single coin that now resides in the British Museum. Silbannacus most likely led a very short-lived rebellion during this same period on the Rhine perhaps about the same time period as Pacatian in the Moesia (Romania).
Silbannacus appears to have defended the region against the Alamanni during the first half of 244 AD was coins declare a victory as well as a usurpation of power with the support of the Senate. It is possible that Sponsianus may have been Severus Hostilianus of the Byzantine sources which may have confused him with Hostiliaisn (251AD), the young son of Trajan Decius (249-251AD).
Consequently, Sponsianus may be the same person noted by his Zonaras who refers to Severos Stilianos. It may have been the usurpation of Marcus Silbannacus and his support by the Senate that forced Philip to make concessions to the Persians. No emperor Sponsianus is mentioned in the Historia Augusta.
What we do know is that Philip I had murdered Gordian IIIin his attempt to seize the throne. However, he was not equipped to manage the entire empire. As the invasions began from the Northern Germanic tribes, this is clearly why we see these usurpations, not from a quest to seize the throne as much as the political turmoil facing these invasions.
Trajan Decius (249-251AD) was hailed emperor by the troops on the Danube and and he marched against Philip I and defeated him and his son at Verona. However, Trajan Decius was then the first emperor to be killed in battle against the Goths. It was because of these invasions that Trajan Decius took this as the Christians refusing to honor the gods of Rome angered the gods and as such he ordered the first widespread persecution of the Christians in 250AD because of these invasions.
History of the Region
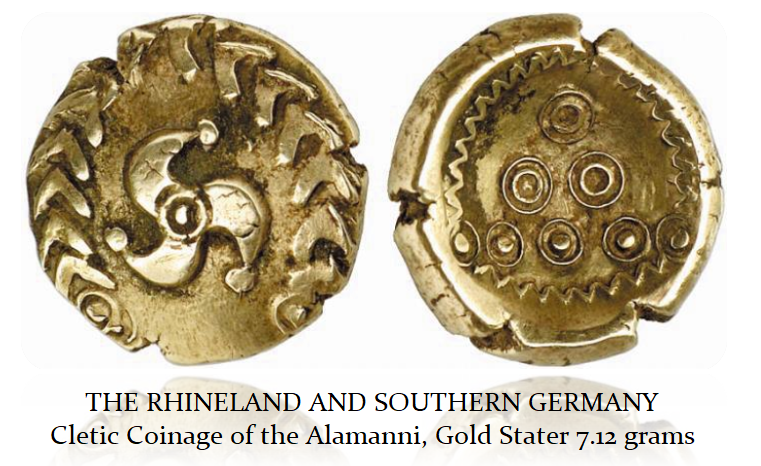
The Alamanni several Germanic tribes including the Ubii, the Sicambri, the Teneteri, the Usipetes, the Catti, and the Cherusces. They were the inhabitants of the upper and lower Rhine, and those beyond that great river, such as the Westphaliaus, the Hessians, and the Saxons, as far as the Elbe and the Weser. They did not imitate the Roman coinage but issued their own Celtic gold staters early on.
It was Drusus, during the time of Augustus (27BC-14AD) who constructed forts and established garrisons throughout this region, in order to hold the Germanic tribes in check; at the same time that he opened a road for his troops through the Hyrcanian forest. The victories of Drusus (brother of Tiberius (14-37AD) over the Alamanni were well known. However, those exploits were not followed by the expansion of the empire and the subjugation of the Germanic tribes of that region. Thus, that area was never reduced to the form of a province.
Following this period, the Alamanni inhabiting that part of Germany, which is situated between the Danube, and the Upper Rhine, were finally subdued at first by Caracalla (198-217AD), and later by Aurelian (270-275AD) Later on, the father of Constantine I the Great (307-337AD), Constantius Chlorus (393-305), while still a caesar under the Tetrarchy, overthrew them with a great slaughter. They continued, nevertheless, from time to time, to wage war against subsequent emperors, from Constantine the Great to Gratian (367-383AD). They were finally brought to subjection 496 AD when they met with a major defeat by the Franks under King Clodovicus.
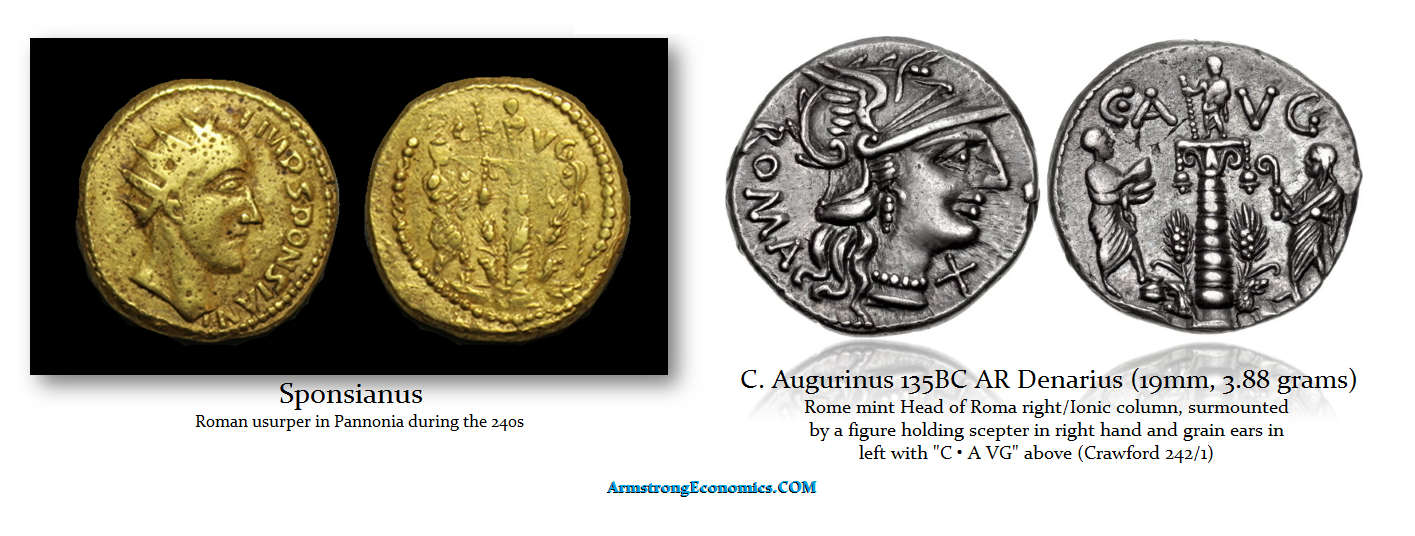
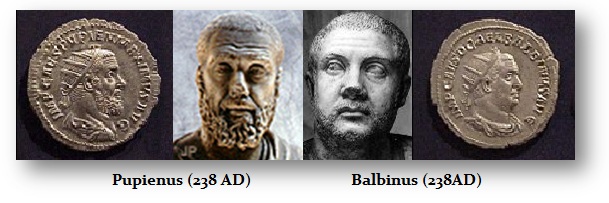
The primary reason for the Academic rejection of these coins stemmed from that reverse of the coin depicts an image borrowed from coins minted by C. Augurinus dating back to 187 BC. The inclusion of the Republican era reverse has led to suggest that Sponsianus was the leader of his senatorial resistance against Philip I. In opposition to this, some academics have suggested that it is unlikely that his senatorial recognition would have used along with a Republican reverse from the coins celebrating the family of the Minucii by C.Augurinus.
because there existed emperors appointed by the Senate of Pupienus (238AD) and Balbinus (238AD) Therefore, it has been argued that if Sponsianus was supported by the Senate he would have used a more current theme for his coinage. While the series is interesting, they certainly are not conclusive. It cannot be ruled out that Sponsianus perhaps claimed his right to the throne arguing he had descended from that ancient senatorial family. After all, Constantine the Great did that with Claudius II (268-270AD) in an attempt to so some legitimacy.
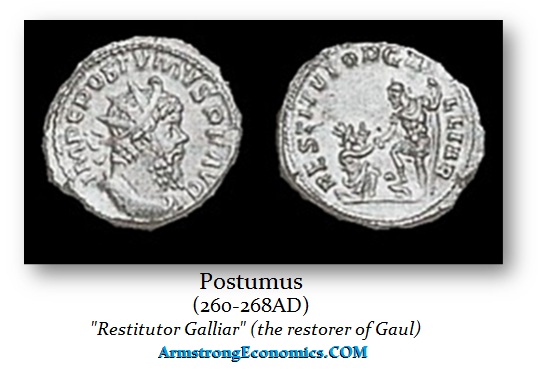
It is most likely that there were invasions in that area on the Danube frontier whereas he may have been held Emperor to defend the local region from the invaders. We have seen this before even for example Postumus (260-268AD) who claim the throne of the Gallic Empire to protect the people from invaders from the North. He issues coinage showing he was there to protect them from the barbarians which Rome could not. This region of the Danube was under attack at the time around 244 AD by the Alamanni the Germanic tribes. There have been additional ports of coins discovered in Romania that also date to this period of 244 AD suggesting that there was political instability and war in the region during that time.
Posted originally on the conservative tree house on December 22, 2022 | Sundance
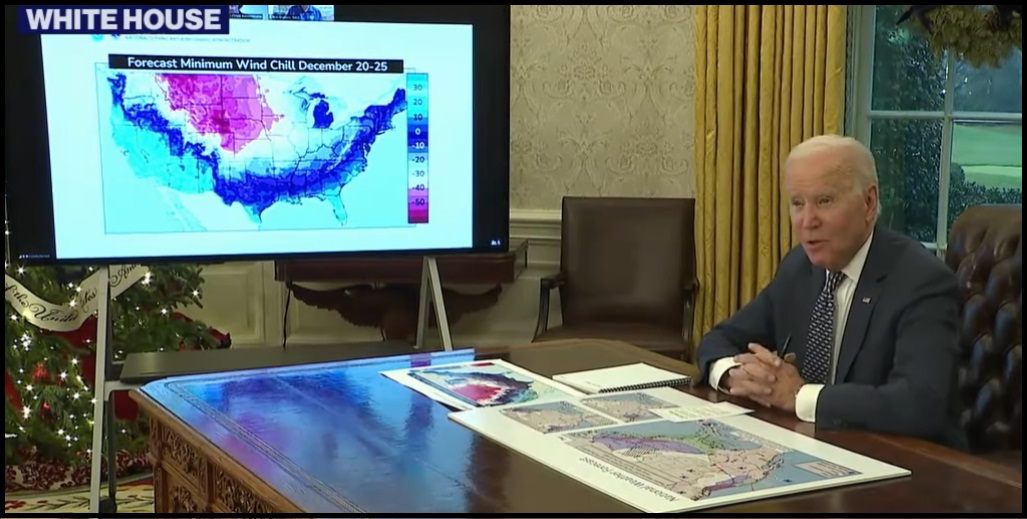
Extreme winter weather, such as subzero temperatures, wind chills and heavy snow, is impacting much of the U.S. this Christmas holiday weekend and is expected to heavily impact travel. Major parts of the U.S. electricity grid are very vulnerable, particularly as a result of Biden energy policy, steering investment away from coal, oil and natural gas.
Places across the northern Rockies, northern Plains and upper Midwest are experiencing temperature drops by tens of degrees in minutes. The extremely cold airmass is expected to hit at least 24 other states along the Gulf Coast and in the eastern U.S. The National Weather Service has a Detailed Warning HERE.
The potential for severe consequences as an outcome of this winter storm has the political minders of Joe Biden worried.
.
(Via NWS) – A major and anomalous storm system is forecast to produce a multitude of weather hazards through early this weekend, as heavy snowfall, strong winds, and dangerously cold temperatures span from the northern Great Basin through the Plains, Upper Midwest, Great Lakes, and the northern/central Appalachians.
At the forefront of the impressive weather pattern is a dangerous and record-breaking cold air mass in the wake of a strong arctic cold front diving southward across the southern Plains today and eastward into the Ohio/Tennessee Valleys by tonight.
Behind the front, temperatures across the central High Plains have already plummeted 50 degrees F in just a few hours, with widespread subzero readings extending throughout much of the central/northern Plains and northern Rockies/Great Basin.
These temperatures combined with sustained winds of 20 to 30 mph and higher wind gusts of up to 60 mph will continue to lead to wind chills as low as minus 40 degrees across a large swath of the Intermountain West and northern/central Plains, with more localized areas of minus 50 to minus 70 possible through the end of the week. (read more)
I am reminded of Fort Wainwright, Alaska, in January of 1989, when a cold airmass settled on the state for weeks. It was so cold (-50°, -70° or worse) that airplanes could not achieve lift. McGrath went from +29° to -42° during a work shift. During a single work shift everyone’s truck tires were flat and frozen. LOL… Crazy stuff.
Joe Biden – “I’m going to, shortly, be briefed by — by both FEMA and the National Weather Service, and we’re going to start that briefing. And — but in the meantime, please take this storm extremely seriously. And I don’t know whether your bosses will let you, but if you all have travel plans, leave now. Not — not a joke. I’m tell- — sending my staff — my staff, if they have plans to leave on — tomorrow — late tonight or tomorrow, I’m telling them to leave now. They can talk to me on the phone. It’s not life and death. But it will be if they don’t — if they don’t get out, they may not get out. So, any rate, thank you all for coming in, and I’m going to do the briefing now. Thank you.” (link)
The polar air will bring “extreme and prolonged freezing conditions for southern Mississippi and southeast Louisiana,” the National Weather Service (NWS) said in a special weather statement Sunday.
“We’re looking at much-below normal temperatures, potentially record-low temperatures leading up to the Christmas holiday,” said NWS meteorologist Zack Taylor. (link)
QUESTION: Marty, we had an earthquake here in Northern California today that seems to be following your forecast building into 2028. Can you update your earthquake chart?
Thank you
Jeff
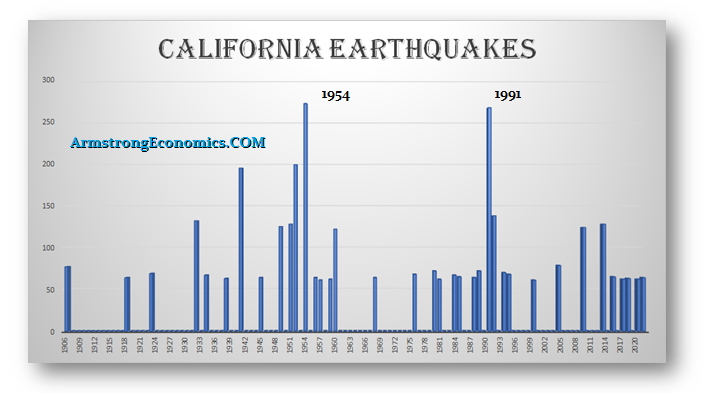
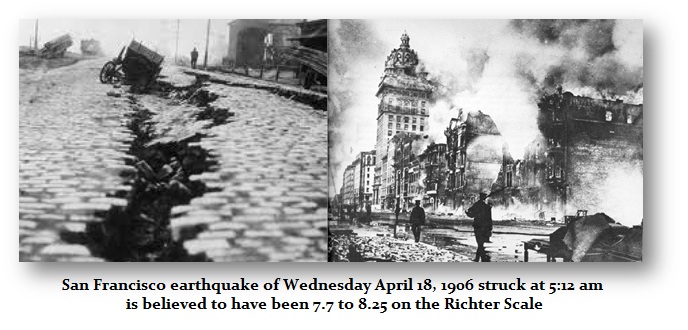
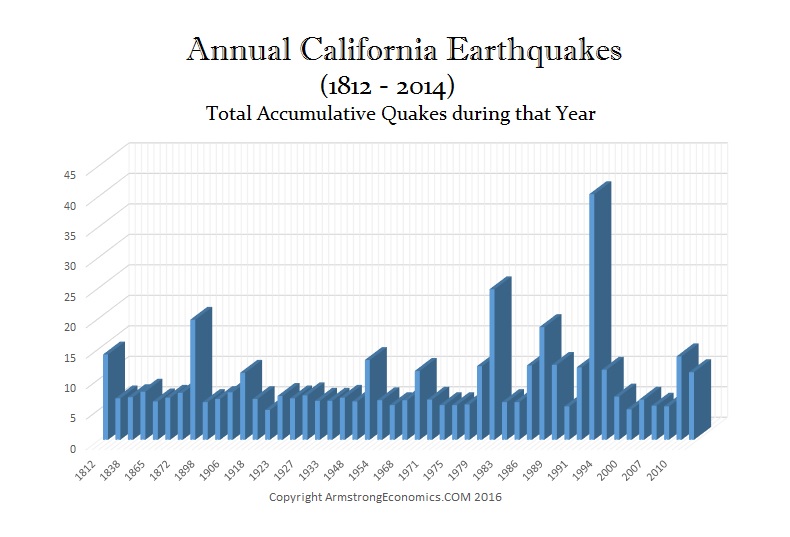
ANSWER: Here is the update. Socrates has already pulled that data down. Yes, the trend appears to be building into a serious cluster for 2028 which may exceed that of 1954. This chart is recording ONLY those quakes that are 6.0 or higher. There are numerous quakes in the 4 to 5 range. It was the 1906 Earthquake that set in motion the Panic of 1907 since the insurance companies were in NYC and the claims were in California. It was JP Morgan who stepped up to save the banks in NY and that became the model for how the Federal Reserve was created with 13 branches to manage the regional capital flows that resulted in the financial crisis in the aftermath of the 1906 San Francisco Earthquake which was a 7.7 on the Richter Scale.
This chart presents the total number of quakes regardless of the magnitude. Here we can see that 1992 was the year with the greatest number of quakes irrespective of magnitude. This is a different perspective entirely. The top chart is what I have called the cluster perspective where we only took into account 6.0 or higher. This illustrates that just like market activity, earthquakes build in intensity. They produce clusters of magnitude. The next serious period should still be 2028.
QUESTION: I have been following Socrates for quite a while. It certainly seems to provide the long-term view quite reliably. You said it has taught you. So I take it that is why it is AI because you did not precisely code it to do these things?
WK
ANSWER: I created Socrates to monitor everything. As a hedge fund manager, I could see how everything was connected. Read Herbert Hoover’s Memoirs for 1931 and it accurately described how a panic unfolds is led by a liquidity crisis the same as when Russian bonds collapsed in 1998 creating the fall of Long Term Capital Management.
Any mistakes are mine personally in the interpretation. That is what I mean by it has taught me a lot over the years. A lot of clients just rely on Socrates – not me personally. The arrays are probably one of the important aspects. Once again, it has nothing to do with my opinion. So many clients get familiar with it and apply their own interpretations.
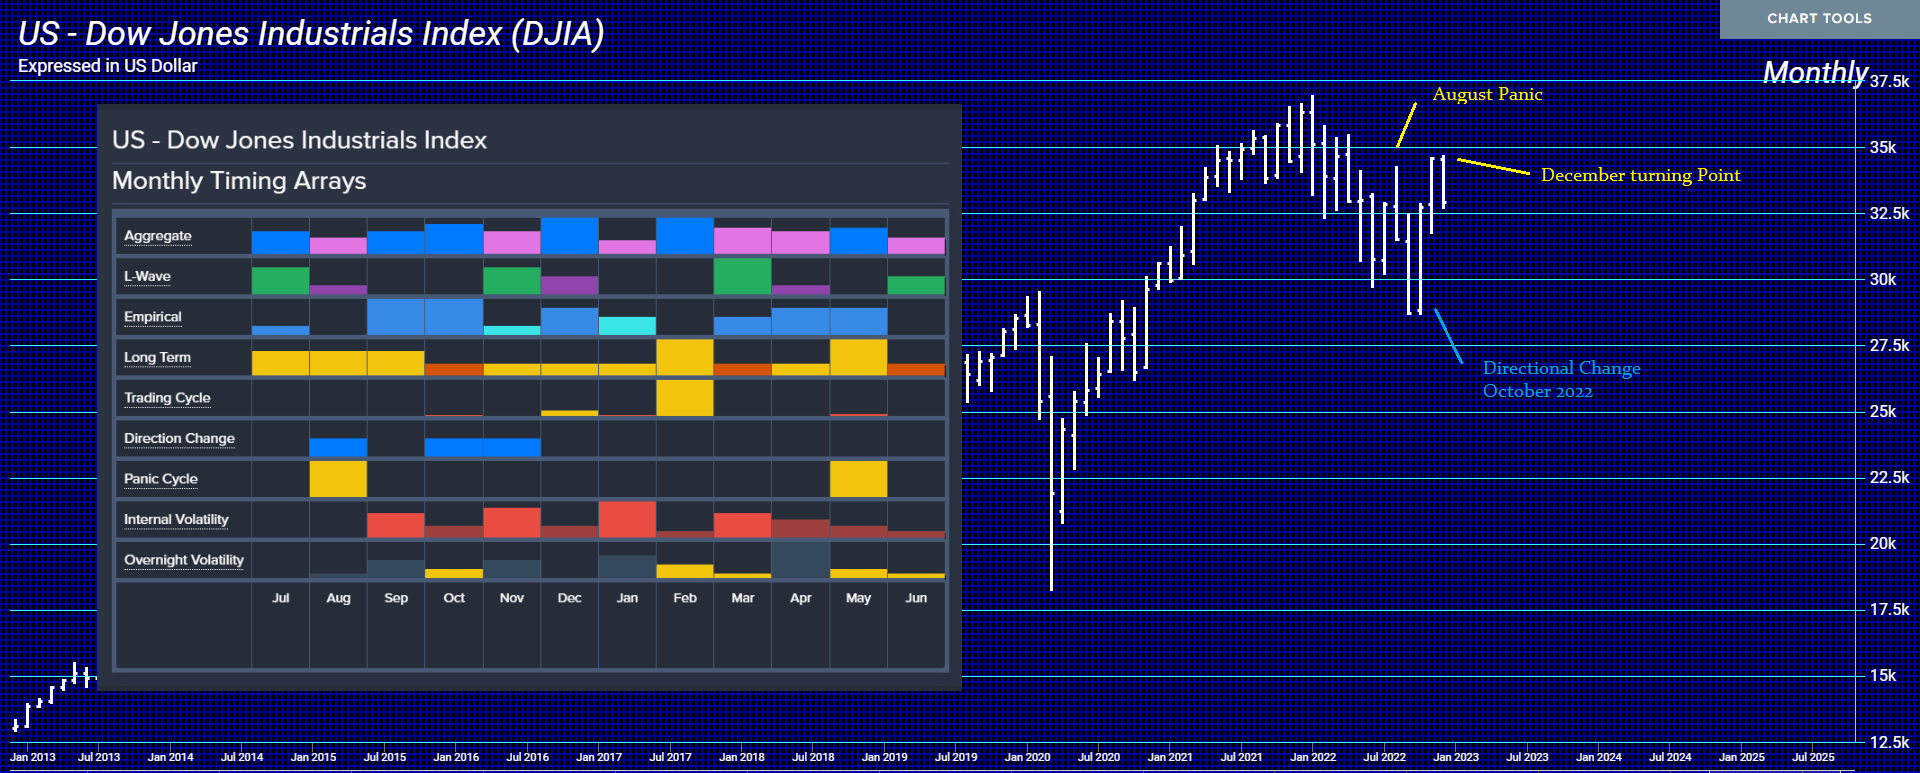
Here is the array we published in July and we were touting the August/September period all year. We can see the violent thrust up and then down – the typical panic but over two months. It depends on the week it generally hits. It called for a Directional Change in October followed by another in November and then December made a new high and then retreated.
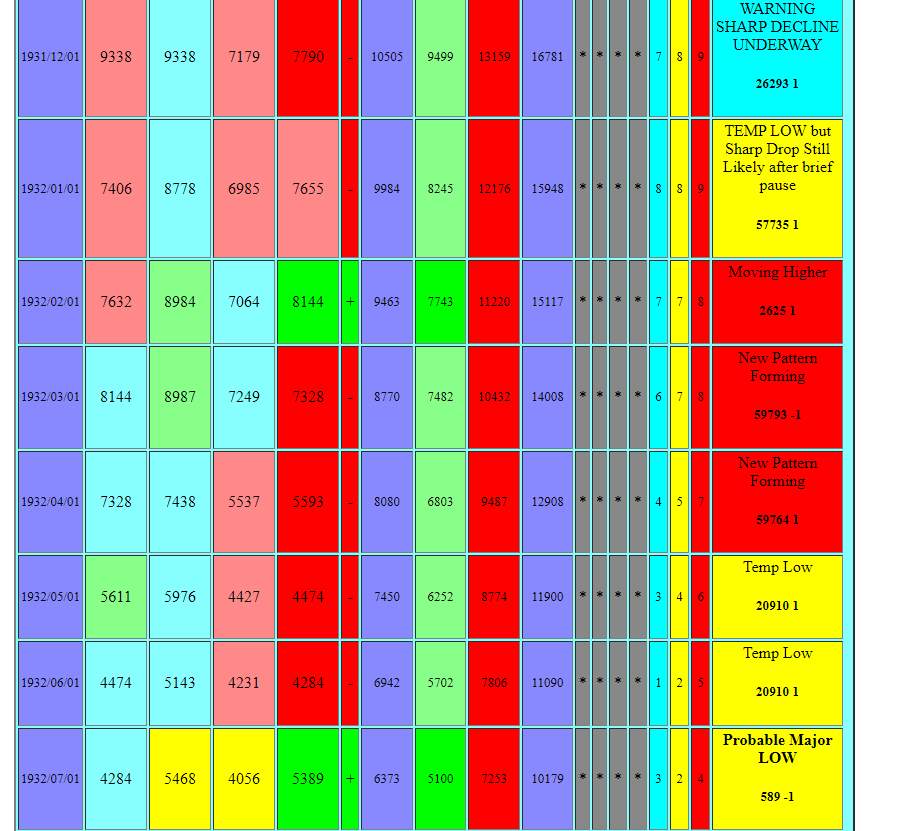
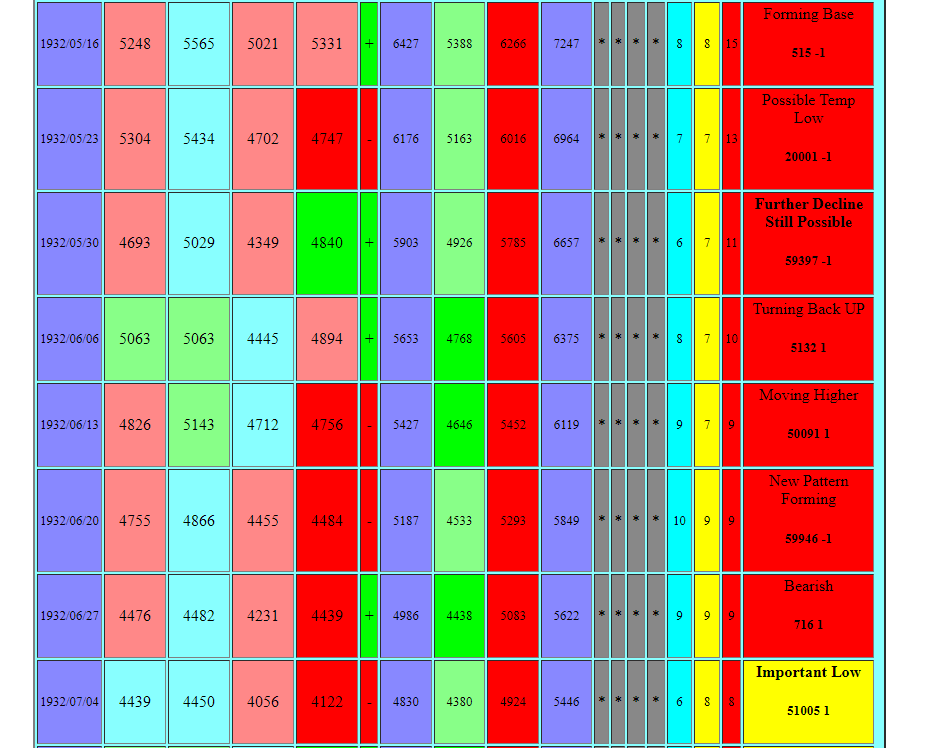
Socrates has done a good job. Once again, it is not me personally making these forecasts. As a human, we are all subject to error. Socrates is not perfect. The Global Market Watch is an ongoing project and I am stunned at how many different patterns it is coming up with. This demonstrates that complexity is an understatement. Below are the Global Market Watch reports for the 1932 low on a weekly and monthly level which was the week of July 4th, 1932. We can see that it is not perfect. When it is saying a “New Pattern Forming” it means this is a new pattern not yet in the database. The number of patterns is approaching 100,000. Nevertheless, it did pick the 1932 low correctly. Not every day into that low. Thus, it is not a trading tool, but something to just alert you to pay attention. Nothing is ever INFALLIBLE.
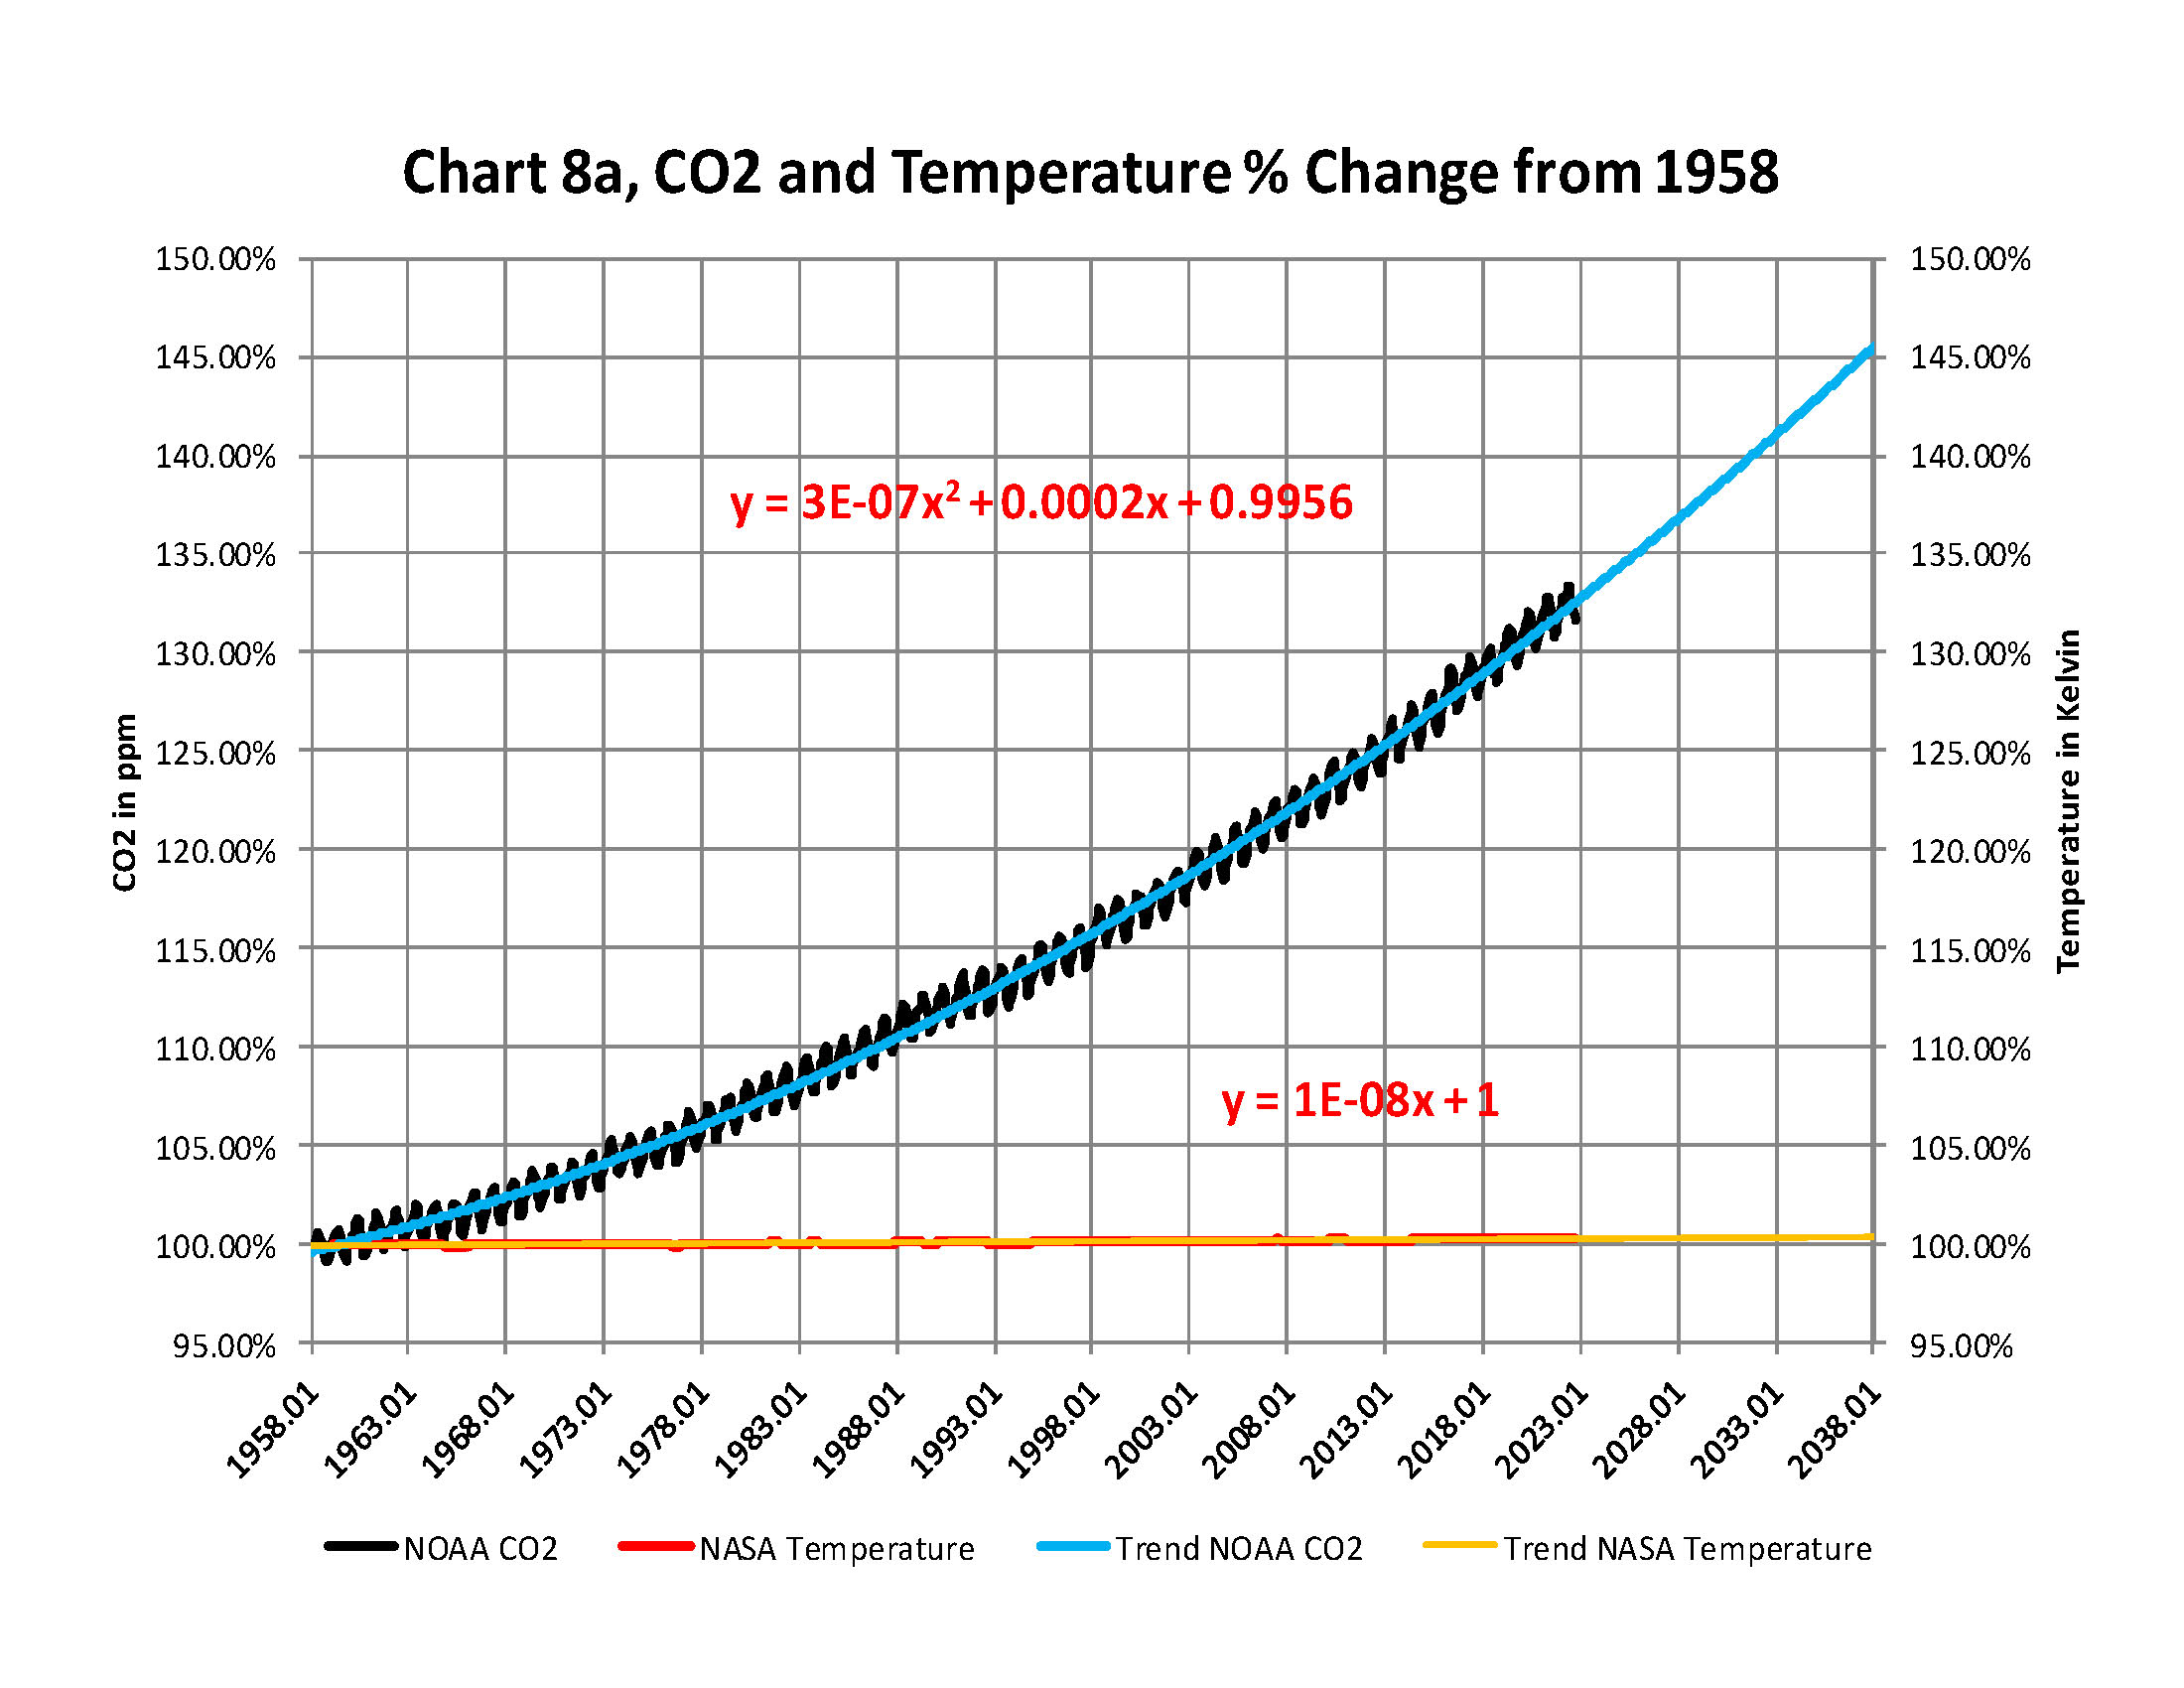
From the attached report on climate change for November 2022Data we have the two charts showing how much the global temperature has actually gone up since we started to measure CO2 in the atmosphere in 1958? To show this graphically Chart 8a was constructed by plotting CO2 as a percent increase from when it was first measured in 1958, the Black plot, the scale is on the left and it shows CO2 going up by about 32.4% from 1958 to November of 2022. That is a very large change as anyone would have to agree. Now how about temperature, well when we look at the percentage change in temperature also from 1958, using Kelvin (which does measure the change in heat), we find that the changes in global temperature (heat) is almost un-measurable at less than .4%.
As you see the increase in energy, heat, is not visually observably in this chart hence the need for another Chart 8 to show the minuscule increase in thermal energy shown by NASA in relationship to the change in CO2 Shown in the next Chart using a different scale.
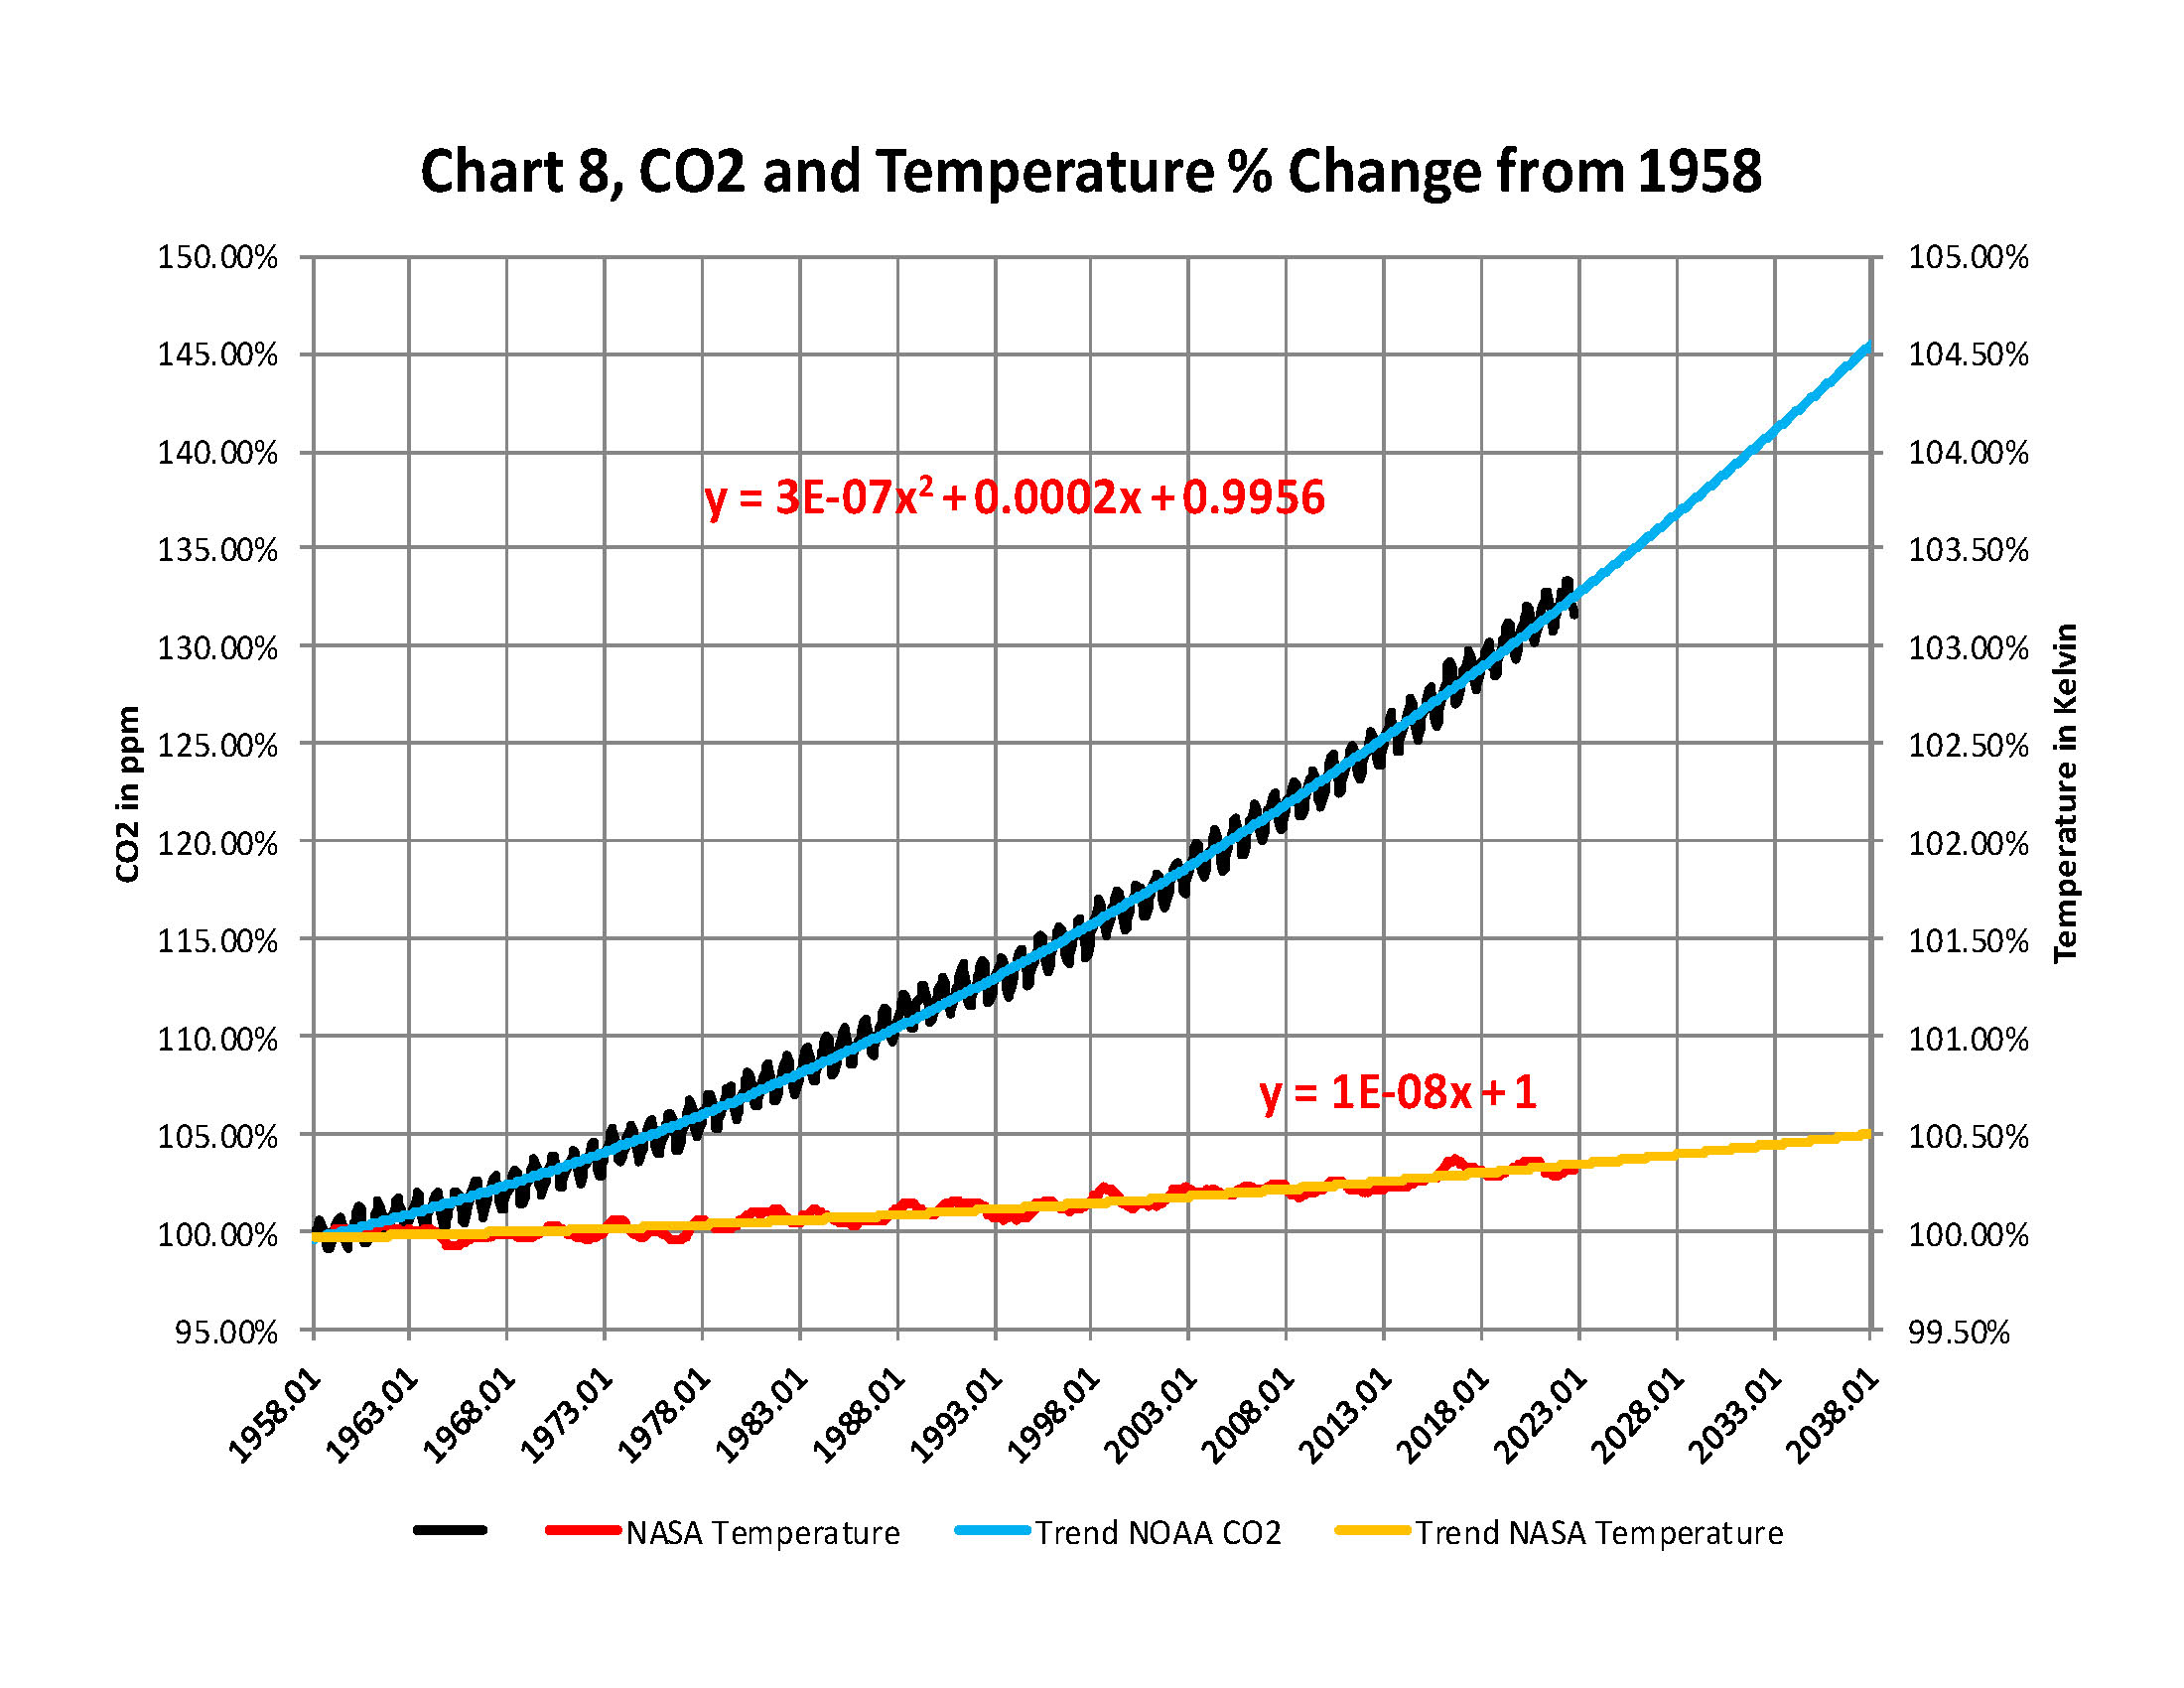
This is Chart 8 which is the same as Chart 8a except for the scales. The scale on the right side had to be expanded 10 times (the range is 50 % on the left and 5% on the right) to be able to see the plot in the same chart in any detail. The red plot, starting in 1958, shows that the thermal energy in the earth’s atmosphere increased by .40%; while CO2 has increased by 32.4% which is 80 times that of the increase in temperature. So is there really a meaningful link between them that would give as a major problem?
Based to these trends, determined by excel not me, in 2028 CO2 will be 428 ppm and temperatures will be a bit over 15.0o Celsius and in 2038 CO2 will be 458 ppm and temperatures will be 15.6O Celsius.
The NOAA and NASA numbers tell us the True story of the
Changes in the planets Atmosphere
The full 40 page report explains how these charts were developed .
QUESTION #1: Once more I am asking: In practical terms, when a Panic Cycle appears, which are the factors that will help us to determine if the movement will be up or down please? Thank you for answering. SM
QUESTION #2: Your Panic Cycle is remarkable and your forecast on Ukraine before 2014 warrants putting you on the front page of every newspaper. Do you think the fact that ________ goes out of its way to find people who will say what your model has and never refer to you as being part of the whole disinformation game? I tend to trust them less and less for never crediting your computer even once as part of the whole cancel culture. What is your view on this silence?
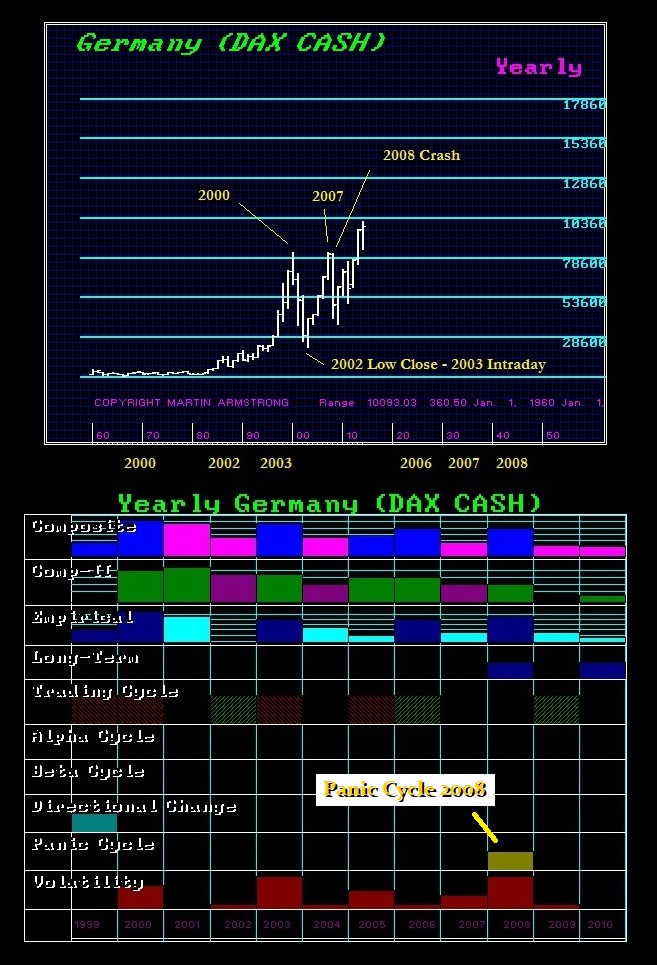
ANSWER: A Panic Cycle, more often than not, can be an outside reversal meaning it can penetrate the previous low, turn around, and penetrate the previous high. It can also be a huge move in one direction. They tend to be events that are a surprise typically engulfed in some news. It is hard to come up with the fundamentals well in advance. But the computer was picking up the 2008 crash as far back as 1999. I took this array from our old site off of the Wayback machine.
We published the computer forecast in 2013 that had pinpointed Ukraine as the place where World War III would begin. That was one year before the 2014 revolution. The ONLY people to call for an interview on that forecast was RT from Russia. That says a lot. No one social media site nor even one mainstream news outlet ever bothered to can to ask how could this computer do that.
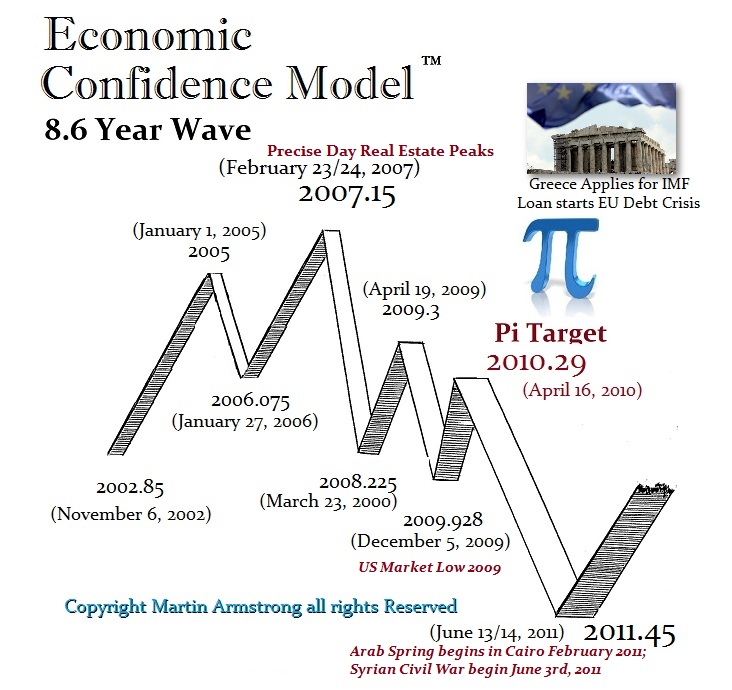
It should be obvious as we move into a Panic Cycle. If a market is rising, be on guard and turn to the Weekly and Monthly levels to see if there will be a big crash or an abrupt breakout. Trying to explain that 2007-2009 would be a major crash was rather simple as you got closer. The very day of the high in the ECM was the precise day of the high in the Shiller Real Estate Index. The Panic Cycle Target of 2010.29 was the precise day that Greece applied for emergency loans from the IMF. It should have been obvious going into that from 2002 that it would have been a crash.
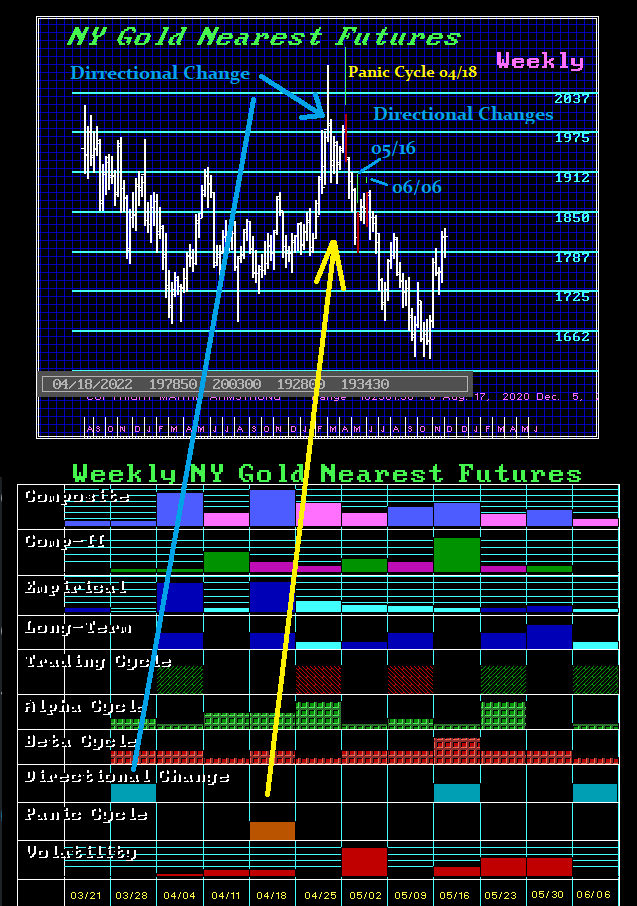
Keep in mind that a Panic Cycle can be an OUTSIDE REVERSAL meaning it can make a new low and high during the same timing interval. Here is Weekly gold. There the Panic Cycle for the week of 04/18/22 was a high as well as a big move in one direction. Note that the top Composite or aggregate was a turning point. This helped to define that it would be a high since the market was rallying into it. Take note that the Directional Change target for the Week of 05/16 produced the low also because it coincided with the target for a turning point on the top line. Note that the next Directional Change was 06/06/22 and that was the highest closing with the next week being an outside reversal to the downside.
Insofar as to why other sites refuse to report the success of Socrates or the mainstream press, a lot of people write in asking if the same site ignores our forecasts and will go out of their way to tout someone else are really part of the undercover proxy war of the government against the free press. I cannot confirm or deny that view, but indeed a lot of people write in question if they are the same thing that is now being exposed with the corruption at Twitter and the government-controlled Wikipedia. Some emails have pointed out that they jump on claiming this breakthrough in cold fusion, but refuse to report on how our computer has projected so many things years ahead of time and could save the world if you got rid of the corrupt politicians and deep state.
As I have explained, the Constitution is a NEGATIVE restraint upon exclusive government. This is how the government has been using social media and mainstream media to cancel people, and ignore others, doing what would be unconstitutional if the Deep State did it directly. So you may be right. If they go out of their way to find someone else, perhaps they too are getting their orders from Washington DC. Guess we need Musk to buy them out too.
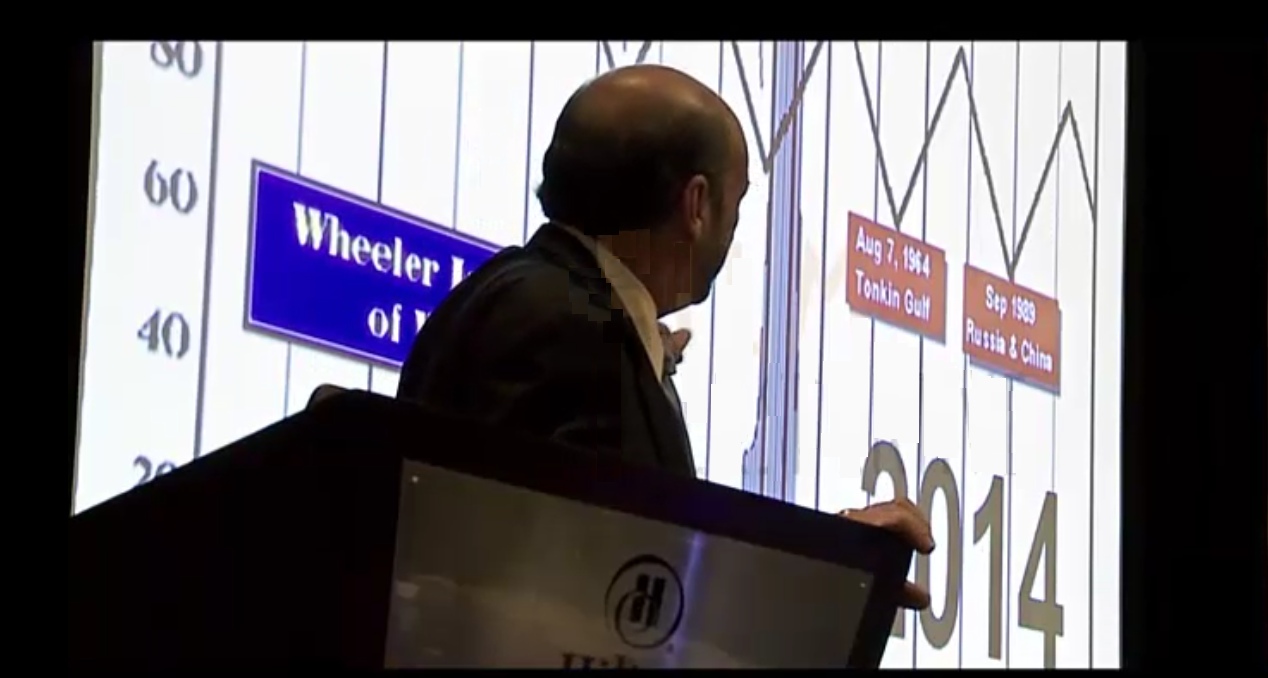
The computer had targeted 2014 for the start of the war. This is me outlining that 3 years in advance at the 2011 World Economic Conference. Some people judge various sites and newspapers that constantly ignore reporting on any of these forecasts as really just part of the Deep State no matter what they pretend to be. After what Musk has exposed, you have to question any of them these days.
I have created this site to help people have fun in the kitchen. I write about enjoying life both in and out of my kitchen. Life is short! Make the most of it and enjoy!
This is a library of News Events not reported by the Main Stream Media documenting & connecting the dots on How the Obama Marxist Liberal agenda is destroying America