QUESTION: Mr. Armstrong; I find your anecdotes fascinating and very enlightening how you always bought German cars and made money on them. Is currency the primary reason people often think something is a good investment when in fact it is really just currency fluctuations?
PVB
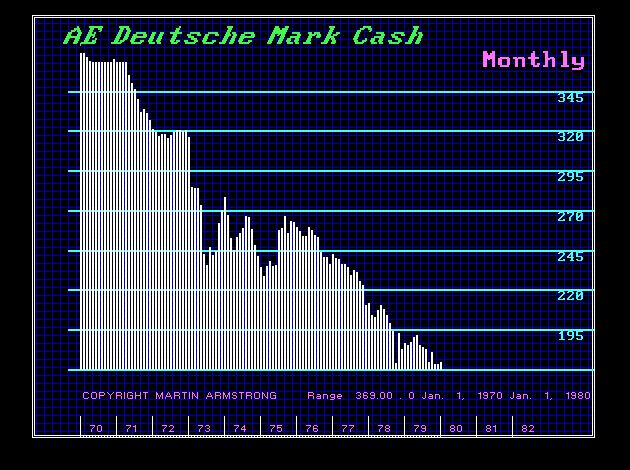
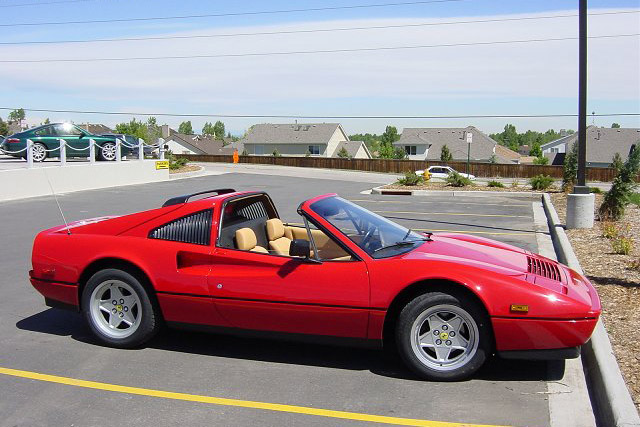
ANSWER: You are hitting the nail right on the head. The decline in the dollar throughout the 1970s made German cars appear to appreciate and this was attributed to quality. This was the entire reason why the German car industry exploded. I have often stated at WEC conferences that I made the same play with a Ferarri in London. When the British pound dropped to $1.03 in 1985, I ran out and used the currency to make some deals. I bought a 328 Ferarri for about $30,000 when in the US it was a $50,000 car. Because the pound had dropped, Ferarri could not afford to sell them in Britain at that price so they raised it £45,000.
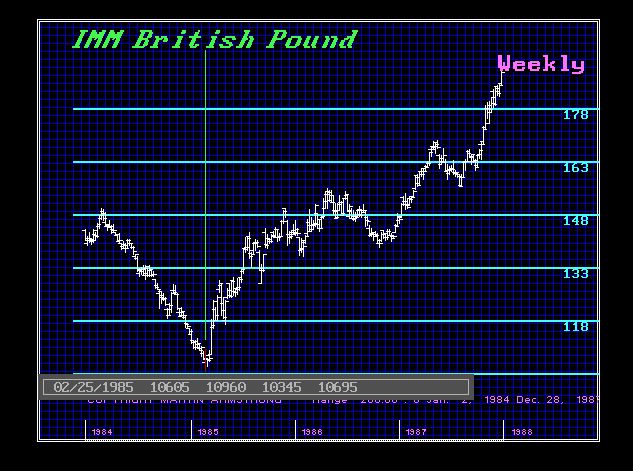
As you can see from the chart I provided, the pound bottomed in February 1985 at $1.0345. After Ferrari raised the price and then the pound went to nearly $2, suddenly a car that cost me $30,000 had a replacement cost of almost $100,o00. This is what led to many people buying several Ferraris and garaging them thinking that the car was the investment.
Currency Inflation is probably the most misunderstood economic force in the matrix. Probably 99% of economists and investors remain ignorant of such trends because they have never dealt in the international world of finance and focused only domestically. Those of us who have been hedge fund managers and worked internationally understand the fluctuations of currency and its impact. This is a lesson still not taught in school and politicians remain oblivious to the real implications.
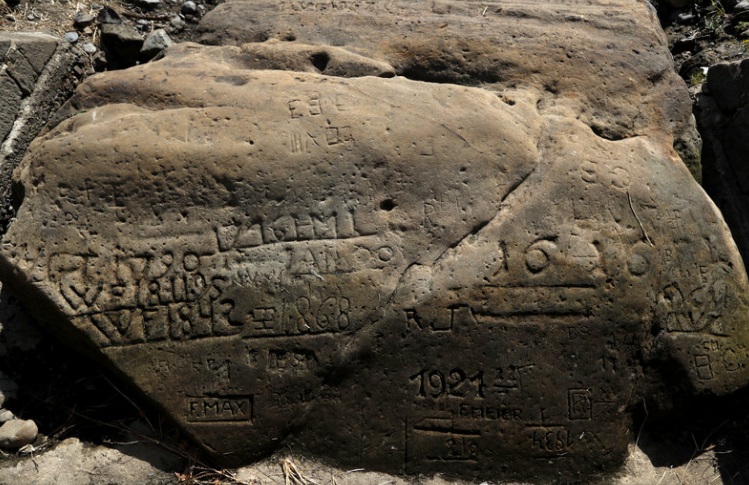
While the Global Warming fanatics are out in force saying “see” the heat in Europe is caused by humans driving their cars around, they continue to ignore history. The extreme heat in Europe this year is part of a cycle. The swings from extreme heat to extreme cold are also not unheard of. Another piece of historical evidence they ignore is known as the Hungry Stones. Pictured here is a Hungry Stone from 1616 which has been exposed by the low level of water in the Elbe River. This is at Decin, in the Czech Republic. Throughout the centuries, there have been these cycles of extreme heat followed by extreme cold. Such events have been recorded when drought has resulted in the low level of water in the Elbe river.
This year’s drought in Europe has exposed once again the Hunger Stones that have been used for centuries to commemorate historic droughts which warn of their consequences when you see these stones again. The Hunger Stones are visible in the Elbe River once again. This is a major river which begins in the Czech Republic and flows through Germany. There are more than a dozen Hunger Stones that serve as records of previous droughts establishing that the extreme heat and drought of this year is by no means unique to history.
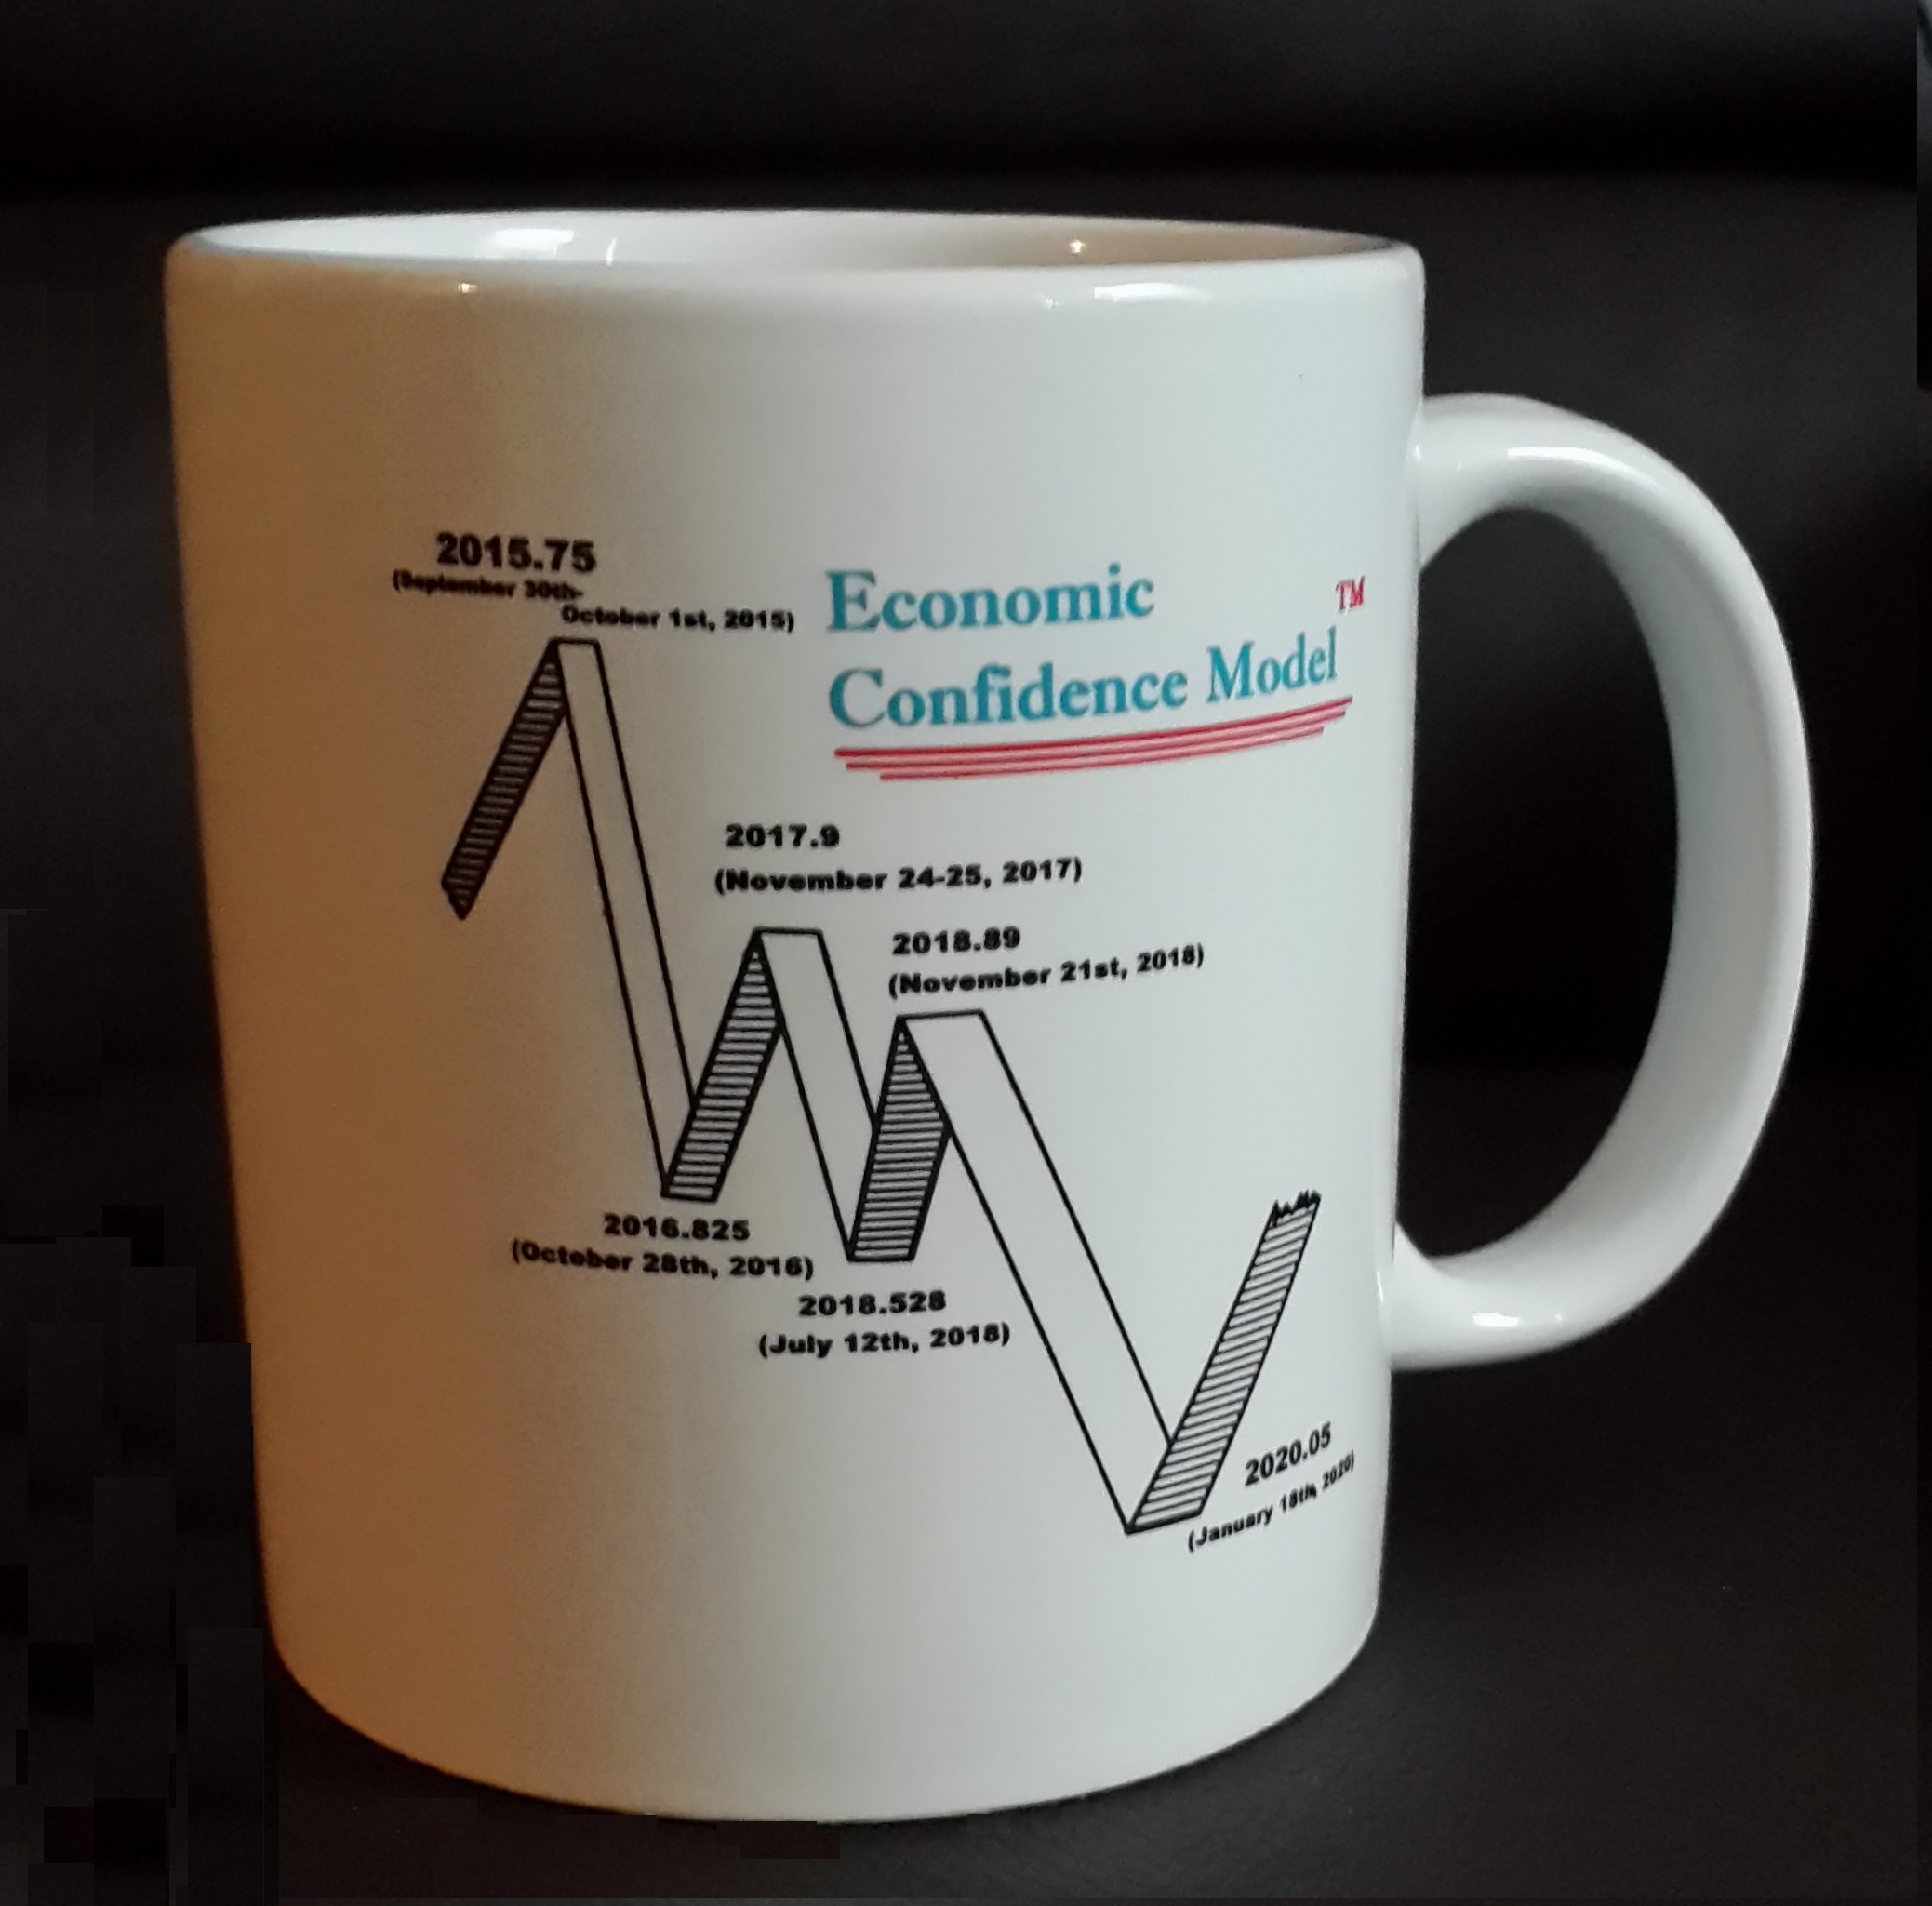
The various Hunger Stones record droughts that resulted in famine and soaring prices for food. The droughts that have been recorded on the stones date to 1417, 1616, 1707, 1746, 1790, 1800, 1811, 1830, 1842, 1868, 1892, and 1893, which covers a period of 476 years. This produces an average of 39.6 years. Just applying that average would bring you to 2012. However, we have to look closer. Note that two years 1892 and 1893 are back-to-back. This does not reflect two separate droughts, but the peak in intensity. Instead of there being TWO separate droughts, it is the same even just extended. That means there were really 11 events within this 476-year span of history and low and behold this alters the average to 43.27 years. This actually conforms to our Economic Confidence Model frequency of 8.6 years /2 = 4.3.
In fact, additional evidence that is being ignored by the Global Warming crowd who seem intent upon leading society to its doom by ignoring the past entirely. Extensive research has also been done on tree-rings in north-central Europe. This study has discovered that there has been a pattern of “megadroughts”in the 15th through 19th centuries. They classified 1893 as the “Great Drought of 1893” where rainfall decline between 30 to 90% throughout various regions in Europe. They also found that the Irish famine of 1740–1741 was the result of a cooling period they pointed out resulted in unusually low winter and spring temperatures in 1740 that produced in crop failures and a massive subsequent famine. They point out that there were five major “megadrought” that took place in 1540, 1590, 1616, 1718, and 1719. Once again, we see back-to-back events in 1718 and 1719 which in our analysis reflect a build up in intensity rather than two separate events. Reducing this to 4 evens once again gives us an average of 44.75 years which is very close to the Pi frequency. If we plot this serious out, we arrive at 2020.
It appears that instead of a back-to-back event in 2019, this cand become the worst period of intensity and produce three years of drought into 2020. The greater the number of volcanos erupting can also produce an increase in intensity for this period. What we must be concerned about is volcanic activity appearing in the West Indies, which includes Soufriere on St. Vincent. It is the stratovolcano type event that can change the weather. These are volcanoes that are known as a composite volcano, which is a conical volcano built up by many layers (strata) of hardened lava, tephra, pumice, and ash. When they erupt, this sends a tremendous amount of material into the atmosphere which reduces sunlight and cools the temperatures.
When we ran the drought data through our models, not only did it correlate with the ECM, it also coordinated with the first historical eruption of the volcano which took place during 1718 and a subsequent eruption 1812. Now, look at the drought records of megadroughts – 1718/1719. When we ran the model, out comes the year 1816 which s known as the Year Without a Summer. The climate turned extremely cold and it was snowing in July in New York City. This resulted in major food shortages across the Northern Hemisphere. Note that the second eruption was 1812.
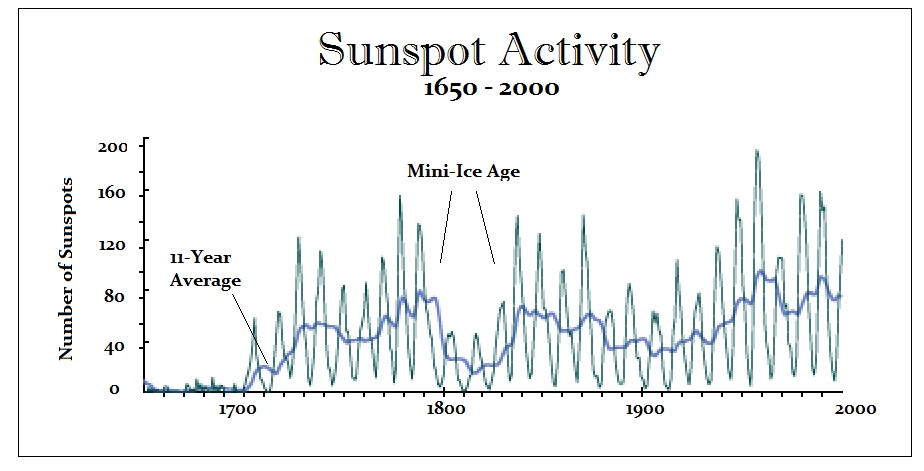
When we correlated this entire period, what emerged was a dramatic increase in volcanic activity which also correlated with the decline in the energy output of the sun. Our model warned that volcanic activity would rise beginning here in 2018 correlated with a decline in the energy output of the sun which should have begun in 2015. Note that the Hunger Stones also mark the year 1811. While this is one year prior to the eruption in the West Indies in 1812, there is what has been called the 1808/1809 Mystery Volcanic Eruption which seems to have set in motion a Mini Ice Age during the early 1800s. This was a monumental volcanic eruption in the VEI 6 range which appears to have taken place in late 1808. This event preceded the 1815 eruption of Mount Tambora (VEI 7) which produced the Year Without a Summer in 1816.
There was the period climatologists called the Little Ice Age they believed took place starting around 1650. This was the result of primarily the decline in the energy output of the sun reflected in the drastic decline in sunspot activity. What we are looking at here is a drastic correction in market-terminology which took place during the early 1800s. A study of Greenland and Antarctic ice cores in the 1990s revealed evidence that pointed to a massive volcanic eruption that had occurred in early 1809. The problem that everyone face was there were not human records of such an event. This meant that it must have been in a region where humans did not record the event. Additional research revealed from tree-ring data that there was also a major eruption in 1808. Now two independent sources were pointing to a mystery eruption – but where?
The mystery was simply that such a catastrophic eruption of that magnitude should have been noticed by someone. They began to scour the records around the world hoping that someone somewhere recorded the event. Finally, in 2014 a Ph.D. student Alvaro Guevara-Murua and Dr. Caroline Williams of the University of Bristol discovered an account of atmospheric events consistent with such an event by Colombian scientist Francisco José de Caldas who recorded a massive transparent cloud that obstructed the sunlight at Bogotá, Columbia in early 1809. The further investigation revealed that the cloud was first been observed by him on December 11th, 1808. De Caldas reported conditions consistent with a volcanic cloud that altered the weather turning it unusually cold, with even bitter frosts in Columbia.
Further investigations to the south in Peru produced another observation by a physician named Hipólito Unanue of Lima. Combining these two observations led to the conclusion that the window of the eruption was sometime within 14 days of December 4th, 1808. The only area in the tropics to the west of Colombia and Peru with possible volcanoes was also located in the South Western Pacific Ocean between Indonesia and Tonga. At the time, there was hardly any reporting coming from this region lacking European settlements. The Rabaul area has had such major VEI 6+ eruptions but records only date back to the mid-1800s.
However, this one catastrophic VEI6+ eruption is NOT the only volcano that erupted. This is why we have warned that the cyclical period for volcano eruptions turned upo with 2018. In 1808 there were major additional eruptions in Urzelina, the Azores during May (1st to 4th), as well as the Taal Volcano, in the Philippines during March that year. There was also the Chilean Putana volcano which had a major eruption during of 1808-1810 (records are not precise) This period is then followed by the truly massive 1815 eruption of Mount Tambora in the Dutch East Indies. This one is attributed with creating the Year without a Summer because it was the largest eruption in at least 1,300 years that has been recorded. This event was followed by the 1814 eruption of Mayon in the Philippines, which appears to have contributed to the weather changes of cooling creating an accumulative event.
Our models have pinpointed yet another such period that perhaps sent human civilization into the Dark Ages. There was a similar period with volcanos and extreme weather events of 535–536. Researchers from Los Alamos Laboratory published a thesis (LA-UR 004608) in this study these researchers developed a model recreating a volcanic eruption of such proportion that it staggers the human mind. This eruption is known as the Proto-Krakatau eruption. It occurred in the year 536 AD in the present day country of Indonesia. This predecessor or the 18 15 AD eruption of Krakatau of the same name and place was many times greater. The evidence these scientists present is that this resulting blast of this super volcano with its caldera (magma chamber) collapsing beneath it formed the Strait of Sunda between the islands of Sumatra and Java. Before this explosive eruption, these two islands were one land mass. The bathymetry data indicates this caldera is about 40 to 60 km in diameter. Michael the Syrian: “The Sun became dark and its darkness has lasted eighteen months. Each day it shone for about four hours, and still, this light was only a feeble shadow the fruits did not ripen, and the wine tasted like sour grapes.”
This appears to be the eruption of the volcano Krakatoa is located on Rakata, in the Pacific between Java and Sumatra, Indonesia. We know the name from the major eruption on August 26th, 1883 which was one of the most catastrophic ever witnessed in recorded in modern history. Previously, we knew of a more moderate eruption that took place back in 1680. Contemporary historians recorded events. Procopius wrote in 536AD: “during this year a most dread portent took place. For the sun gave forth its light without brightness … and it seemed exceedingly like the sun in eclipse, for the beams it shed were not clear.” John the Lydian, or John Lydus, was a 6th-century Byzantine administrator and a historian who wrote also in 536AD: “The sun became dim … for nearly the whole year … so that the fruits were killed at an unseasonable time.”
In Mesopotamia, a source quoted by Michael the Syrian (ca. 1166-1 199 AD) and Bar-Hebraeus 1246-1286 records that: “In the year 848 of the Greeks [536 A.D.]. the Sun was dark and its darkness lasted for eighteen months, each day it shone for about 4 hours, and still, this light was only a feeble shadow,. , the fruits did not ripen and wine tasted like sour grapes”
Flavius Magnus Aurelius Cassiodorus Senator (c. 485 – c. 585), was a Roman statesman and a historian. He wrote of this period: “The sun … seems to have lost its wonted light, and appears of a bluish color. We marvel to see no shadows of our bodies at noon, to feel the mighty vigor of the sun’s heat wasted into feebleness, and the phenomena which accompany an eclipse prolonged through almost a whole year. We have had … a summer without heat … the crops have been chilled by north winds … the rain is denied …”
The ice core samples clearly show actually two very large sulfate peaks that occur with volcanos. The first took place during 537AD and the second follows in 541—542AD. Therefore, once again we may be dealing with multiple volcanic eruptions. Both peaks are approximately the same size. It is the first event that has been recorded as the catastrophe. Contemporary historians mention above have provided contemporary accounts of this dramatic decrease in the Sun’s brightness during 536 and 537 AD. We have yet another contemporary account of a historian from Constantinople (Hamilton and Brooks, 1899, p. 267), believed to be Zacharius of Mytilene, who describes: ‘”In the year 14 [536 AD], the Sun began to be darkened by day and the Moon by night… from the 24th of March in this year until the 24th of June in the following year 15.” Because the dimming was less severe and shorter in duration, it is generally assumed that the atmosphere was filled with fine volcanic ash or dust from this event. (Rigby et al., 2004; Larsen et al., 2008), There is no question that SO2 emissions from volcanos produce a cooling trend in weather. However, it has also been shown that there is a time lag between 6 and 18 months that will vary depending upon how far up the ash is thrust into the atmosphere. Thus, there can be a delayed effect from when the eruption actually takes place.
Yet there is still another theory that strangely comes into play this October/November. The argument is that we pass through a particularly dense section of the Taurid Meteor path around every 2500 years and this has contributed to legends and climate change. Every year there are as South Taurid Meteor shower which will peak overnight on Oct. 9-10 for the Southern Hemisphere and then in the Northern Hemisphere, the North Taurid Meteor shower peaks Nov. 11-12. This has provided the foundation for love stories and wishing upon a shooting star. However, there have been intense Meteor storms that led to legends of dragons fighting in the sky breathing fireballs at each other. Chinese historical records from 540AD describe: “Dragons fought in the pond of the K’uho, They went westward … in the places they passed, all trees were broken.” Ice core sample also contain extraterrestrial dust from this period as well. It is argued that a larger meteor struck the Earth about this time and this is what is described as dragons fighting in the sky.
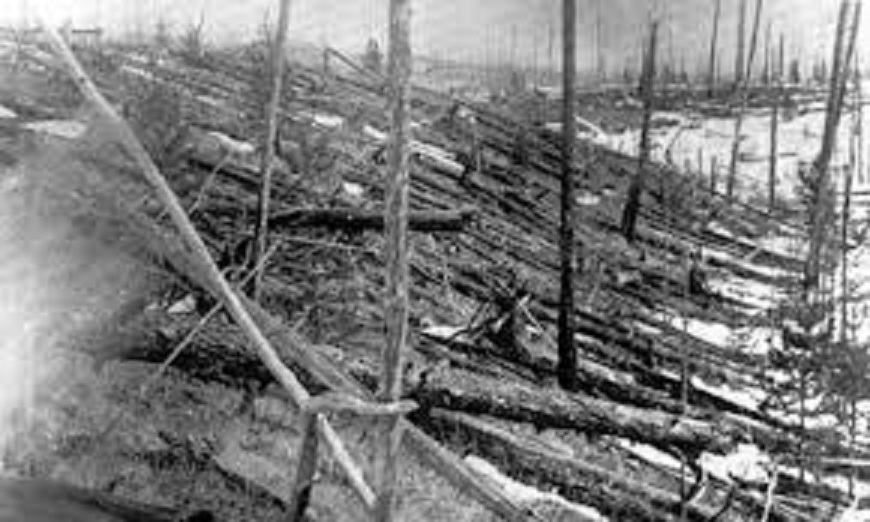
The one major know meteor even is that of Tunguska which was a large explosion that occurred in Russia, on the morning of June 30th, 1908. The explosion flattened 770 square miles (2,000 square kilometers) of the forest. The explosion is classified as an impact event, even though no impact crater has been found. The meteor is believed to have exploded above ground and thereby disintegrated at an altitude of 3 to 6 miles before it actually struck the ground. This is the largest impact event on Earth in recorded history, not geological history.
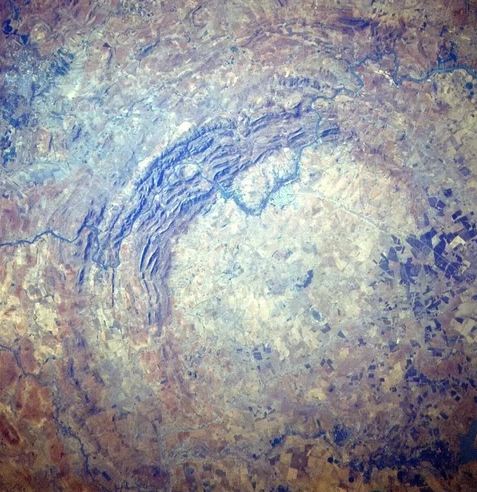
Meteorite impacts are by far perhaps among the most destructive forces in the solar system. It is believed that such events have resulted in mass extinctions. However, there are others who suggest that they may have also delivered the seeds of life soon after Earth was born. The oldest impact crater on Earth is also the largest and it is located in South Africa. It is known as the Vredefort Crater for it was originally 185 miles in diameter which struck some 2.02 billion years ago (pictured here). There is another major impact known as the Chicxulub crater located in the Yucatan peninsula of Mexico which is 93 miles in diameter that some argue may have wiped out the dinosaurs with a blast that was equal to the estimated energy of 10 billion Hiroshima A-bombs which took place about 66 million years ago.
Sodom and Gomorrah which are most likely located at the Dead Sea may have been destroyed by debris from a comet, startling new archaeological and astronomical research suggests. The Dead Sea is famous for is extreme salinity (34% salt, or almost 10 times as salty as the ocean), and for having the lowest elevation on Earth, at 1,407 feet (429 meters) below sea level. The argument remains that there was a simultaneous fall of the Old Kingdom of ancient Egypt, the Sumerian civilization in Mesopotamia and the Harrapin Civilisation of the Indus Valley. In total, some 40 cities are thought to have disappeared, in a series of catastrophes. Many astronomers believe that the Earth was bombarded by a particular dense storm of meteorites over a couple of centuries every 2,500 years. The last two occurrences were around 2200-2000BC and 400-600AD. Part of the evidence is that three Middle Eastern regions all contain a calcite material found only in meteorites. They argue that the Biblical account found in Genesis describes how “the Lord rained upon Sodom and upon Gomorrah brimstone and fire from the Lord out of Heaven” which is a description of a meteorite storm.
When all is said and done, we may be as insignificant as a pebble lying at the bottom of the ocean with no understand what lies above our heads.
People really think we have free trade and somehow Trump is reversing that fact. This, of course, is how the press has portrayed the issue, but that is just far from the truth. Trump is now looking at putting a 20%-25% tariff on cars coming from Europe. Personally, I only have German cars so I would not like to see that outcome. But personal wishes are not something I can explore for analysis. What I can say is that far too much is being fudged.
Countries are using DUTIES as the alternative to tariffs. It has gotten so impossible, we can no longer create the mugs we always give away at every conference in the USA when the conference is in Europe or Asia. Our last two conferences in Asia required us to manufacture the mugs in the country of the conference because we cannot get them into the country even when we hand them out for free. To government’s nothing is FREE and then you have to negotiate the “duty” to pay based upon what you would have paid for a cup manufactured in their country.
On that score, I have to agree with Trump. He has offered a free trade deal to the EU dropping all tariffs if they do the same. France rejected. There should be no tariffs and NO duties. Just for once let there be free trade. It has NEVER existed. Before the income tax, the US-funded itself with excise taxes. Excise taxes are taxes paid when purchases are made on a specific good, for example, gasoline. Excise taxes are often included in the price of the product. There are also excise taxes on activities, such as on wagering or on highway usage by trucks. One of the major components of the excise program is motor fuel today. Now we have consumption taxes in this manner AND income taxes. Government is now funded by just shaking us upside down and inventing countless taxes so they do not have to report the total cost of taxes.
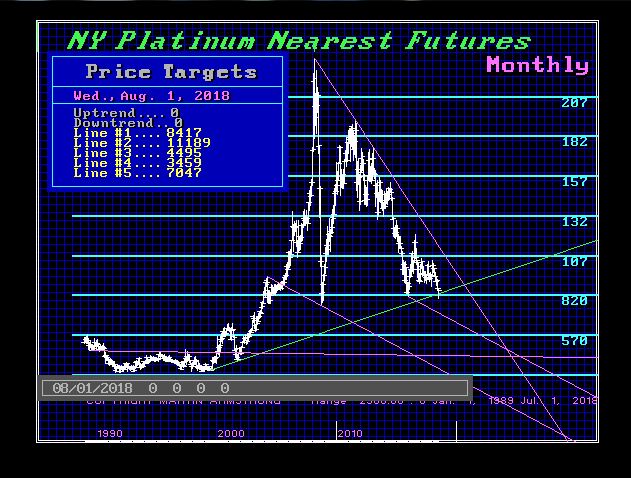
QUESTION: Marty, Socrates has done a fantastic job on platinum. It is just so refreshing to have an analysis that is not biased and always saying buy. It looks like platinum is just a precursor to gold. There is an oversupply and with South Africa in turmoil politically on top of its currency in the EM world, would you care to comment on this market?
Thanks for this system. It really makes a difference.
JS
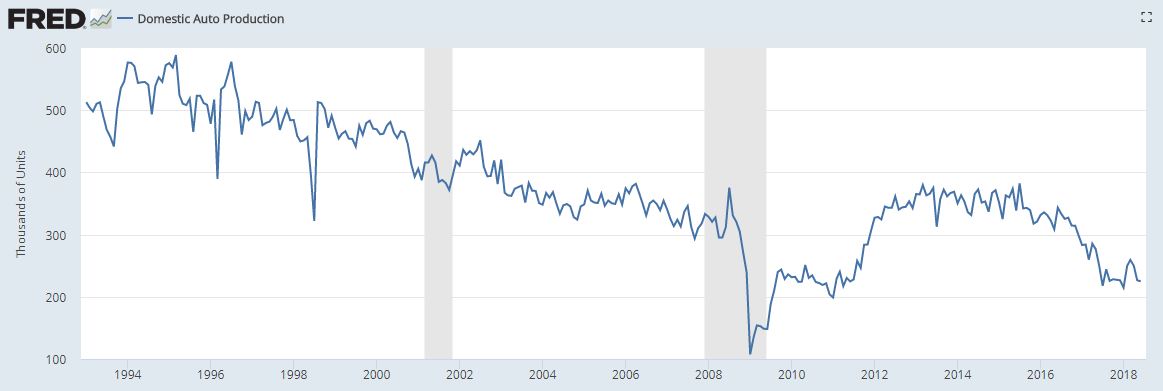
ANSWER: Platinum prices have really dropped hard reaching 10-year lows as the collapse of Turkey’s lira did in fact rippled through emerging market currencies which resulted in the decline of the currency of top producer South Africa. This has indeed underscored the persistent oversupply of the autocatalyst metal. Auto production has been declining for the most part since the 1990s. Moreover, the move toward electric cars in Europe has also resulted in a sharp decline in demand for platinum which has contributed to the oversupply.
Platinum has been caught in a broad sell-off that is clearly an oversupply crisis mixed with investors rushing to the safety of the dollar when there is a serious crisis brewing not just in emerging markets, but also within the EU. As I have warned, the dollar is the ONLY game in town to park BIG MONEY. Those who ran to turkey for the high yield are reaping the losses of their stupidity and greed. The political uncertainty surrounding Turkey has been pushing the dollar higher and making dollar-priced metals more expensive for buyers using other currencies. This is putting pressure to lower the price in dollars to be able to sell the metal.
Meanwhile, with the emissions-reducing catalytic converters for vehicles market is declining along with the jewelry market for platinum, which has also been declining due to deflation in Europe and a preference for gold. Despite the lower prices, global platinum jewelry demand declined 12% to 2.18 million ounces in 2017. According to GFMS industry reporting:
“According to the GFMS Platinum GroupMetals Survey 2017, platinum was the worst performing precious metal in 2016, with its price stumbling 6 percent to average $988.76, falling below $1,000 for the first time since 2005. … Despite the lower price, global platinum jewelry demand declined 12 percent to 2.18 million ounces. The fall is largely attributed to declines in demand in North America and China, which saw 10 percent and 12 percent falls, respectively. In China, platinum’s decline is believed to be the result of weaker economic conditions as well as the metal losing market share to 18k yellow gold. For North American consumers, it was a matter of jewelry price stickers not reflecting platinum’s lower cost to gold. Because platinum is a denser metal, a platinum piece can be 40 percent heavier than its gold counterpart, and thus more expensive for consumers
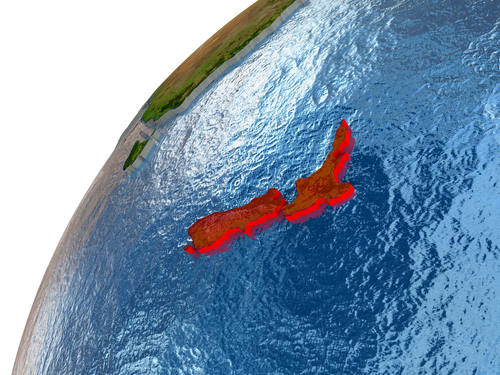
COMMENT: Mr. Armstrong; Your recommendation at the WEC two years ago that the south island in New Zealand would be a safe place has really led to a lot of chaos. So many billionaires have suddenly been buying up property down here it is obvious you have a lot of influence. It has even made the Guardian. Please don’t send any more people down here.
HU
REPLY: I never sent anyone directly to New Zealand. I know we are well read among the money class as they say. Everyone eventually makes their own decision. Nevertheless, your Prime Minister is out to stop foreign investors buying property down there these days.
I was just reading today’s Blog 17-08-2018 – ‘ Real Estate – Leverage – Transition to the Reset ‘. The bit I did not understand was where it was written ‘ Keep in mind that as the currency declines, then the repayment cost of a mortgage declines. One the one hand, mortgages will be unavailable but those who hold the mortgage lose the most ‘
My question is when the Reset happens in which way will the mortgage holders lose the most even if the repayment cost of a mortgage declines ? I live in the UK
thank you so much
ANSWER: Since I posted that chart from Socrates that illustrates real estate, many people have written in to ask where can they find that on Socrates. This is part of the pro version that will be released WE HOPE for the WEC this year (see Socrates Newsletter just sent out). Here are the real estate markets covered by Socrates at this time.
What I mean when I say that those who hold mortgages lose in such a situation of a decline in the purchasing power of a currency is basic. The city of Detroit suspended its payments on bonds in 1937. They resumed in 1963. Now they say they never defaulted. However, they paid back with cheaper dollars. The holder of a mortgage or a bond charges interest which is supposed to be more than the inflation rate. When inflation exceeds the interest rate, then you are paying back with cheaper dollars.
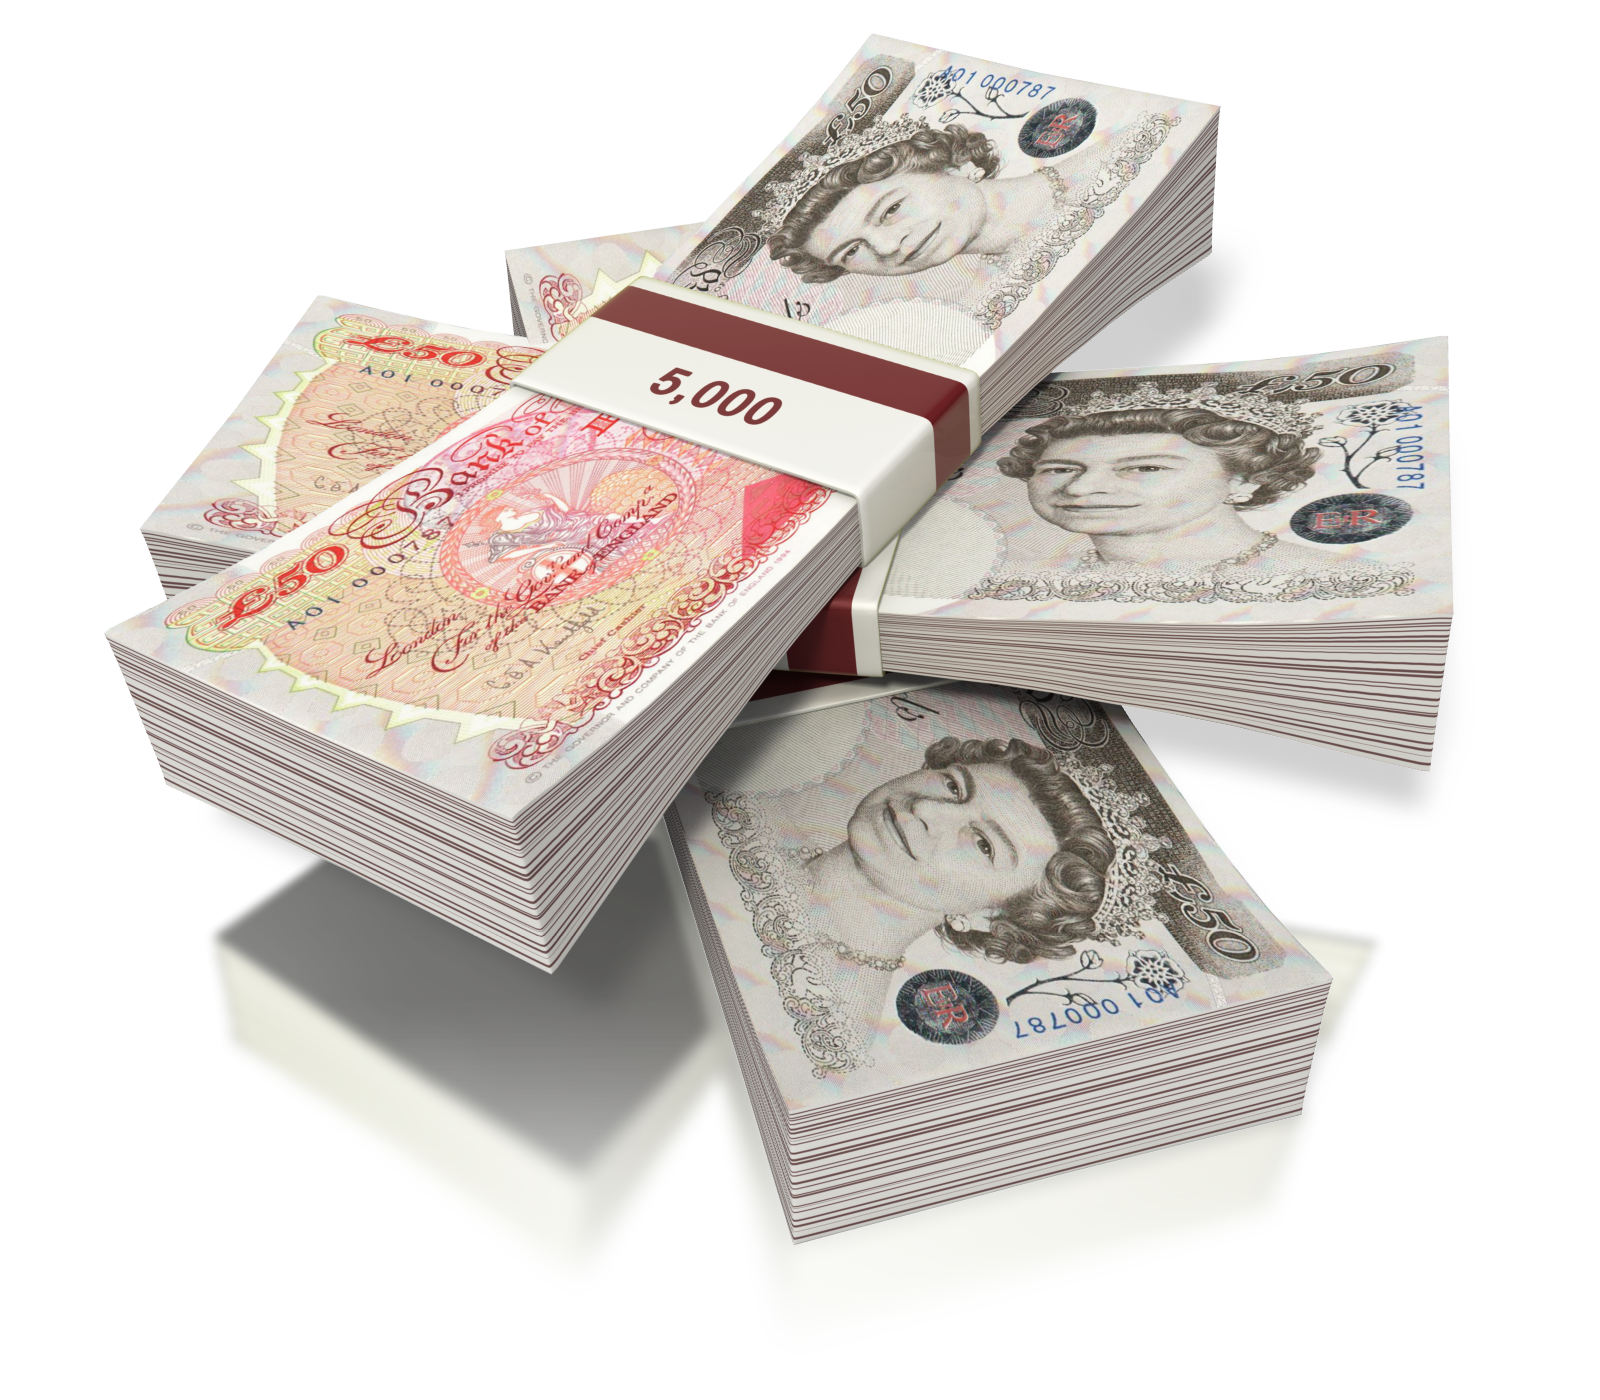
Take a life-insurance policy. If you bought one in the 1940s and it was for the huge amount of $5,000, after funeral costs of say $1,500, you left your heirs a sizable chunk of money. Today, that is nothing and will cover at best 20% of the cost of a funeral. Life-insurance is always paying back with a cheaper dollar. This is the problem in Europe. Greece, Italy, and Spain were accustomed to paying their past debts with a cheaper currency. When they converted their debts to the Euro and the Euro doubled in value, suddenly they went into deflation and cannot pay their debts and survive.
The borrower always benefits over the long-run because they are traditionally paying back with cheaper currency. If you took out a mortgage in 2007 when the pound hit 2.11 and you paid it off in 2016 when the pound was 1.18, you saved 44% in real terms of currency. This is what was behind the real estate boom that government and the vast majority of people do not understand. One of the reasons I have been blamed for creating the take over boom back in the 1980s was that I had shown some of the takeover playing how to use currency. In the case of Alan Bond who bought all the Courage Pubs back then, we were borrowing in a currency that was declining against the pound. I showed him and others how to take debt and convert it into a performing asset. They were the fun times
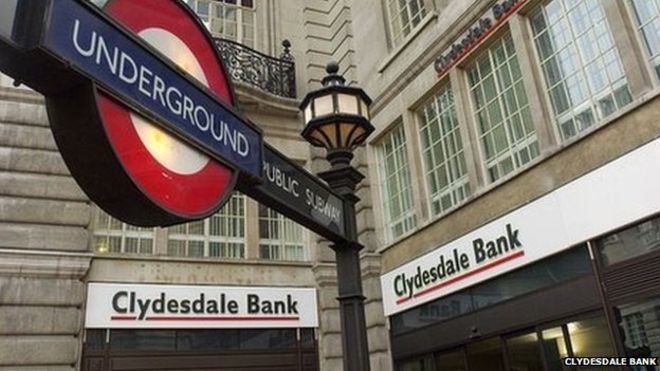
The story running around on Bitcoin.com news tells the tale of an individual who legally sold large amounts of cryptocurrency at a profit found that Clydesdale Bank decided to freeze all assets involving people who had been involved in cryptocurrencies. The man had no criminal convictions and had always complied with British laws on financial regulations and taxation. Nevertheless, he told Bitcoin.com: “My bank account has been blocked by Clydesdale Bank without any warning or explanation and my money frozen.” The bank manager said that the bank no longer wanted to do business with “that kind of people” who were involved in cryptocurrencies.
This is the problem that is emerging as part of the Hunt for Taxes. It is “assumed” that the majority of people who made money in cryptocurrencies never reported their gains. Whether that is true or not is really not the subject here. It is a “presumption” of guilt that is taking place. The very same thing took place with American outside the USA because of the law FATCA. It is not illegal for an American to have an account outside the USA. It is “presumed” he is not reporting his overseas income. Under FATCA, a foreign institution MUST report to the USA anything an American is doing overseas or THEIR assets will be confiscated in the USA. The risk that an American is not paying their taxes on an account at a bank in Europe then would subject that bank’s assets in the USA to be confiscated. The easy solution was to refuse to accept accounts of Americans – plain & simple. Hence – no risk.
Many banks are looking at the cryptocurrency world with the same tinted glasses. They fear getting caught up in a client who made a lot of money from cryptocurrencies and they get caught in the crosshair of tax agents who then say they should have known! Welcome to the PRESUMPTION OF GUILT when it comes to taxes. It is your burden to even prove your money is really yours AFTER taxes
The collapse of the Morandi Bridge in Italy has prompted a serious dispute between Brussels and Italy. Italy is taking the position that the demand of Brussels to comply with austerity denies Italy the ability to even repair its infrastructure for its own people. When it asked previously for relief to deduct the cost of all the refugees, Brussels denied that exception. My sources in Italy are hardening on their view that Italy is now an occupied country.
The Eurozone austerity policy has destroyed the European economy because they have utterly FAILED to understand what was the real cause of the German Hyperinflation. This view that any increase in the money supply is evil has subjected Europe to DEFLATION that has devasted its economy, infrastructure, and resulted in massive unemployment among the youth. The Great Depression was not reversed until they stopped Austerity which only benefits the bondholders – not the people. To sell their debt, they presume they need austerity so bondholders get back the fair value of what they lent. That has never happened anyway.
Many people worry about over-indebtedness and point to a default of borrowers. It is interesting how the view of debt is always the low-life borrower. In reality, the real stupidity rests with the lender. Many are pointing to US corporate debt and stating that it has grown to an estimated US $ 7 trillion and they paint this as high-risk bonds and corporate loans which have been issued over the past decade. Of course, there were some who were foolish to issue variable interest rate bonds. Those companies are likely to find themselves in trouble. But there are others who issued long-term fixed bonds at low rates. Our advise to corporate clients was to borrow as much as possible at fixed rates for 50 to 100 years while the fools were willing to buy. Other major corps issued 100-year bonds including Walt Disney Company (DIS) and Coca-Cola (KO). The loser will be the BUYER, not the ISSUER. It was a fool’s market to buy such fixed rate bonds for 100 years.
When Greece got in trouble, what is the first solution economists ALWAYS recommend? A debt haircut!. , which in most cases is based on the Libor benchmark interest rate, which has increased significantly in recent months. The first thing they did was extend the Greek debt by 10 years to avoid a default and the ECB agreed that any profits made by central banks in the Eurozone on Greek bonds would be returned to Athens in two equal tranches every year, between 2018 and 2022. You always extend maturity to avoid a default and you take a haircut in the value of the bonds you bought.
We are also witnessing this at the municipal level in Germany where about 50% of municipal governments are effectively bankrupt. The President of the German Institute for Economic Research (DIW), Marcel Fratzscher, came out and called for fundamental reforms where the holders of their debt would take a haircut. He has made it clear that a reduction in more than half of the state investments was made by the municipalities. The German grand coalition was supposed to organize a haircut to reduce the value of outstanding debt from the federal states on down to the municipalities. In reality, they are hopelessly over-indebted not unlike Illinois and California in the USA.
Even when we look at the war loans from the USA to Europe, it was not until 2015 that Britain finally repaid it war loans. There were still 38,000 holders of UK war bonds with amounts less than £100 as well. They actually cut the 5% coupon in 1932 reducing it by agreement to 3.5%. So you see, taking 100 years to repay a debt meant that the value of the pound when the money was lent was $4.86 and when it was paid off less than $2. Actually, the French never even paid interest on the $4 billion they owed the USA after World War I and the only country to pay the United States back during the 1930s was Finland.
So when we look at the indebtedness of even Emerging Markets, keep in mind that the loser will be the lender – not the borrower. It seems that no matter how many times a government defaults like Spain, seven times, the fools rush right back in and buy again. The famous bank of the Medici had a rule “to deal as little as possible with the court of the Duke of Burgundy and of other princes and lords, especially in granting credit and accommodating them with money, because it involves more risk than profit” (Raymond de Roover Professor of History at Brooklyn College: The Rise and Decline of the Medici Bank was first published in 1966. id/ p 343). The Medici failed because later generations did not follow that rule
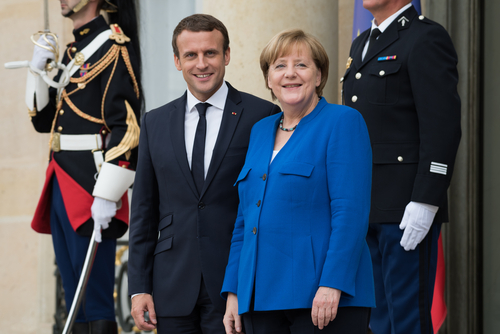
Chancellor Angela Merkel has rejected France’s Macron’s proposal for the establishment of a euro finance minister. Merkel has also stated that she wants a planned EU budget for the Eurozone area as part of the EU budget. She does not want an independent budget for the 19 countries of the monetary union. Merkel is still adhering to her view that the quantity of money causes inflation and it has been that policy which has suppressed the European economy for the last decade. A Euro finance minister she argues would lack both a budget as well as there would be no parliamentary control.
I have created this site to help people have fun in the kitchen. I write about enjoying life both in and out of my kitchen. Life is short! Make the most of it and enjoy!
This is a library of News Events not reported by the Main Stream Media documenting & connecting the dots on How the Obama Marxist Liberal agenda is destroying America

 ANSWER: You are hitting the nail right on the head. The decline in the dollar throughout the 1970s made German cars appear to appreciate and this was attributed to quality. This was the entire reason why the German car industry exploded. I have often stated at WEC conferences that I made the same play with a Ferarri in London. When the British pound dropped to $1.03 in 1985, I ran out and used the currency to make some deals. I bought a 328 Ferarri for about $30,000 when in the US it was a $50,000 car. Because the pound had dropped, Ferarri could not afford to sell them in Britain at that price so they raised it £45,000.