June Inflation Jumps 1.3 Percent, Annual Inflation Rate Increases to 9.1 Percent


Posted originally on the conservative tree house on July 13, 2022 | Sundance

The Bureau of Labor Statistics (BLS) has released the June Consumer Price Index (CPI) [DATA HERE] showing yet another “surprising” increase in overall inflation.  For the month of June overall inflation increased 1.3% bringing the annual rate of inflation to 9.1% as calculated.

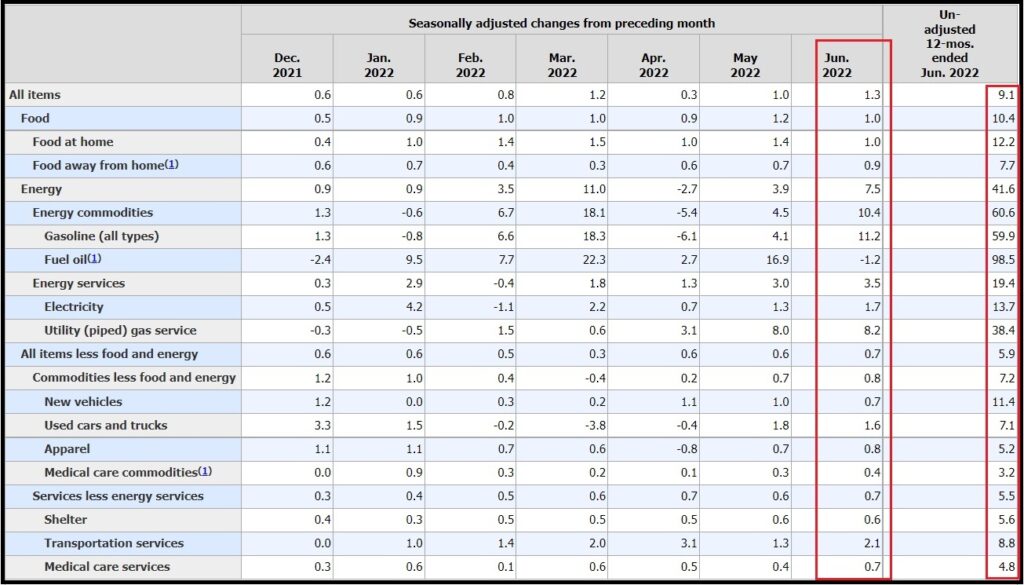
Economists and financial pundits are “shocked”, “surprised” and the proverbial “unexpected” is running amok again amid the typeset.  The reality of Joe Biden energy policy being the origin of our current inflation crisis is being avoided at all costs by the pretenders.  The federal reserve raising interest rates can only impact the demand side, but it’s the supply side (total energy policy) creating the problem.  Table-A shows the overview.

(CNBC) – […] The consumer price index, a broad measure of everyday goods and services related to the cost of living, soared 9.1% from a year ago, above the 8.8% Dow Jones estimate. That marked the fastest pace for inflation going back to November 1981.

[…] “U.S. inflation is above 9%, but it is the breadth of the price pressures that is really concerning for the Federal Reserve.” said James Knightley, ING’s chief international economist. “With supply conditions showing little sign of improvement the onus is the on the Fed to hit the brakes via higher rates to allow demand to better match supply conditions. The recession threat is rising.” (read more)

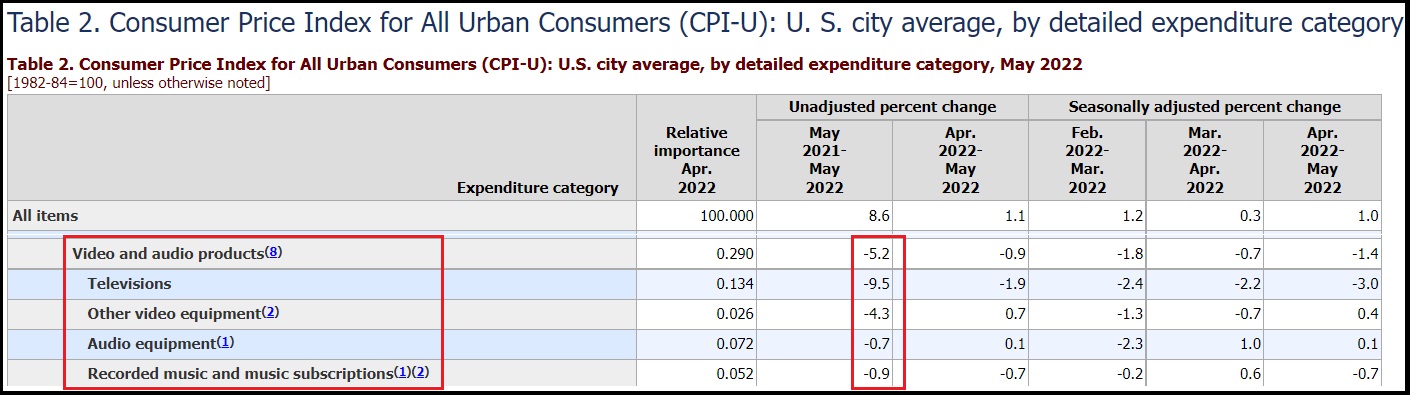
If you dig into the details, the inflation picture shows just how deep the energy policy is hitting.  Everything is impacted by Joe Biden’s radical energy policy.  Table-1 breaks down the data a bit more specifically.  However, even this data is skewed by the BLS putting a weighting factor on the importance.

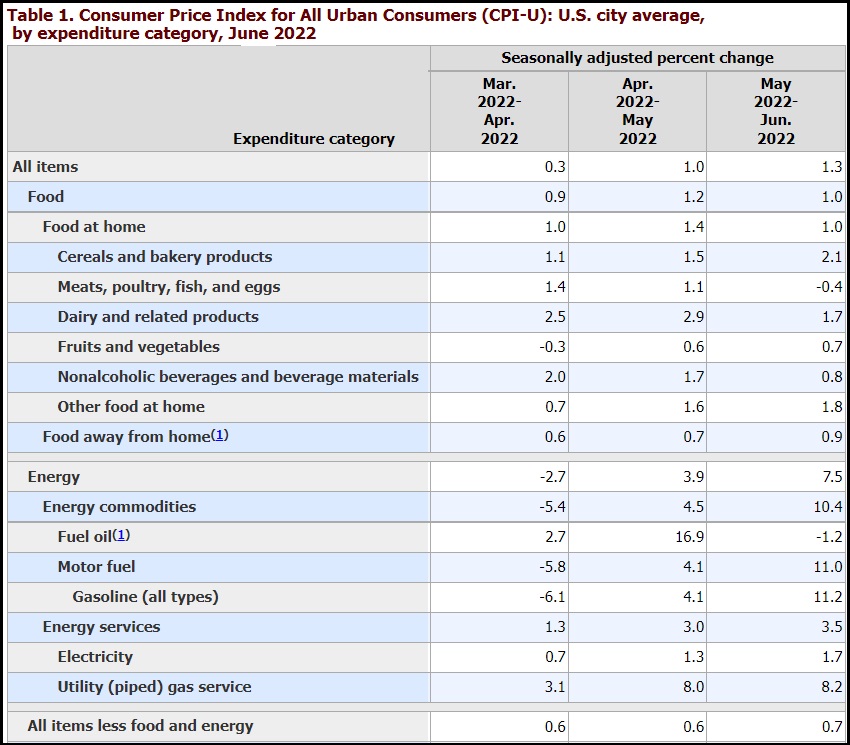
♦ The rate of annualized inflation for natural gas is now running at almost 100%.  Meaning if things continue, the current price will double again by this time next year.

♦ The rate of annualized inflation for gasoline is running at 134%.

♦ The annualized rate of energy inflation overall is running at 90%.

These are the results of the people behind Joe Biden implementing the Green New Deal program by executive fiat.

Also, keep in mind the current increases in farming costs at the field have yet to reach wholesale and retail.  The fertilizer, oil, diesel, packaging, transportation and energy costs at the field will not arrive to the fork until later this fall.  That is when food inflation will surpass energy inflation.

Current cattlemen and ranchers are finding it more cost-effective, due to drought and high feed costs, to take their cattle to slaughter.  There is a temporary drop in beef prices for the next several weeks before the supply roller coaster sets up a scenario for massive increases in beef costs this winter.  Consider buying and freezing now for use later this year and into the winter. Try to buy directly from cattle ranchers.

Later this year the next wave (#3) of food inflation will surpass the last two waves.  Things will get ugly because there are also predictably shortages of food coming.  Higher farm costs and global food supply shortages equals much, much higher U.S. prices.   Prepare.

U.S. Homebuyer Contract Cancellations Surge to 15 Percent in June, Highest Ever Recorded Sans Pandemic


Posted originally on the conservative tree house on July 12, 2022 | Sundance

A slowdown in the housing market is being identified as the primary cause of a significant increase in cancelled homebuyer contracts in the month of June.  Bloomberg Report Here and Redfin Report Here.  It would appear the inflated housing bubble has popped.

According to the data 60,000 home sales were cancelled while under contract in June, that represents 14.9% of all contracts cancelled by the buyer before the transaction closed.  If you take out the forced cancellations due to the pandemic, a 15% cancellation rate equals the highest monthly cancellation rate ever recorded.

The economy is contracting, economic activity and consumer purchases have stopped, and the contraction is now fast and sudden.

(Redfin) – Nationwide, roughly 60,000 home-purchase agreements fell through in June, equal to 14.9% of homes that went under contract that month. That’s the highest percentage on record with the exception of March and April 2020, when the housing market all but ground to a halt due to the onset of the coronavirus pandemic. It compares with 12.7% a month earlier and 11.2% a year earlier.

This is according to a Redfin analysis of MLS data going back through 2017. Please note that homes that fell out of contract during a given month didn’t necessarily go under contract the same month. For example, a home that fell out of contract in June could have gone under contract in May.

“The slowdown in housing-market competition is giving homebuyers room to negotiate, which is one reason more of them are backing out of deals,” said Redfin Deputy Chief Economist Taylor Marr. “Buyers are increasingly keeping rather than waiving inspection and appraisal contingencies. That gives them the flexibility to call the deal off if issues arise during the homebuying process.”

Marr continued: “Rising mortgage rates are also forcing some buyers to cancel home purchases. If rates were at 5% when you made an offer, but reached 5.8% by the time the deal was set to close, you may no longer be able to afford that home or you may no longer qualify for a loan.” (read more)

Now, keep in mind that contract cancellations can also be attributed to a hot housing market, where purchasing hysteria and bidding wars end up being factors in the contracts.  Some anxious buyers make out-of-town offers without even seeing the house, then use contract exits -contingencies- to cancel the purchase if the home is ultimately not up to their standard.

In my opinion the spike in cancellations is a blend of the two aspects which indicate the apex of home purchasing is behind us.  The bubble popped.

Home values are now declining as more available inventory starts to fill up the real estate market.  Again, everything is local and regional depending on a myriad of issues; however, if we are looking at it from a macro level, the booming housing market is now over.

City and county tax rates will now benefit from the overinflated real estate sales data.  Real estate tax bills (a backward-looking metric) will go up as the curve on home valuation actually starts to drop and drop quickly.

If you did not purchase a home this year, you have not lost money.  If you did purchase a home this year, the dropping market will erase tangible wealth.

Redfin also has the top metro-markets for cancellations:

(Source, with Expanded List)

CBS says the best way to survive the Biden economy is not to buy stuff, and young adults should stay living with mom and dad. WATCH:

P

I Feel Like I’m On A Debt Treadmill And It’s Never Ending!


The Ramsey Show – Highlights  Published originally on Rumble on  July 8, 2022

I Feel Like I’m On A Debt Treadmill And It’s Never Ending!
Subscribe and never miss a new highlight from The Ramsey Show: https://www.youtube.com/c/TheRamseyShow?sub_confirmation=1

Russian Oil Revenue Returns to Pre Sanction Levels in May


Posted originally on the conservative tree house on June 16, 2022 | Sundance 

Western sanctions against Russia have been used primarily to obfuscate the cause of western inflation and keep the citizen pitchforks from reaching various government offices.  So far, the strategy -assisted by western media- has been mostly successful.

However, the International Energy Agency (IEA) is reporting that despite the western sanctions against Russia, the Russian energy sector is having no trouble finding customers for its oil sales.  With global oil prices at their highest rates in years, in part driven by the energy policy of the same western leaders who triggered the sanctions, Russia is getting just as much economic benefit as it was before the sanctions regime was triggered.

(EU FINANCE) – Russia continued to rake in oil revenues in May despite a global boycott from companies and most countries following its invasion of Ukraine, a new report has shown.

The International Energy Agency (IEA) said the Kremlin’s oil-export revenues surged to around $20bn last month, an 11% increase from the month before, despite shipping lower volumes.

Its latest monthly report, published on Wednesday, said this takes Moscow’s total revenue for shipping oil and crude products roughly back to levels before the invasion of Ukraine. Russian exports fell by about 3% due to lower oil-product flows, the Paris-based agency estimates.

Meanwhile, crude shipped during the month grew by nearly 500,000 barrels a day compared to the start of the year, largely thanks to higher deliveries in Asia.

“China and India, which have both sharply increased crude oil purchases from Russia, are net product exporters and have no need to lift Russian products,” it said. (read more)

There it is, Samsung Signal Flare, Demand Side Contraction, Inventories Too High, Request Suppliers Stall Shipments


Posted originally on the conservative tree house June 16, 2022 | Sundance 

We have been waiting for the non-essential durable goods side of the manufacturing sector to start showing evidence of demand side contraction in consumer purchases.  There have been subtle sector-by-sector indicators of consumer spending shifts for several months; however, today we get the direct evidence from Samsung.

Samsung is one of the leading manufacturers of consumer electronics and products that require chips.  For three months the electronics sector has shown background signals that inventory was not moving.  One of the more recent indicators of a demand side contraction was the lack of upward price pressure inside the electronics sector.  Essentially, consumers are not purchasing the current inventory, so prices are actually dropping in this segment.  [SEE TABLE 2, CPI Chart]:

Despite overall inflation of 8.6% within the CPI, deep inside the category indexes you will note that electronic prices are actually dropping.  Televisions -9.5%, Video equipment -4.3%, etc.  Video and audio products overall dropped in price 1.4% for May, and dropped 5.2% year-over-year.

The supply chain in this sector is lengthy. Meaning inventory builds slowly as consumers stop purchasing in the USA.  Retail store inventory turns slow, store inventory climbs, then warehouses inventories climb as stores do not need product. The negative boxcar effect travels back to the manufacturer overseas over the course of several purchase cycles.  Eventually, everyone within the sector is telling the supplier we do not need product.  Then the manufacturer has to quickly slowdown raw material.

Due to lengthy supply chains, including trans-pacific shipments, the process to stop deliveries in this electronic goods sector is around 90-days before the drop in retail sales reaches the manufacturer to stop production.  Here is the announcement from Samsung:

TAIPEI/ SEOUL — Samsung Electronics is temporarily halting new procurement orders and asking multiple suppliers to delay or reduce shipments of components and parts for several weeks due to swelling inventories and global inflation concerns, sources have told Nikkei Asia.

The notification by the South Korean tech titan applies to components for multiple key product lines, including TVs, home appliances and smartphones, four people familiar with the situation said, and the postponement of orders involves a wide range of components across chips, electronics parts and final product packages.

The move by Samsung, the world’s No. 1 smartphone and TV maker and one of the leading home appliance providers, is the latest sign that electronics makers are pessimistic about the economic outlook amid global inflation risks.

Samsung told suppliers that the company needs to closely review its inventory levels of both components and final products to ensure stock on hand is manageable, according to the sources. Two people said the move will last until the end of July. One of the people said shipments from that source’s company have not been completely halted but the volume of the company’s planned shipment to Samsung for July has been slashed by 50%.

Samsung’s inventory assets reached 47.6 trillion won ($36.9 billion) at the end of March, up from 41.4 trillion won in December, according to its first quarter earnings report. The ratio of inventory assets to total assets also jumped to 10.8% from 9.7% during the same period. (read more)

Various Wall Street economists and MSM pundits have stated, erroneously – and many intentionally, there has been no evidence of a demand side contraction.  However, CTH reviews of the data have shown exactly the opposite.  There are multiple indicators of demand side contraction, including drops in retail sales units that goes all the way back to last holiday season.

Yesterday the U.S. Dept of Commerce released the May retail sales [pdf DATA HERE], showing a 0.3% drop in retail sales for the month.

Retail sales -as measured in units purchased- have been in a contracting position since June of 2021.  When the current data shows a drop of -0.3% in May, the actual drop in retail sales is much, much greater.  The dept of commerce calculates retail sales in dollars.  When prices are 20% higher and sales are low, retailers are selling less stuff (fewer units) at higher prices.  This has been the reality of our economy for several months.  This is also why productivity has been declining for more than a year.

If you take the 8.6% inflation rate (far understated) and an aggregate drop in sales of 0.3% (again, far understated as a measure of inflation), that means consumers are spending limited incomes on critical or essential purchases like housing, food, fuel and energy.  Consumers are not purchasing durable goods; people are hunkering down.

Yearly retail sales (May ’21 compared to May ’22) are +8.1%.  However, yearly retail inflation for the same period is +8.6%.  Again, reflecting that less stuff is being purchased inside the economy at higher prices.  If the commerce dept was measuring actual units being purchased, we would be seeing massive drops in sales.

Samsung is reacting to a demand side contraction.

Production Prices Continue Exceeding Current Consumer Prices, Meaning Higher Prices Still Coming


Posted originally on the conservative tree house on June 14, 2022 | Sundance 

The “Producer Price Index” (PPI) is essentially the tracking of wholesale prices at three stages: Origination (commodity), Intermediate (processing), and then Final (to wholesale). Today, the Bureau of Labor and Statistics (BLS) released the May 2022 price data [Available Here] showing another 10.8% increase year-over-year in Final Demand products at the wholesale level.

The inflation within the total goods supply chain continues to accumulate at a more significant rate than the finished goods on the store shelves.  This means replacement goods will continue arriving with higher prices than current.   Final demand goods in May were 1.4% higher than April (16.8% annualized).  And the May year-over-year prices show a 10.8% increase [See Table A].  However, there’s more trouble ahead:

More troubling than the final demand price increases (wholesale finished goods), are the price increases in the intermediate goods and unprocessed raw materials.

Intermediate processed goods increased 2.3% in May (27.6% annualized).  The intermediate unprocessed goods, raw materials, jumped even higher in price at 6.3% for May (that’s a whopping 75.6% annualized increase).   It would appear the raw materials coming into the goods sector are coming in with even higher built-in energy costs than most people anticipated.

Once those intermediate products reach the final demand stage (wholesale), the cumulative price increase will mean even higher consumer prices.

(VIA ABC) – WASHINGTON — U.S. producer prices surged 10.8% in May from a year earlier, underscoring the ongoing threat to the economy from inflation that shows no sign of slowing.

Tuesday’s report from the Labor Department showed that the producer price index — which measures inflation before it reaches consumers — rose at slightly slower pace last month than in April, when it jumped 10.9% from a year earlier, and is down from an 11.5% yearly gain in March.

On a monthly basis, producer prices climbed 0.8% in May from April, above the previous month, when they increased 0.4%.

Energy prices, led by gas, rose 5% just in May from April. Another big driver of the price gains last month was a sharp 2.9% increase in the cost of truck freight hauling, a sign that supply chain problems still aren’t fully resolved. Food costs were unchanged.

The figures indicate that rising prices will continue to erode Americans’ paychecks and wreak havoc on household budgets in the coming months. Inflation has created major political headaches for President Joe Biden and congressional Democrats and has forced the Federal Reserve into a series of rapid interest rate hikes intended to slow the economy and cool price increases. (read more)

Another Strike Against Cryptos


Armstrong Economics Blog/Corruption Re- Posted Jun 14, 2022 by Martin Armstrong

I’ve said it before and will say it again – cryptocurrencies are not a safe investment. I know it is not a popular opinion; people have had success with trading. The problems with cryptocurrencies: (1) they depend entirely upon the government; with the stroke of a pen, they can all be seized; (2) they depend upon a power grid; (3) they also become dependent upon others accepting them.

A fourth all too common issue is that crypto trading platforms can prevent people from trading with little or no explanation. Binance recently announced that users are not permitted at this time “due to a stuck transaction causing a backlog.” CEO Changpeng Zhao stated on Twitter that the issue would be fixed in under 30 minutes. Later in the day, he said the issue would “take a bit longer to fix than my initial estimate,” but would only impact the Bitcoin network. Uncoincidentally, this sudden system glitch occurred after bitcoin fell by 10% beneath the $24,000 level.

This happens more than they would like people to believe. A few years back, a friend of mine was blocked out of their Bittrex account as soon as one of their cryptos began crashing. At one point, Bittrex suspended and eliminated numerous accounts in 2017, and it took them days to respond. They claimed the issue was a “compliance review,” as these platforms can seemingly make up any excuse they please. During that instance, they did not even inform users before they were locked out of their accounts. Unpopular opinion but the fact of the matter is that cryptos are seriously flawed.

Credit Card Debt on the Rise


Armstrong Economics Blog/USA Current Events Re-Posted Jun 14, 2022 by Martin Armstrong

The various handouts and moratoriums during the pandemic drove the personal savings rate down to World War II levels. Everything was closed – there weren’t many opportunities to spend. US consumers paid off a record $83 billion in credit card debt during the pandemic, but that has all come crashing down.

The Federal Reserve reported that revolving credit card debt in April reached $1.103 trillion, surpassing pre-pandemic levels and spiking 20% from the year prior. Credit card balances reached an alarming $841 billion in the first three months of this year alone, and the Fed expects that figure to continue rising due to the unsustainable price of living. In addition, household debt is now close to $16 trillion after consumer debt spiked 1.7% in Q1.

Unfortunately for those already behind, the rising interest rates will only cause them to carry a higher balance of debt. Once the prime rate rises, credit card companies will follow. The APR on credit cards is already 16.61%, nearing the high of 17.87%, on average, but is expected to rise. Debt can easily become a vicious cycle from which there is little escape for the average person. Those who budgeted in the belief that Biden would actually cancel their student debt were misled if not gullible. As housing, food, gas, and other necessities rise, those who are already void of liquid assets will find themselves in a dire situation.

The Dollar Crisis is Far Greater than Anyone Imagines


Armstrong Economics Blog/USD $ Re-Posted Jun 14, 2022 by Martin Armstrong

QUESTION: Marty, Socrates is worth its weight in something far more valuable than gold. I want to congratulate you for you are the ONLY adviser who nailed not just the cryptocurrency bloodbath, but that the dollar would rise when everyone else kept predicting it would crumble to dust. Then you warned that emerging markets would move into crisis defaulting on their debt. You said even China was in the same crisis because many borrowed in dollars since the interest rates were cheaper.

Is the dollar behind the banking crisis in China and with all the AI systems claiming a new world order, why are they failing when Socrates succeeds?

I am so grateful. I cannot tell you how much.

BME

ANSWER: I will answer the AI issue tomorrow. The dollar crisis is emerging because people do not understand capital flow analysis. They keep harping on the quantity theory of money. They assert that the more money the Fed creates, the more the dollar bust decline, and typically gold must rise. They do not understand that capital flows like water. It will always move to the lowest risk.

Milton Friedman came to listen to my lecture on foreign exchange in Chicago. We became friends and he explained to me that I was doing what he had only dreamed about. Yes, it was Milton who had advised Nixon on shutting down Bretton Woods and adopting a floating exchange rate system.

While many criticize Milton, they did not really understand what he saw. In 1953, he saw that a floating exchange rates system would provide a natural check and balance against the government policies. That is why he came to listen to me. I had developed capital flow analysis which was what he envisioned would happen under a floating exchange rates system. He theorized that in 1953.

I have been called in on so many FX crises it is amazing. They were selling Swiss loans to Australians in the 1980s to save on interest rates. They never considered what would happen if the exchange rate changed and the Swiss franc rose against the A$.

Just look at these two charts. The A$ was crashing and the Swiss franc rose. The default rate on mortgages exploded and small businesses who listen to bankers pitching Swiss loans to save money lost a fortune. The same crisis took place following the Swiss/Euro Peg when that broke.

Once again, the bankers were selling mortgages in the Swiss franc in Europe to lower interest rates. I cannot tell you how many times were have been called in on major financial crises around the world all for the very same reason. People make a loan in a foreign currency to save money on the interest rate. They have NO CONCEPT that the currency can swing even 40% in a short period of time.

The Chinese Central Bank warned its provinces and corporations NOT to borrow in dollars. They understood our model and understood what happens under such a currency crisis. Nevertheless, provinces and private corporations did not listen. They succumbed to the lure of the cheap interest rate.

I had even spoken with a major company and warned them the dollar would rise and there was a serious risk in emerging markets. They were new and as you say, they listened to the majority of opinions that took the opposite forecast. Now we see bank runs in China and serious problems in emerging markets.

S&P 500 Closes Down 20 Percent from High, Officially a Bear Market


Posted originally on the conservative tree house on June 13, 2022 | Sundance 

The S&P 500 fell 151.23 points, or 3.9%, to 3749.63. The Dow Jones Industrial Average dropped 876.05 points, or 2.8%, to 30516.74. The tech-heavy Nasdaq Composite declined 530.80 points, or 4.7%, to 10809.23 (33% lower that the November record).

CNBC – […] U.S. stocks on Monday entered a bear market because the S&P 500 closed more than 21% below its all-time record close reached as recently as last January, S&P Global Dow Jones Indices senior index analyst Howard Silverblatt wrote.

Stocks had been flirting with a bear market for the past several weeks on an intraday basis, but had never actually closed below 3837, the level S&P Global needed to see in order to officially declare one.

S&P Global says a 20% decline in the S&P 500 on a closing basis from its previous peak is all it takes to define a bear market. Which means that this bear market is already more than five months old, since the S&P 500 all-time high came on January 3. (read more)