US Bank Reserves 10% – EU Bank Reserves 1%


QUESTION: What mechanism prevents banks from creating fraudulent electronic deposits of currency?
As an IT systems admin, I have the ability to add / subtract / adjust ERP systems inventory / costing outside the normal users ability. I could add widgets to the system at will, but fraud can’t be sustained very long, as the physical widgets can’t be sold, they only exist in the system. Electronic currency, however, is only a ledger entry, and since new currency units are created as loans – What prevents any bank from just changing the numbers in their systems to create more currency units at will? Can’t get my head around this.

Thanks for all you do from a little guy just trying to get by!

ANSWER: The creation of money electronically in the banking system is the degree of leverage. Reserve Requirement Ratio at the Federal Reserve was increased on January 18th, 2018. It required that all banks with more than $122.3 million on deposit maintain a reserve of 10% of deposits. Banks with $16 million to $122.3 million must reserve 3% of all deposits. They create money that is purely electronic and we do not see it. I deposit $100 and they lend it to you. Now we both have $100 on deposit and the reserve requirement will be $20 for most banks. They then lend it out a third time and there is now $300 on deposit requiring $30. They cannot create entries out of thin air. They are audited and the reserve ratio is strictly enforced in the USA. The Fed will raise and lower that reserve ratio as they see fit based upon economic conditions.

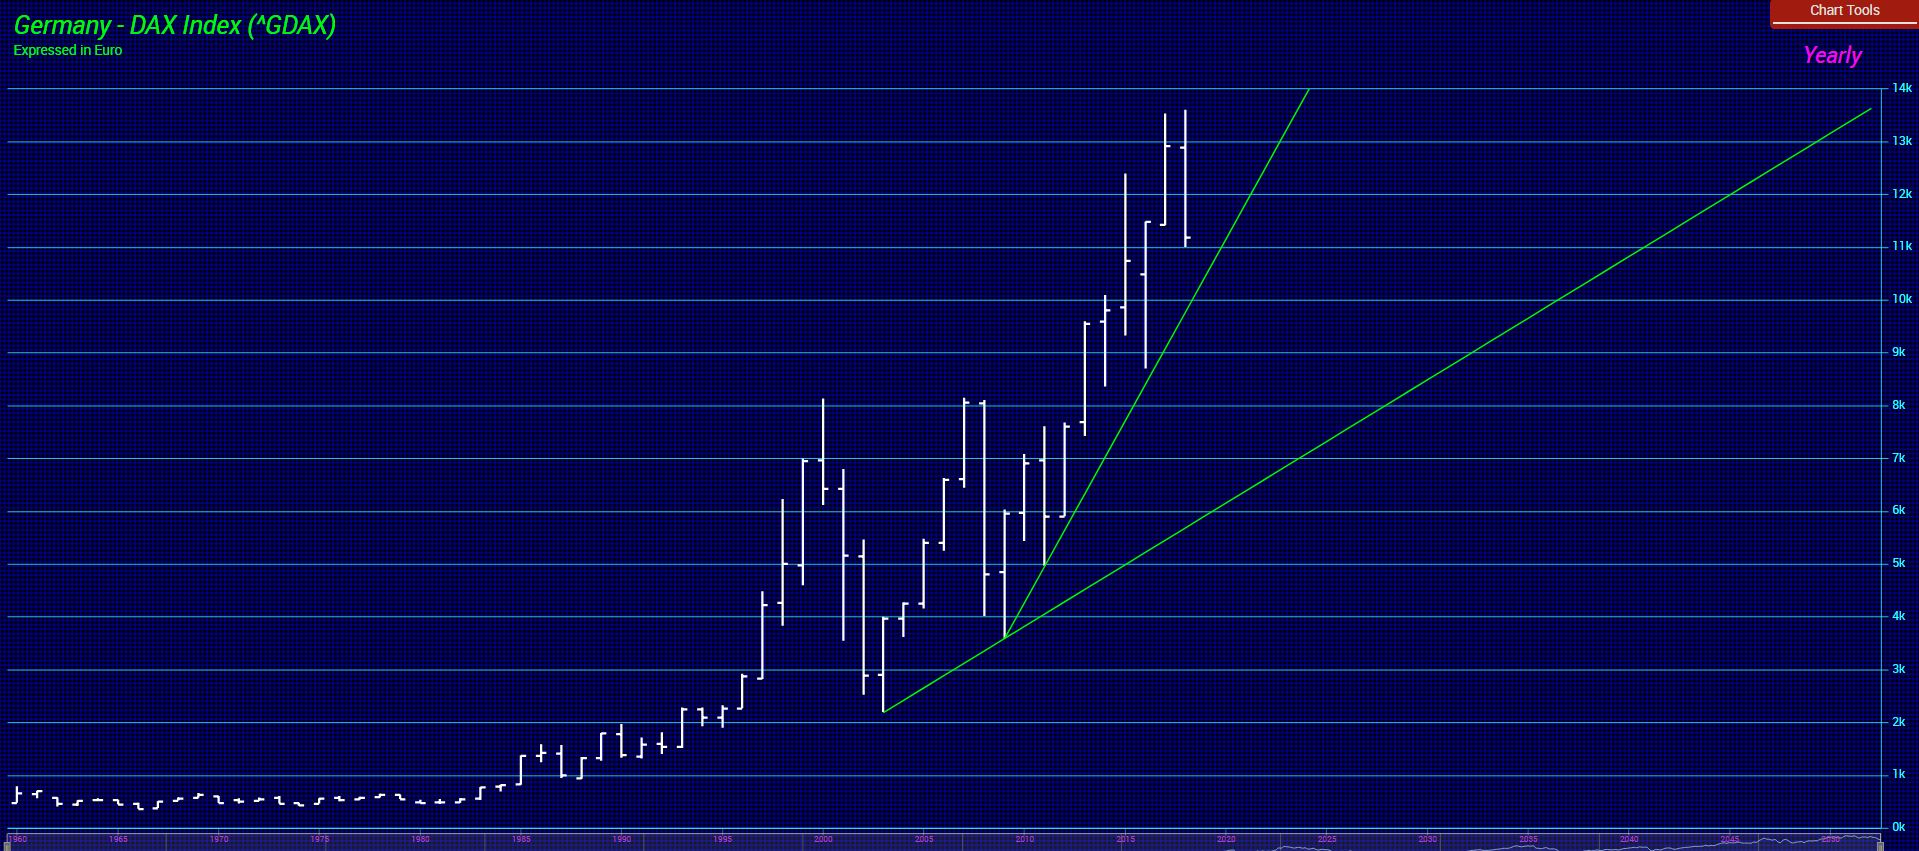
At the European Central Bank, things are substantially different. Eurozone banks are required to hold a specified amount of funds as reserves on AVERAGE in their current accounts at their national central bank in each member state which are called “minimum reserves”. Remember, each member retained its own central bank!  A bank’s minimum reserve requirement is set for six-week periods called maintenance periods. This minimum reserves level is therefore calculated on the basis of the bank’s balance sheet prior to the start of each six-week maintenance period.

Banks have to make sure that they meet the minimum reserve requirement only on an AVERAGE over the course of the maintenance period. This introduces serious risk. The bank can dip below the minimum reserve in the middle of a crisis and at the end of the six-week period, there can be no reserves remaining. So they do not have to hold the total sum in their current accounts at the central bank on a daily basis! Therefore, this is a flexible arrangement that allows the banks to react to short-term changes in the money markets, but it exposes them to tremendous risk in a financial panic. The design was claimed to help stabilize the interest rate banks charge each other for short-term funds. I totally disagree with this concept.


Up until January 2012, European banks had to hold a minimum of only 2% of certain liabilities, mainly customers’ deposits, at their national central bank. As the economic crisis has continued in Europe, this 2% level has been to 1%! The total reserve requirements for Eurozone banks stand at only around 113 billion euro currently.

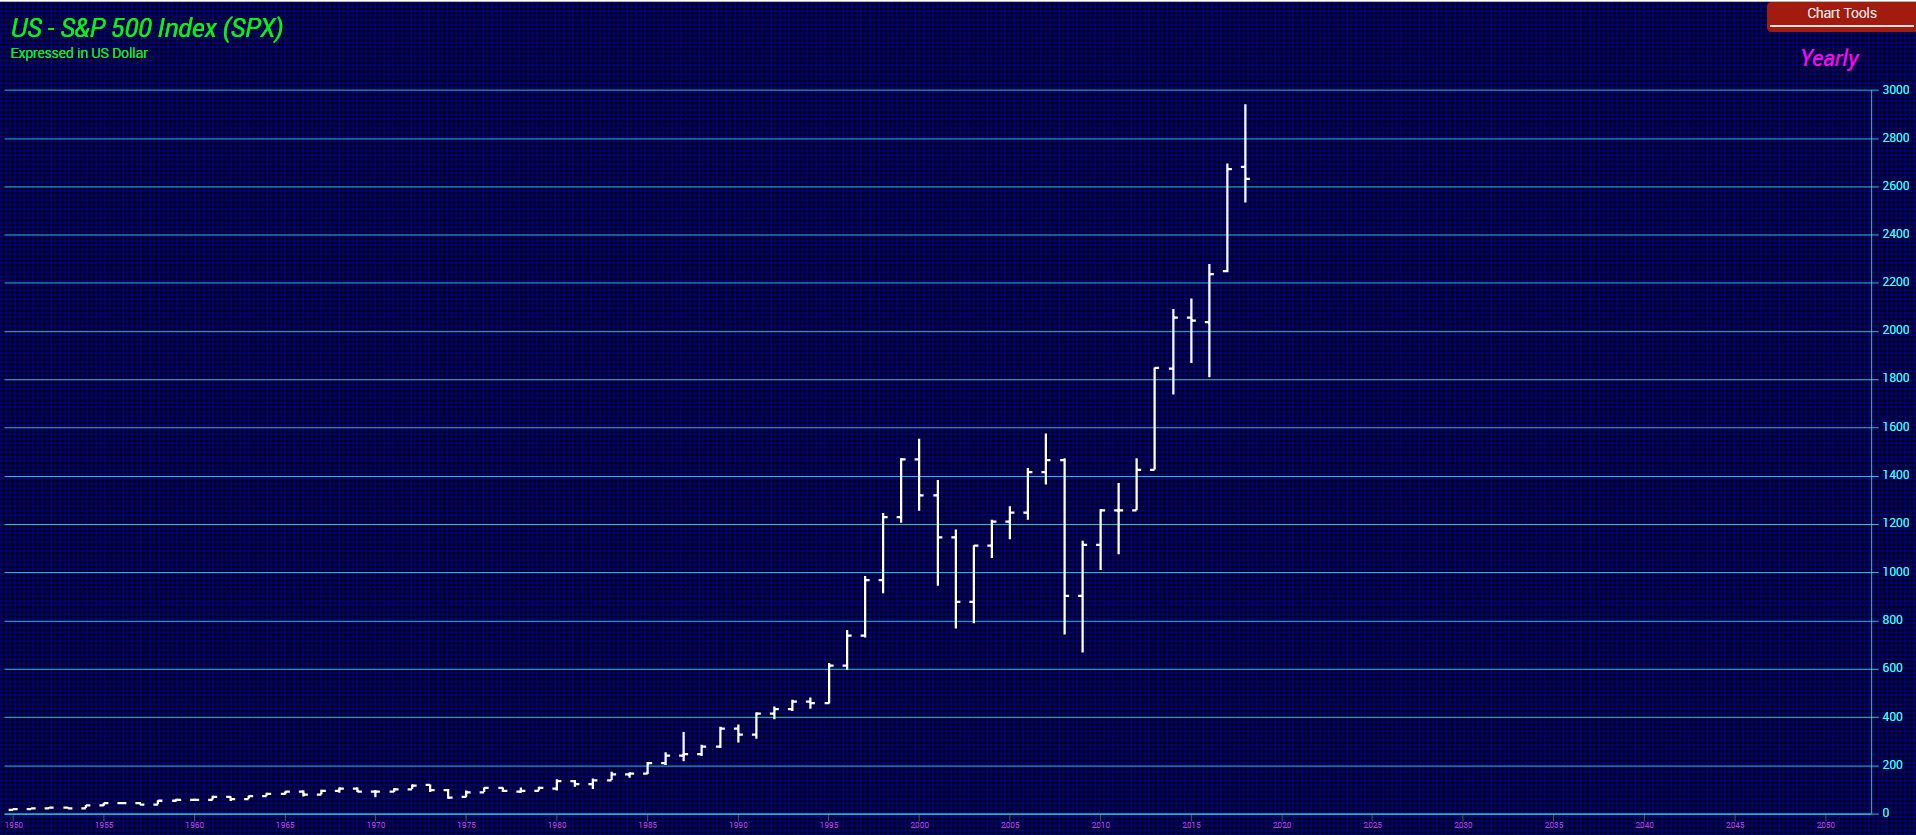
Perhaps now people will understand why I have been warning about a MAJOR financial crisis starting in Europe and spreading thereafter around the globe. The general media and the public will NOT understand the reserve ratio disparity so a banking crisis in Europe will be assumed to be the same around the world. Unfortunately, what happens in Europe will NOT stay in Europe. This is also why I STRONGLY urge Europeans to create a stash in the US banks for now. The ECB is seriously looking at creating a cryptocurrency to defeat hoarding just canceling Euro notes. That will end hoarding and they will be able to then enforce negative interest rates. From the ECB view, they are concerned about the coming bank crisis in Europe so the best way to prevent a bank run is to eliminate cash! Europeans should open accounts outside the Eurozone before it is too late.

And Prime Minister Theresa May wants to stay linked to Europe. This is when we need people who REALLY are qualified to understand the world financial system. I cannot express how dangerous it has become with politicians who are clueless about how the world economy even functions. UK banks operate under a completely different scheme.

In May 2006, the Bank of England began paying interest on bank reserve deposits at its official Bank Rate. This inspired US banks to demand the Fed pay interest on excess reserves. The Bank of England had the ‘reserves averaging’ regime back then whereby the quantity of each bank’s reserves that the Bank of England would pay interest on was restricted to a range around a ‘target’ level of reserves that the bank was obliged to pre-declare. The used to be set on a daily basis but was changed at this time to an average over each monthly maintenance period. The objective was to establish a marginal cost of reserves to the banks which would remain very near to Bank Rate. However, this was dependent upon the provision if the Bank of England supplied the right amount of reserves to enable the banks’ reserve deposits to be within this range.

In view of the Bank of England’s desire that wholesale market rates should remain close to Bank Rate was considered to be an improvement over earlier procedures prior to 2006 when reserves were mot paid interest and the Bank of England then had to supply reserves in quantities that exactly matched demand. Consequently, market interest rates tended to move towards the boundaries of the corridor formed by the Bank of England’s deposit and lending facilities. Nonetheless, under the new reserves-averaging regime post-2006, the Bank of England still had to supply reserves in appropriate amounts to meet demand, but it was more flexible. However, the new regime was still ill-equipped to cope with the expansion of reserve supply that the Bank of England then undertook to overcome the breakdown of interbank markets during the financial crisis of 2007-2009. To maintain interest rate transmission within the reserves averaging regime, the Bank of England then widened the range of reserve deposits that they paid interest on from 1% to 60% trading around the Bank of England’s targets. This required the Bank of England to then take steps to reabsorb the excess reserves.

The introduction of Quantitative Easing, which began in March 2009, merely created another problem from the reserve perspective. Suddenly, Quantitative Easing caused another larger expansion increase in reserve deposits. Rather than trying to offset this by selling other assets or making further adjustments to the reserves averaging scheme, the entire scheme was simply suspended in favor of paying interest unconditionally on ALL reserve balances.

Consequently, I have stated NUMEROUS times before, all central banks are NOT the same!!!!!!!!!!!!!!!!!!!


Central Bank Reserve Ratios
COUNTRY Bank Reserve Ratio
ALBANIA 10.00%
ANGOLA 24-May-18 19.00%
ARMENIA 24-Feb-14 2.00%
ARGENTINA 28-Sep-18 44.00%
ARUBA 11.00%
AZERBAIJAN 1-Mar-15 0.50%
BANGLADESH 3-Apr-18 5.50%
BARBADOS 5.00%
BELARUS 16-Mar-16 7.50%
BULGARIA 28-Nov-08 10.00%
CAMEROON 7-Apr-16 5.88%
CAPE VERDE 16-Feb-15 15.00%
CEN. AFRICA REP 7-Apr-16 0.00%
CHAD 7-Apr-16 3.88%
CHINA 15-Oct-18 14.50%
DEM. 8-Apr-15 2.00%
REPUBLIC 7-Apr-16 5.88%
COSTA 15.00%
CROATIA 11-Dec-13 12.00%
CZECH REPUBLIC 20-May-99 2.00%
CURACAO 10-Oct-13 18.00%
DENMARK 2.00%
EGYPT 3-Oct-17 14.00%
EQUATORIAL 7-Apr-16 5.88%
EUROZONE 18-Jan-12 1.00%
FIJI 7-Jul-10 10.00%
GABON 7-Apr-16 5.88%
GAMBIA 19-Jun-13 15.00%
GEORGIA 13-Jun-18 5.00%
GHANA 12-Nov-14 10.00%
HUNGARY 1-Dec-16 1.00%
ICELAND 1-Jun-16 2.00%
INDIA 1-Jul-13 4.00%
INDONESIA 18-Feb-16 6.50%
IRAQ 1-Sep-10 15.00%
ISRAEL 6.00%
JAMAICA 1-Jul-10 12.00%
JORDAN 12-Mar-09 8.00%
KAZAKHSTAN 2.50%
KENYA 5.25%
KYRGYZ REPUBLIC 14-Dec-15 4.00%
LITHUANIA 3.00%
MACEDONIA 9-Sep-13 8.00%
MALAWI 23-May-08 15.50%
MALAYSIA 16-May-11 3.00%
MALDIVES 20-Aug-15 10.00%
MAURITIUS 2-May-14 9.00%
MOLDOVA 4-Sep-18 42.50%
MONGOLIA 23-Mar-18 10.50%
MOROCCO 21-Jun-16 5.00%
MOZAMBIQUE 26-Oct-17 14.00%
NEPAL 11-Jul-18 4.00%
NICARAGUA 15-Jun-18 10.00%
NIGERIA 22-Mar-16 22.50%
PAKISTAN 12-Oct-12 3.00%
PERU 30-Apr-17 5.00%
PHILIPPINES 24-May-18 18.00%
POLAND 31-Dec-10 3.50%
QATAR 16-Mar-17 4.50%
ROMANIA 6-May-15 8.00%
RUSSIA 27-Jun-16 5.00%
RWANDA 5.00%
SERBIA 19-Jan-11 5.00%
SOUTH 2.50%
SRI LANKA 14-Nov-18 6.00%
TAIWAN 1-Jan-11 10.75%
TAJIKISTAN 20-Mar-17 3.00%
TANZANIA 21-Mar-17 8.00%
TRINIDAD & TOBAGO 17.00%
TUNISIA 1.00%
TURKEY 13-Aug-18 8.00%
UNITED STATES 27-Oct-16 10.00%
URUGUAY 1-Apr-13 25.00%
UZBEKISTAN 1-Sep-09 15.00%
VENEZUELA 25-Oct-13 19.00%
VIETNAM 1-Sep-11 3.00%
WEST 16-Mar-17 3.00%
ZAMBIA 21-Feb-18 5.00%


Why Has Farmland Exploded in Price? The Accidental Trend Correlation


Most people have little idea WHY big money was targeting buying farmland in Canada, USA, and Australia. It was more than just Chinese investment. With interest rates down to negative, capital has been looking for returns. They were buying farmland and then renting it out generally for 5%. This created what many call the farmland bubble which has now begun to burst in some Corn Belt states, such as Iowa, as interest rates begin to rise. In 2015, the average increase of 2.4% percent on the low end and up to 8% in some states where the crop yields were best. This has not been a small investor or spec market. This was driven by the big boys seeking yield thanks to particularly the European Central Bank (ECB).


The nominal high came in 1982 and the commodity boom peaked in 1980 and interest rates peaked in 1981. The rising dollar caused the correction in nominal terms declining into its low in 1987. The market began to recover while the days of inflation and goldbugs faded forging the final low in gold during 1999. As is often the case, people just never look at assets in terms of international value. The surge in prices of latter that domestic analysts have called a “bubble” truly reveal more of a Phase Transition type rally more than doubling in price when plotted in Euros. The key to any market lies hidden within the depths of international capital flows which are driven foremost by currency values.

The lack of individual investors infiltrating this market leaving the big agricultural bets being placed not on expectations of global food demand will increase over time, but looking simply for yield, has led most analysis astray. Institutions, like the pension fund TIAA-CREF, have been the big buyers throughout 2017. They have been looking for bargains as farm real estate values have started to decline. Small farmers are finding it difficult to borrow from the banks for a crop season which can involve loans into several millions of dollars. If crops are wiped out, then they have a real problem.

There have been stocks issued seeking to capitalize on the boom. Farmland Partners (FPI, NYSE) has been down about 20% since it was floated in 2014. It is a REIT which is a company that owns, operates or finances income-producing real estate. REITs were modeled after mutual funds to gather investors to collectively own valuable real estate and provide the opportunity to access dividend-based income and total returns. On its website, it states: “Farmland Partners Inc. is an internally managed, publicly traded (NYSE: FPI) real estate company that owns and seeks to acquire high-quality farmland throughout North America addressing the global demand for food, feed, fiber and fuel.” However, the play has NOT been the boom in commodities, but the yield from renting out the land.

Investors should be very careful with REITs because they tend to be illiquid and volatile.


When we look at the Array, we see turning points lining up for 2020/2021 and 2024 followed by 2026 and then 2028. The commodity cycle appears to be pointing to 2024. That is when we should see farmland values peak in real terms but keep in mind that it will all depend upon the particular region. The weather is going to kick in and that will reduce crop yields. Keep in mind that most of these REITs have entered this sector of the market for the wrong reason. It was not truly a commodity boom expectation as it was simply to get a 5% yield when interest rates were below that level. As interest rates rise above that 5% threshold, we will begin to see the big players bailout and begin to dump farmland at losses. Anyone looking to borrow against their land should use FIXED RATES only. If you decide to sell your land to the big boys while rates are still below 5%, the include a right of first refusal to buy it back at a reduced price when they decide to cut and run – which they will inevitably always do at the precise wrong time.

Global Cooling – not Global Warming, that we should Fear the Most.


It is incredibly important to understand that as the weather turns bitterly cold in the north, people will begin to migrate south. This not merely cause the Greeks to become the Sea Peoples, but during the Year without a Summer in 1816 even in the States when six inches of snow fell in June and every month of the year had a hard frost, people began to migrate. The temperatures had dropped to as low as 40 degrees in July and August in New York City during 1816. People also called it ‘Eighteen Hundred and Froze to Death’ and the ‘Poverty Year.’ This is what I keep pointing out that cold is what kills society and creates poverty – not warming.

The Year without a Summer sent people fleeing from New England states in search of warmer weather and fertile soils both south and west. It was the weather that began to cause migration in the United States outside of the 13 original states. Thousands of New England families gave up their farms, packed their belongings into wagons and joined the throngs traipsing over rivers and mountains to Pennsylvania and the Ohio River Valley, which includes Ohio, West Virginia, Indiana, Illinois, and Kentucky.

Indeed, between 1810 and 1820, Maine lost as many as 15,000 people. Sixty Vermont towns lost population during that decade as well. The population of 60 more Vermont towns stayed the same while the U.S. population grew 32%. When we examine Massachusetts, we can see that this state gained only 50,000 people from 1810-20, while Ohio gained five times as many. The Massachusetts Legislature tried to hold on to its citizens by passing a homestead act that gave settlers 100 acres of land for $5.

Even during the American Revolution, when John Adams set out to travel to Philadelphia, it was bitterly cold and there was a foot or more of snow covered the landscape which had blanketed Massachusetts from one end of the province to the other. Beneath the snow, after weeks of severe cold, the ground was frozen solid to a depth of two feet. Packed ice in the road made the journey very hazardous. In a letter to his wife, John Adams wrote:

“Indeed I feel not a little out of Humour, from Indisposition of Body. You know, I cannot pass a Spring, or fall, without an ill Turn — and I have had one these four or five Weeks — a Cold, as usual. Warm Weather, and a little Exercise, with a little Medicine, I suppose will cure me as usual. … Posterity! You will never know, how much it cost the present Generation, to preserve your Freedom! I hope you will make a good Use of it. If you do not, I shall repent in Heaven, that I ever took half the Pains to preserve it.”

On September 8th, 1816, Jefferson described the weather during the Year without a Summer in a letter to Albert Gallitan:

We have had the most extraordinary year of drought and cold ever known in the history of America. In June, instead of 3¾ inches, our average of rain for that month, we had only 1/3 of an inch; in August, instead of 9 1/6 inches our average, we had only 8/10 of an inch; and it still continues. The summer too has been as cold as a moderate winter. In every state North of this there has been frost in every month of the year; in this state we had none in June and July but those of August killed much corn over the mountains. The crop of corn through the Atlantic states will probably be less than 1/3 of an ordinary one, that of tobacco still less, and of mean quality.

It is Global Cooling – not Global Warming, that we should fear the most. While 1816 was the year we had a major volanic eruption, it also came during the Little Ice Age with Solar Minimum

Scientists Want to Synthetically Create a Volcanic Winter – Are they Just Nuts?


Believe it or not, pretend Scientists are actuall proposing to create a synthetic Volcanic Winter by spraying sun-dimming chemicals into the Earth’s atmosphere the same as a volcanoe when it erupts. These pretend research scientists at Harvard and Yale universities have published in the journal Environmental Research Letters proposing to inject an aerosol (SAI) to reduce the rate of global warming. They have propsed a completely unproven attempt to alter the planet using a technique involving spraying large amounts of sulfate particles into the Earth’s lower stratosphere at altitudes as high as 12 miles. They argue to deliver the sulfates with specially designed high-altitude aircraft, balloons or large naval-style guns. To accomplish this they want $3.5 billion, with annual costs of $2.25 billion a year over.

This is exactly as the chemtrail conspiracy theory which is based on the belief that long-lasting condensation trails are “chemtrails” consisting of chemical or biological agents are left in the sky by high-flying aircraft that are sprayed for undisclosed reasons. It seems that the pretend scientists have taken the chemtrail theories to a new level. They say they are only dimming the sun. Guess they have no clue about weather history and volcanic winters, Guess shattering 150 year cold records for thanksgiving is still too warm for these people.

Climate Change is not just simply that there is a unusual cold storm or heat wave. Yet these people harp on each individual event as proof of their theory. Real climate change has to do with shifting patterns of weather and the progressive long-term trend. Their forecasts are based upon assuming whatever trend is in motion will remain in motion. That is a fatal flaw in analysis if we are talking about markets or weather. They really need to understand that there are cycles to start with

Climate Change – More than Global Warming


There is a lot more to Climate Change than the dire predictions that we will be eating each other by now. The Sahara Desert was once lush and green. Then the weather systems shifted and the once fertile land turns to desert. The Sphinx is believed to have the face of Khafra of the 4th dynasty during the Old Kingdom which was carved perhaps around 2500BC. Some believe that the Sphinx predates the Egyptians and was actually a lion because there appear to be what some claim are water erosion marks. If true, then the original Sphinx may have existed even as far back as 10,000BC when a Lion would have faced the constellation, Leo. We do know that the Sahara was lush and tropical perhaps as late as 6,000 years ago. Curiously, this is about the length of recorded history. The stories of Noah seem to predate this period of recorded history and might have been linked to dramatic climate change. The story of Noah was even celebrated in Anatolia (modern Turkey) on the coinage of the Roman Empire.

The weather has been changing in the desert. It is now in bloom once again. Indeed, there have been recent discoveries which confirm that the Arabian Peninsula was once a lush place. Tuthmosis IV was the 8th Pharaoh of the 18th dynasty of Egypt, who ruled in approximately the 14th century BC. The dream Tuthmosis IV took place when he was a prince. He dreamt that he stopped to rest in the shadow of the Sphinx during a hunting expedition in the desert. While asleep, the Sphinx spoke to him, saying that he would become king if he cleared away the sand that all but buried the Sphinx. When he became king, Tuthmosis IV cleared the sand and erected a stele that tells the story of his dream.

There have been elephant tusks discovered and scientists have also uncovered 10,000 ancient lake and river beds across the Arabian Peninsula. All of this confirms that the climate was very different. What we do know is that the tropical belt has been moving northward once again. It was previously over the Sahara about 6,000 years ago. There are also cave drawings showing abundant wildlife in the Sahara.

The question that arises is that the climate change we are witnessing is certainly not caused by humans. It has happened before many times. It is getting colder in the northern regions and what was desert is starting to bloom.

What we do know is that Northern Africa was invaded by the Sea People who were probably Greeks forced to flee because of Climate Change. Perhaps we are witnessing similar events over the next 20 years of the dryer and colder weather in the north which compels many to flee to the south.

Global Cooling is Real – Major Temperature Low 2046?


While NASA has now confirmed that the outer atmosphere is getting cooler, it seems desperately insane for people to keep denying the possibility the Global Cooling is taking place rather than Global Warming when the former brings famine and the latter brings economic expansion as civilizations rise. The rise of Rome was due to global warming as was the case after the Dark Age when they call that the Medieval Warming Period which was 950 to 1300AD.

The concern from just a technical model perspective is that the warming period we have had post-1600 and the low of the Little Ice Age has not exceeded that of the Medieval Warming Period. If we simply look at this chart from a technical perspective, it appears more that we are in a grand downtrend for the past 6,000 years. This is deeply concerning for we tend to have these periods where civilization turns downward. It would be very nice if we just had authoritative research funded to explore Global Cooling to save society rather than this nonsense of Global Warming just to raise money for politicians who NEVER get enough.

In Australia, with one week from summer, it is still snowing on Victoria. In fact, one of the top NASA scientists has broken camp and warned that the surface temperature of the sun has collapsed so much, he fears a new Ice Age is upon us. Meanwhile, this has been the COLDEST Thanksgiving in 150 years!

What we must understand is this has gone beyond just breaking records for one-day events. This time around, it’s not just the severity of the cold that’s getting to people. It’s also the DURATION! The most reliable computer model projections have shown that the Arctic air has moved all the way down into Texas. Indeed, here in Tampa, the temperature is about 10 degrees below normal at times. The decline in the energy output of the sun has been far more rapid than most expected. This could perhaps be a warning sign that we will make a new lower low or retest the low temperatures on a sustained basis that match the Little Ice Age.

The Little Ice Age marked a period of cool summers and bitterly cold winters to New England. There was the Great Snow of 1717, which buried houses and resulted in having to organize search parties that were even lost while looking for buried survivors. Them there was the fame Cold Friday of 1810. People actually died in their homes as the temperature suddenly plummeted more than 60 degrees in less than a day. It was years later when Henry David Thoreau’s mother recalled how dishes froze as fast as they were washed even right next to the fire.

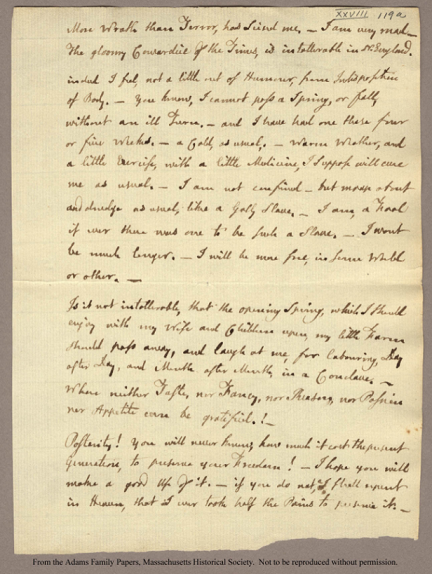
The Post Office even issued commemorative stamps in 1976 noting that winter event. Washington and his troops suffered more in Morristown, N.J., during the Hard Winter of 1779-80. Violent snowstorms had battered the Northeast, and both Boston and New York harbors were completely frozen over. The weather made it impossible to bring supplies to the men, many of whom had no coats or even shoes. They couldn’t even eat for days at a time. The soldiers finally mutinied in early May, though an officer persuaded them to abandon their rebellion. Just as the weather had defeated Napoleon, weather nearly defeated the American Revolution.

If this trend continues during the next winter, then we have exceeded any short-term reactionary trend and the weather appears poised to continue to get colder going into the distant future. Socrates was projecting that the peak on this cycle aligned with the ECM 2015.75. This is a Longitudinal Cycle, not Transverse. That means peak to bottom varies. This short-term wave should be a 13-year decline from 2015 making it 2028 initially. After that, if we see colder winters beyond 2028, then the next low will be with the peak in the ECM 2032. There is a SERIOUS RISK that we are looking at the final low coming in during the period of 2046.