Posted originally on the conservative tree house on October 26, 2022 | Sundance
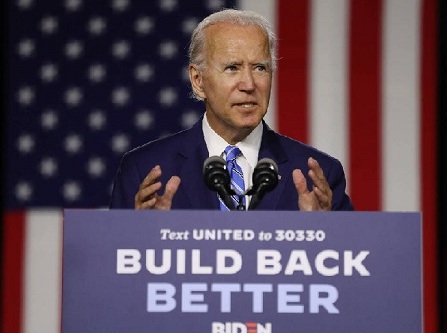
During a White House announcement today, Joe Biden pledged to have all agencies in the federal bureaucracy begin to target private industry for charging service fees, or what the administration calls “junk fees.” The junk fees relate to everything from bank overdraft charges, to hidden cleaning fees on car rentals, to hotel resort fees and even fees on airlines for seats with more legroom.
According to the White House, the junk service fees disproportionately impact marginalized communities, minorities and low-income households. The airline fees are particularly racist because the airline prices for more comfortable seats have a “disparate impact” (legal term for federal intervention) on protected categories of people.
Poor people cannot afford bigger seats. Poor people are disproportionately minority. Ergo a higher percentage of minority people cannot afford the comfortable seats. That makes charging more for comfortable seats an illegal practice according to the legal theory of ‘disparate impact.’ WATCH:
[Transcript] – […] Some airlines, if you want six more inches between you and the seat in front, you pay more money. But you don’t know it until you purchase your ticket.
Look, folks, these are junk fees. They’re unfair, and they hit marginalized Americans the hardest, especially low-income folks and people of color. They benefit big corporations, not consumers, not working families. And that changes now.
You know, we’ve been working on this for a while. I know it’s been a tough few years. But from day one, my administration has been laser-focused on easing the burden facing working-class families and giving them, as my dad would say again, just a little breathing room.
And because of the steps we’ve taken, the United States is in a stronger position today than any other country in the world, economically.
Jobs are up. People are back to work. American manufacturing is roaring back.
As a matter of fact, I’m going to be heading up to Syracuse, New York — that area — where a U.S. company, Micron, is going to be investing $100 billion. I think I go day after tomorrow or the day after tomorrow. Manufacturing computer chips will put tens of thousands of Americans to work.
Working hard to tame inflation with policies to bring down the cost of gasoline, home energy bills, and prescription drugs. (read more)

The justice department’s use of the legal theory behind “disparate impact” was an outcome of Barack Obama and Eric Holder taking office.
The Disparate Impact outlook then became part of the regulatory and compliance system within every agency of the federal government, including the Dept of Labor.
Essentially, it is a progressive legal theory advanced by the long-term members of Lawfare, and it carries inherent conflict with existing law. Take this example…..
The Dept of Labor states that businesses cannot discriminate in employment law based on legally protected categories of person, like race, marital status, nationality, sex, gender, pregnancy, or sexual identity. Simultaneously, it is also unlawful for businesses to hire illegal aliens as workers. When businesses used social security systems to check employment eligibility, they ran afoul of the ‘disparate impact’ rule.
A higher percentage of Mexican nationals were disqualified from employment because a higher percentage of Mexican nationals in the U.S. used fake documents. Because the percentage of disqualified Mexicans for employment exceeded the percentage of Mexicans in the population, the use of the SSI system for employment eligibility was originally unlawful under the rules of ‘disparate impact.’
It sounds crazy, but that’s the way this legal term is used within the federal bureaucracy.
Disparate Impact is the underlying premise behind the regulatory authority Joe Biden is stating today in his approach toward “junk fees.”
This is the larger legal framework behind Social Justice, Economic Justice and Equity.