
I agree with Sundance we are in a battle for the very fabric of our country and of our personal souls we can not let the “Dark Side” win it’s all or nothing now boys and girls!
Monthly Archives: June 2016
The EU Determined to Ensure BREXIT Will Not Succeed
Armstrong Economics Blog
Re-Posted Jun 21, 2016 by Martin Armstrong

The voter fraud in the Austrian election to save the EU has been ruled by the Austrian Constitutional Court has revealed outrageous “errors” to the point that votes were simply regarded as non-binding recommendations. The investigations continue, but this reflects the desperate attempt to save Brussels at the expense of all of Europe. This was portrayed as dangerous had the people been allowed to actually vote so the election had to be rigged. This casts a lot of questions over the reality of BREXIT vote to take place on the 23rd. Is there any hope of a real election at all? Unfortunately, those in Brussels, like the Troika, cannot be voted out of office since they have defeated any possible democratic vote. They never stand for election. The very people who dictate the fate of Europe and are responsible for undermining all the pensions with negative interest rates, never stand for election at any time and still tell the people it is a democratic process. Why any Brit would surrender their independence to become economic slaves to Brussels just shatters the mind. This is a dangerous situation for the only means to reform or disagree with the policies in place will be civil unrest if not war.
Meanwhile, in France, President Francois Hollande has proposed to actually ban all demonstrations, according to his presidential spokesman. The excuse is of course the country is plagued by terrorism, and with Hollande less than 15% in the polls, the conditions are not in place to protect “personal or public property.” He said: “At a time when France is hosting the Euro 2016 [football tournament], when it is faced with terrorism, demonstrations can no longer be authorized if property, people and public property cannot be safeguarded,” Hollande told a Cabinet meeting, according to his spokesman Stephane Le Foll, AFP reported. Very convenient.
In Italy, we now see the Anti-establishment Candidate Taking the lead in the Rome Mayoral Election. The disagreement with the management of the “establishment” on a worldwide basis is rising precisely in line with our Cycle of War. This is part of the cycle and why we sadly will see the crumbling of Western Civilization as the financial capital of the world moves to China after 2032. Even in Japan, you have Finance Minister Taro Aso asking just how long the elderly intend to live effectively saying – die already, to reduce the government payouts.
Politicians Are Still in Denial
Armstrong Economics Blog
Re-Posted Jun 21, 2016 by Martin Armstrong

Arrogant politicians are in a state of denial. Some politicians think Trump cannot win the general election and are still trying to deny what this election is all about. True, they concede, Trump received more votes than any other Republican in history. He beat every candidate, but that is still not good enough. He won the primary election but that is different from a general election. These politicians refuse to accept the idea that the people are just upset with career politicians in both parties.
Central Banks Made Government Debt the Riskiest Debt of All Time!
Armstrong Economics Blog
Re-Posted Jun 21, 2016 by Martin Armstrong

The central banks have risked it all and lost. They have reached the point of no return. The Fed decided not to raise rates, which are desperately needed to prevent a collapse in pensions and insurance companies, and merely froze like a deer in headlights. The superficial analysts who think lower rates are good for the stock market are blinded by their own stupidity. The theory that low rates will encourage people to buy stocks is brain-dead and demonstrates that these people are incapable of comprehending how the economy functions.
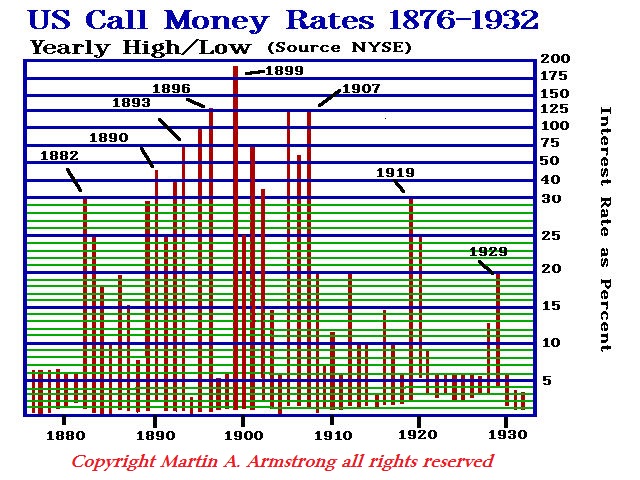
We have taken simple correlations of interest rates and the stock market and discovered something in plain sight. The market has NEVER peaked with the same level of interest rates in history. WHY? It is not the empirical level of interest rates that matters, rather it is the rate of interest that is a factor of expected inflation. Therefore, if the expectation of gain is greater than the rate of interest, there is profit in borrowing. If the expectation is below the rate of interest, then the rate must decline. Consequently, assuming that simply raising or lowering rates will reverse the trend is primitive and lacks any analysis whatsoever.
The central banks have gone way too far and are now trapped. They do not have the ability to influence the economy anymore for they are loaded with government debt that will default. They have converted government bonds into one of the riskiest asset classes of all time.
More and more of our institutional clients (pensions & insurance) are bailing out of government bonds and switching to corporate. Why? No major corporate debt becomes worthless. One was audited by S&P and they remarked that they were taking on more risk. They conducted their own studies to verify what we have been saying and found no corporate defaults, but countless government defaults and partial defaults. In the few rare cases of a default, you receive a payout after liquidation. In the case of government debt, you have something to frame and that is all. Government debt is unsecured and since they have the guns and the armies, you cannot force them to pay anything.
Some insurance companies have come out and stated publicly that they are selling government debt and moving to corporate. Swiss Re AG moved more of its investments into corporate debt as conceded by its chief investment officer who said, “If you’re looking for a bubble, here you go…With government bonds, you’re not adequately compensated for the risk you’re taking.”
We have been in meetings with pension funds. Here too, we find the same response. They are starting to shift. Government debt has become a time bomb. A simple 1% rate hike will be devastating to bond values and blow the budgets of government sky-high.
The European Central Bank has created a total mess of the European banking system. Negative interest rates have been devastating. Now in the Middle East, the National Bank of Abu Dhabi and First Gulf Bank PJSC are exploring a potential merger to create the largest lender in the Middle East. But forget the fluff — banks do not merge unless there is a problem. Rumors behind the curtain say First Gulf Bank PJSC is in trouble.
Negative interest rates have destroyed much of the economy. The rise in regulations and taxes have combined to create the weakest recovery in the United States post-Great Depression. This is not going to end nicely. It is only a matter of time before the general public begins to see the real crisis, and then everything will explode in their faces.
Media Ignores British Citizen Assassination Attempt of Donald Trump in Las Vegas – (W/ Police Complaint pdf)
The only one we will hear about is one that gets close to Trump and even then only if a shot is taken. I hope and pray that none of the attempts that will be made get close, but there will be more.
The Father of the European Union – The Real Mover & Shaker Behind the Curtain
Armstrong Economics Blog
Re-Posted Jun 20, 2016 by Martin Armstrong

 Most people have never heard of the real man behind the curtain who inspired the idea of the European Union. They certain do not realize that his idea was to stop the inbreeding within Europe and to support the mixing of peoples and many say races to create the United States of Europe. Richard Coudenhove-Kalergi (1894-1972), was of noble birth and was very much an elitist. He is the real father of the European Union for his efforts go back to 1922 when he founded in Vienna the “Pan Europe” movement. Indeed, his idea was partially supported by the fact that the people of Europe migrated to the United States and intermarried to create America. He saw the same thing was necessary for Europe. This idea is behind German Finance Minister Schäuble outrageous statement that the refugees are needed calling for more immigration into Europe otherwise, Europe will“degenerate into [an] inbred” continent. This is right out of Coudenhove-Kalergi whose argument captured many elitists and spread from Austria to most other countries within Europe. You have to keep in mind that the Royal families were engaged in such a policy. The English monarch is related to the German, Russian, Dutch, and Spain where there were all intermarriages under the theory of creating political stability.
In 1938, Coudenhove-Kalergi had to flee from the Nazi regime and sought asylum in Switzerland and then moved to the United States. Many people have heard of Hitler and his idea of a master race of pure blood, what they do not realize is that this idea was the opposite of Coudenhove-Kalergi’s proposal which is why he had to flee. Coudenhove-Kalergi marketed his vision to breed Europeans into a single race managing to gain many politicians to support his idea based in part on the melting pot of America. However, he would take it even further.
On his return to Europe, Coudenhove-Kalergi was no doubt the initiator of the Parliamentary Union and the concept behind the Treaty of Rome and the evolution of the euro to attempt to merge Europe into the federalization process. Finally, during 1966, Coudenhove-Kalergi submitted before the X. Vienna Paneuropean Congress a memorandum for the future of Europe, which is still regarded as an important guideline to this day. Coudenhove-Kalergi managed to become an adviser to Charles de Gaulle, Georges Pompidou and Konrad Adenauer and Bruno Kreisky.
The sudden advocacy of Schäuble to mix the races and German women should marry refugees has a rather disturbing link to Coudenhove-Kalergi. In his book Praktischer Idealismus (Practical Idealism), he wrote:
The man of the future will be of mixed race. Today’s races and classes will gradually disappear owing to the vanishing of space, time, and prejudice. The Eurasian-Negroid race of the future, similar in its appearance to the Ancient Egyptians, will replace the diversity of peoples with a diversity of individuals. …
Instead of destroying European Jewry, Europe, against its own will, refined and educated this people into a future leader-nation through this artificial selection process. No wonder that this people, that escaped Ghetto-Prison, developed into a spiritual nobility of Europe. Therefore a gracious Providence provided Europe with a new race of nobility by the Grace of Spirit. This happened at the moment when Europe’s feudal aristocracy became dilapidated, and thanks to Jewish emancipation.
id/Coudenhove-Kalergi 1925, pp. 20, 23, 50
There is a lot more going on behind the curtain than people realize. The Pan European idea will fail. They are missing the very element that made it work in the United States – a single language. You will not see Scottish men marrying Italian women generally because of language. Without a single language, Coudenhove-Kalergi idea of simply breeding all the races together to end war is rather absurd. There have always been those who see themselves as playing the roll of God.
Assassination & Conspiracy Theory to Prevent BREXIT Vote?
Armstrong economics Blog
Re-Posted Jun 20, 2016 by Martin Armstrong
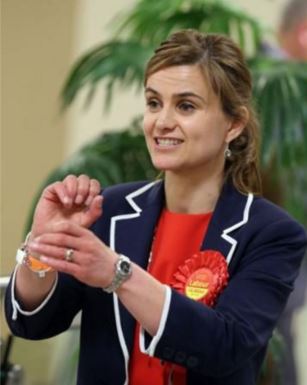
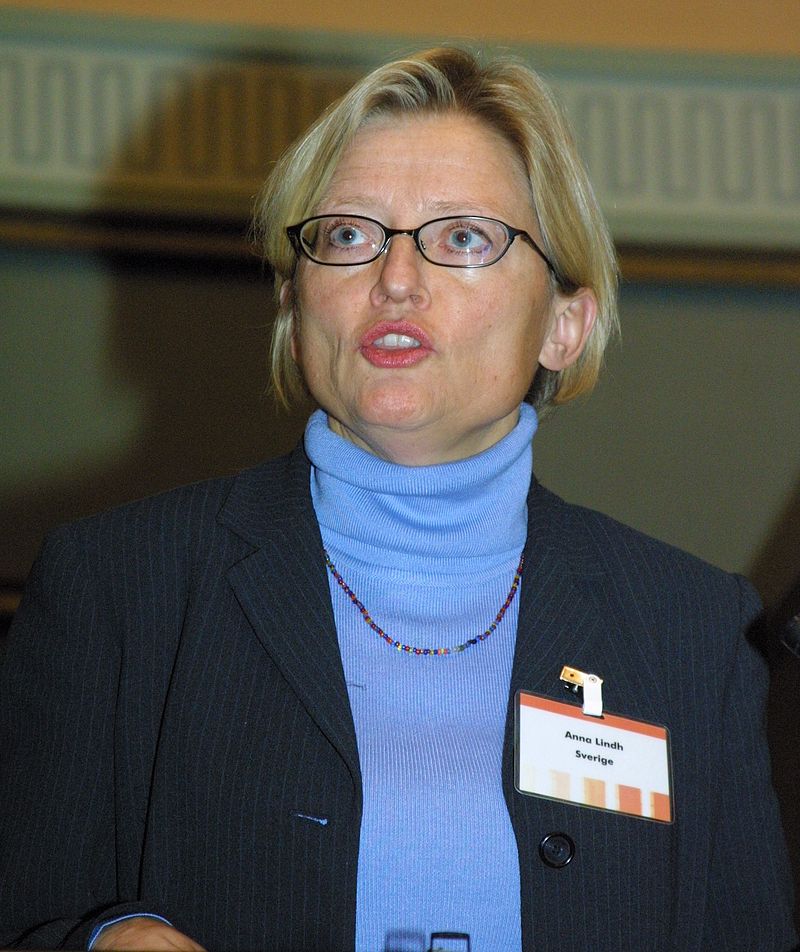
 There is disturbing opinion circulating about Jo Cox may have been assassinated to prevent a BREXIT vote. Many are starting to believe there is a conspiracy plot connecting the dots to ensure a sympathy vote to remain within the EU. People are pointing to the familiar tool of assassination often used to achieve political agendas. Of course there is the Kennedy assassination that many believe was orchestrated to create the sympathy vote to start the Vietnam War when in fact Kennedy vetoed such a measure. But the more recent assassination was on September 10th, 2003. Anna Lindh (1957 – 2003), was a Swedish Social Democratic politician who was a member of parliament from 1982 to 1985 and 1998 to 2003. Anna was elevated to minister for foreign affairs by prime minister Göran Persson in 1998. She was widely considered to be his successor as party chairman and there was much hope that she would become prime minister.
Lindh was a supported of adopting the euro. She became the face of joining the new EU and was to be on a TV debate when in Stockholm on the afternoon of September 10th around 4 pm, she was attacked with a knife while shopping in the ladies’ section of the Nordiska Kompaniet department. Lindh was to appear on a televised debate later that night on the referendum about Sweden’s adoption of the euro. At the time of the attack, Lindh was not protected by bodyguards from the Swedish Security Service.
 Then there is the unsolved assassination of prime minister Olof Palme in 1986. Palme was accused of being anti-EU and more pro Soviet. His assassination did clear the way for Sweden to join the EU, which was finally presented in the Swedish European Union membership referendum of 1994 approved, which gain only a 52% majority.
While Silvio Berlusconi was not assassinated, the EU did stage a coup against him because he wanted to take Italy out of the euro. Then there was the Greek Prime Minister Georgios Andreas Papandreou who wanted the Greek people to vote on any bailout to stay in the euro. He was told by Brussels there would be no referendum.
The recent Austrian election was rigged with the closest race in history decided by the mailed-in ballots. As the days have passed, the results of the Austrian presidential election have become far more suspicious. The official results claimed the far-left candidate Alexander Van der Bellen defeated Norbert Hofer from the Freedom Party of Austria by just 31,000 votes, 50.35% to 49.65%. Again, the fate of the EU hung in the balance. The provisional result in voting reflected major polls released in the last days before the election, which all showed Hofer with the clear majority of public support over his rival coming in at 53% to 47%.

The Scottish youth called their referendum to leave the UK a “REVOLUTION” and felt very betrayed by what they called the over “65” crowd who just wanted their pension checks from London. It is clear that when people are voting with paper ballots, they vote can easily be rigged. There were countless photos of how they committed outright fraud to ensure there would be no “yes” vote.

David Cameron basically said reading between the lines – the younger generation lost and their fate is now settled “for a generation.” This degree of arrogance is not going to be helpful. Governments will not reform and that brings us only to the point of our rising civil unrest that will rip the systems apart. No one in charge will address the long-term. They are only concerned about one vote at a time.
So is there a conspiracy? Perhaps. They would never investigate themselves, so all this is has been suspicion. What is clear, has been that the EU will collapse if BREXIT is allowed. There is far too much at stake to allow this vote. The burning question will be, just how they cover it up and at what cost?
President Obama and Attorney General Loretta Lynch Have a “Terror Truth” Problem…
We now have A string Muslim protective propaganda presentations ranging from Ft Hood (work place violence), Benghazi ( film no one saw), Boston 9misguided kids), San Bernardino (Lone Wolf) and, Orlando (Disturbed man) which were all perpetrated by Muslims practicing their beliefs. This is what Muslims do when they follow their Qur’an. If you don’t like this its real simple don’t bring the Muslims here!
Venuzeula’s Food Crisis Worsens…
This is what happens when there is just too much free stuff!
Analysis of Global Temperature Trends, May, 2016, what’s really going on with the Climate?
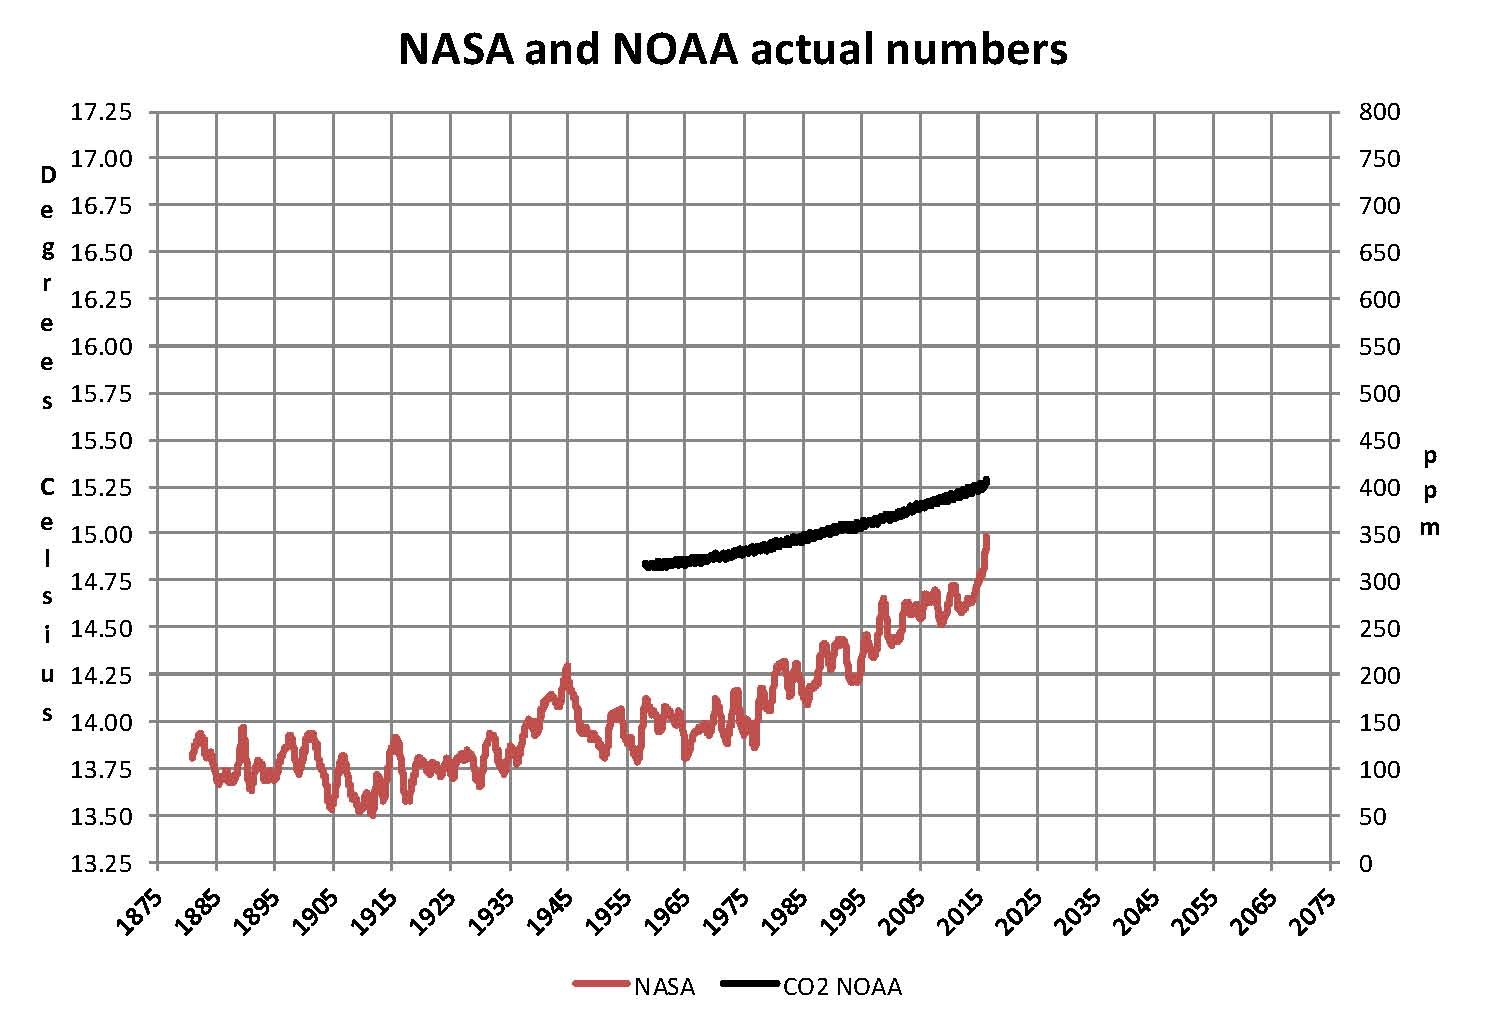
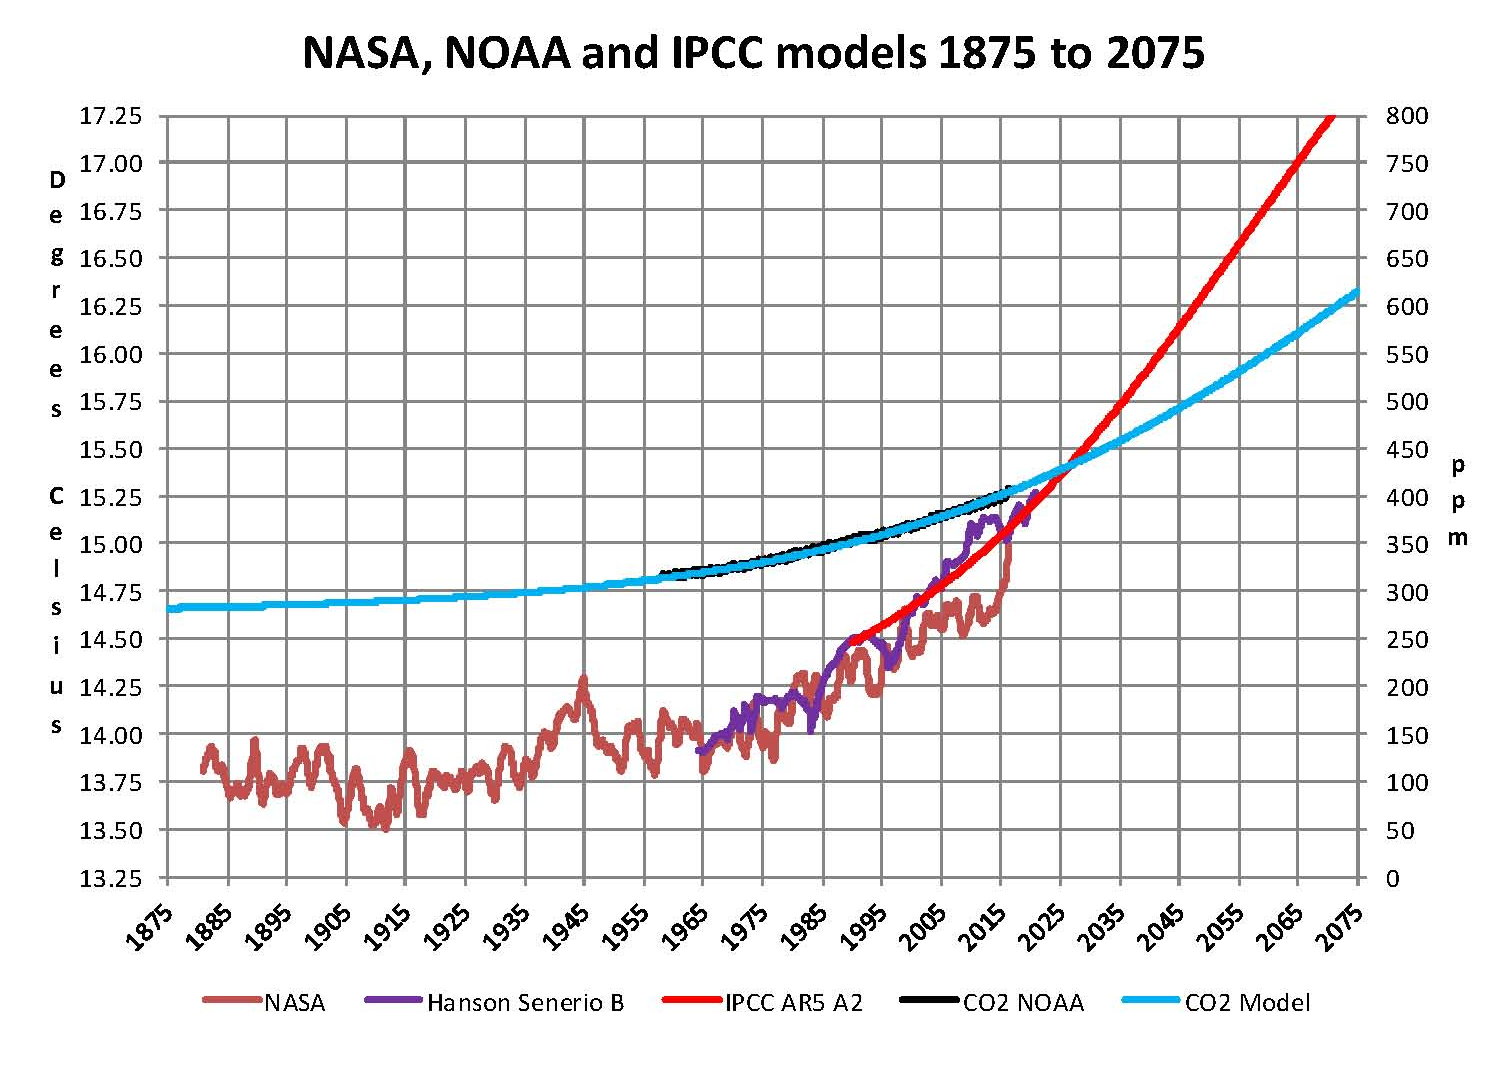
The analysis and plots shown here are based on the following two data series. First NASA-GISS estimates of a global temperature shown as an anomaly (converted to degrees Celsius) as shown in their table Land Ocean Temperature Index (LOTI) and shown in the following Chart as the red plot labeled NASA. This plot is shown as a twelve month moving average to minimize the large monthly swings and better show trends the scale for the temperatures is on the left. Second NOAA-ESRL Carbon Dioxide (CO2) values in Parts Per Million (PPM) which are shown in the following Chart as a black plot labeled NOAA. This plot is shown exactly as the data from NOAA is presented and not as a moving average the scale for CO2 is shown on the right.
NASA published data as stated in the first paragraph is shown as an anomaly, but what is a temperature anomaly? An anomaly is a deviation from some base value normally an average that is fixed. There were two problems with the system that NASA picked which were number one there is no “actual” global temperature and two since climate is a variable there cannot be a real base to measure from. NASA known for its expertise back in the day thought it could get around these issues and created a system to do so. First they developed a computer model which took readings from all over the planet and made adjustments to them called homogenization and came up with the estimated global temperature. Second they picked the period 1950 to 1980 (30 years) and averaged the values and came up with 14.00 degrees Celsius and make that their base. Then they took that temperature and subtracted the base from it which gave them the anomaly. The problem is that both the base and the anomaly are arbitrary.
Now that we have a base to work with we are going to add to the previous Chart three things. The first is a trend line of the growth in CO2 since that is the entire basis for climate change according to the government through NASA and NOAA. That plot is superimposed over the black plot of the actual NOAA CO2 values as the cyan line labeled as the CO2 Model and one can see there is a very good fit to the actual NOAA values so there should be no dispute about its validity. This plot allows us to make projections as to future global temperatures according to the science. The second added item is James E. Hansen’s Scenario B data, which is the very core of the IPCC Global Climate models (GCM’s) and which was based on a CO2 sensitivity value of 3.0O Celsius per doubling of CO2. This plot is shown here in lavender and is part of a presentation that Hansen showed to congress in 1988 when the UN was about to set up the International Panel on Climate Change (IPCC) and this plot is labeled as Hansen Scenario B which Hansen stated was the most likely to happen based on his theories’. The third item is the current plot of the most likely temperature of the planet based on the growth of CO2 published by the IPCC. This plot is shown in Red and is labeled as IPCC AR5 A2 as that is the table where the data was found. This plot is a GCM computer projection of the planets temperature based to the complex relationships developed on the levels of CO2 by the IPCC through NASS and NOAA.
It can be seen in this Chart that the lavender plot and the Hansen plot are very close from 1965 to around 2000 after that, from 2000 to 2014, there is a very large and growing deviation reaching close to .5 degrees Celsius in 2014, which is not an insubstantial number. Also of note is that there doesn’t seem to be a good correlation between the growth in CO2 and the increase in the planets temperature. The CO2 is going up in a log function and the Temperature was going down in a log function until recently where it reversed and is now going up in a log function. That major change in direction that occurred in 20014 is the subject of this paper.
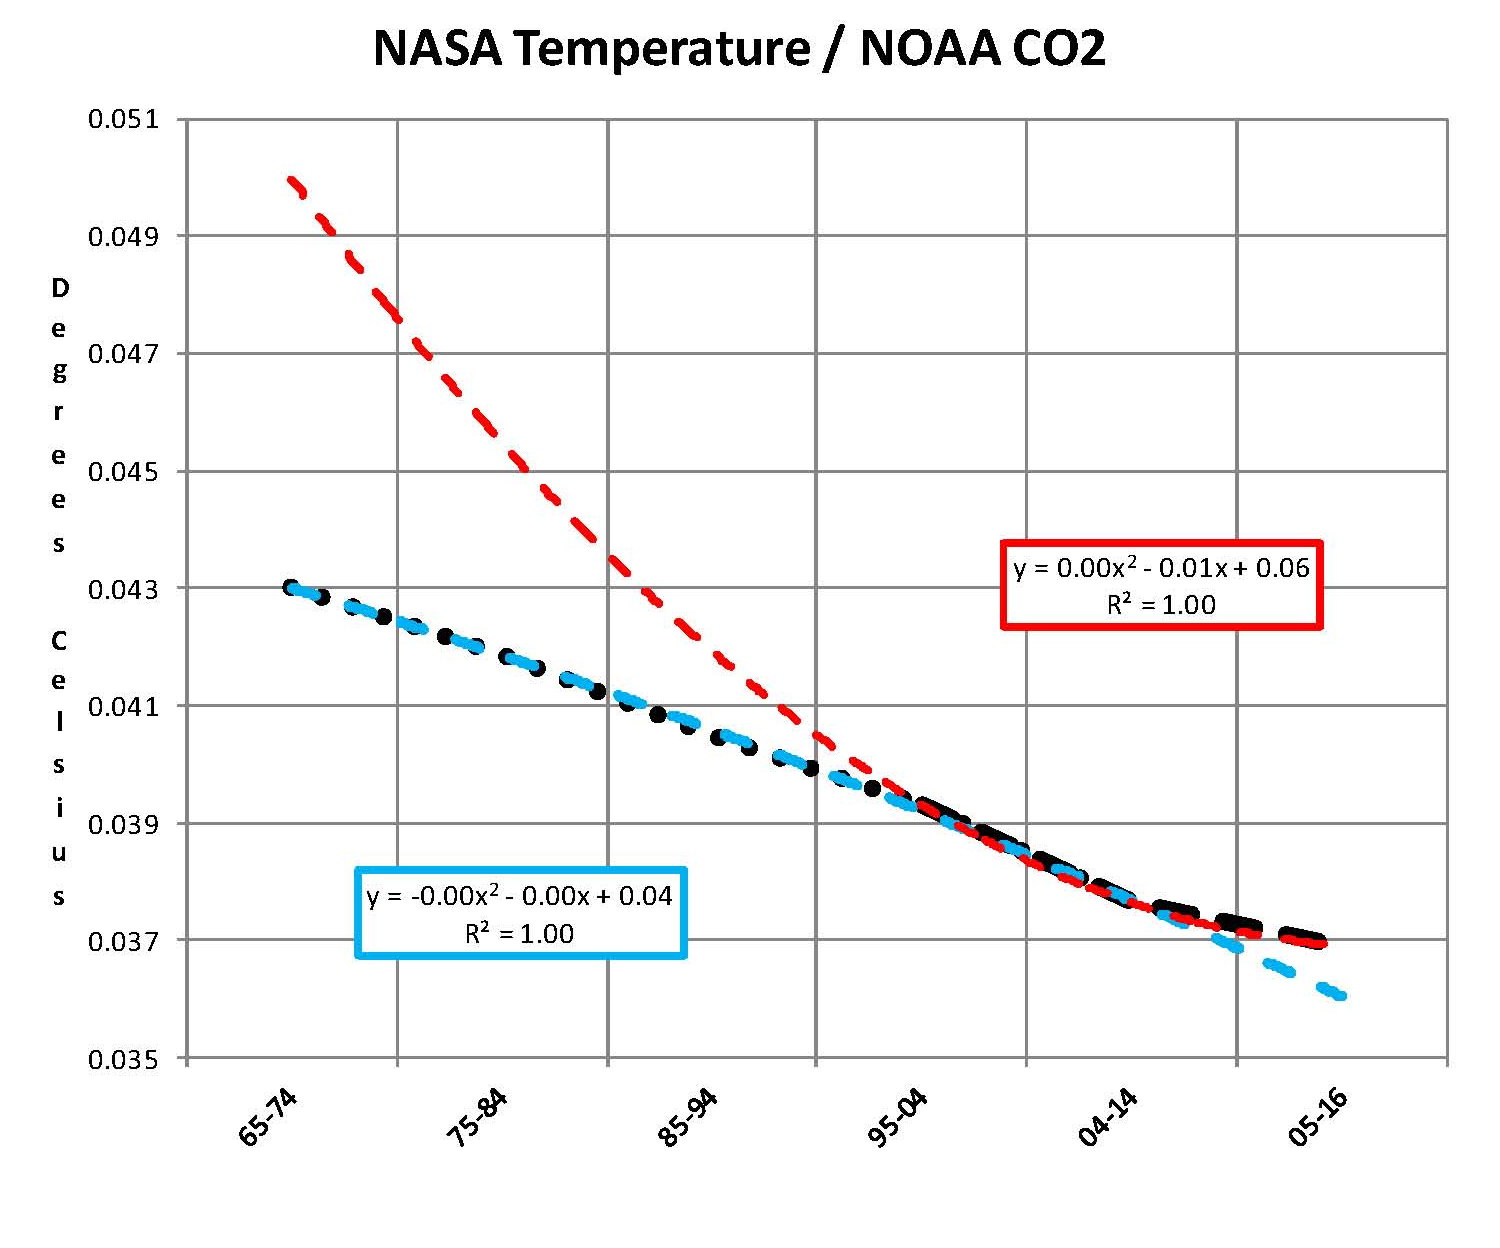
The next Chart is developed from the raw data from NASS and NOAA as shown in the first Chart. This plot was made first by adding ten years blocks of temperature and CO2 as indicated in the Chart and diving by 120 to give an average for each. Then the average Temperature was divided by the average CO2 to give degrees of temperature increase per PPM of CO2. After that was plotted it appeared that there were two different curves the first was from block 1965-1974 through block 2004-2014 shown as Black Dots and the second was from block 1995-2004 through block 2005-2016 shown as Black Dashes. When trend lines were added they were both almost perfect fits to the raw data and so you cannot see the data points very well on the Chart. These blocks were picked to represent the entire period of time where we had both NASA temperature data and NOAA Co2 levels.
On the following Chart are two sets of color coded information. The first is Cyan plot and the Cyan box with the equation in it along with the R2 value 0f 1.0 are for the first series from block 1965-1974 through block 2004-2014. The other is the Red plot and the Red box with the equation in it along with the R2 value of 1.0 which are for the first series from block 1965-1974 through block 2004-2016. We can speculate on how this change has happened but it cannot be said that the plot change is not real; however additions data over the next few years will be required to actually prove that something has changed.
In summary the Cyan data set indicates a diminishing effect of CO2 on global temperature for about 54 years and the Red data set represents an increasing effect of CO2 on global temperature for the past 2 years. Since both data sets have an R2 value of 1.00 the trend lines cannot be in question.
Before we get into a possible explanation to the drastic change from the Cyan data to the Red data that occurred in 20014 we need to consider other factors than CO2 on Climate change. The fault that occurred in the work that was done in the 1980’s was in assuming that there was an optimum or constant global temperature and therefore any change that was being observed was from the increasing amount of CO2 in the atmosphere. There may have been correlation but it was never proved that there was causation (high R2 value) between CO2 and global temperatures. With that assumption which limited options we moved from true science into the realm of political science. True science has an open mind and finds relationships that work in matching observations with predictions. Political science changes history and/or facts to match the desires of the politicians. Since the politicians control the money political science is what we get; which means that what we get may not be technically correct.
A decade ago when I started looking at “climate” change the first thing I did was look at geological temperature changes since it is well known that the climate is not a constant; I learned that 52 years ago in my undergrad geology and climatology courses in 1964. The next paragraph explains currently observed patterns in climate related to this subject.
Ignoring the last Ice Age which ended some 11,000 years ago when a good portion of the Northern hemisphere was under miles of ice the following observations give a starting point to any serious study on the subject. First, there is a clear up and down movement in global temperatures with a 1,000 some year cycle going back at least 3,000 to 4,000 years; probably because of the apsidal precession of the earth’s orbit of about 20,000 years for a complete cycle. However about every 10,000 years the seasons are reversed making the winter colder and the summer warmer in the northern hemisphere. 10,000 years from now the seasons will be reversed. Secondly, there are also 60 to 70 year cycles in the Pacific and the Atlantic oceans that are well documented. These are known as the Atlantic MultiDecadal Oscillations (AMO) in the Atlantic and as La Nina and El Nino in the Pacific. Thirdly, we also know that there are greenhouse gases such as carbon dioxide that can affect global temperatures. Lastly the National Academy of Sciences (NAS) estimated that carbon dioxide had a doubling rate of 3.0O Celsius plus or minus 1.5O Celsius in 1979 when there were only two studies available and one for sure and maybe both were not per reviewed.
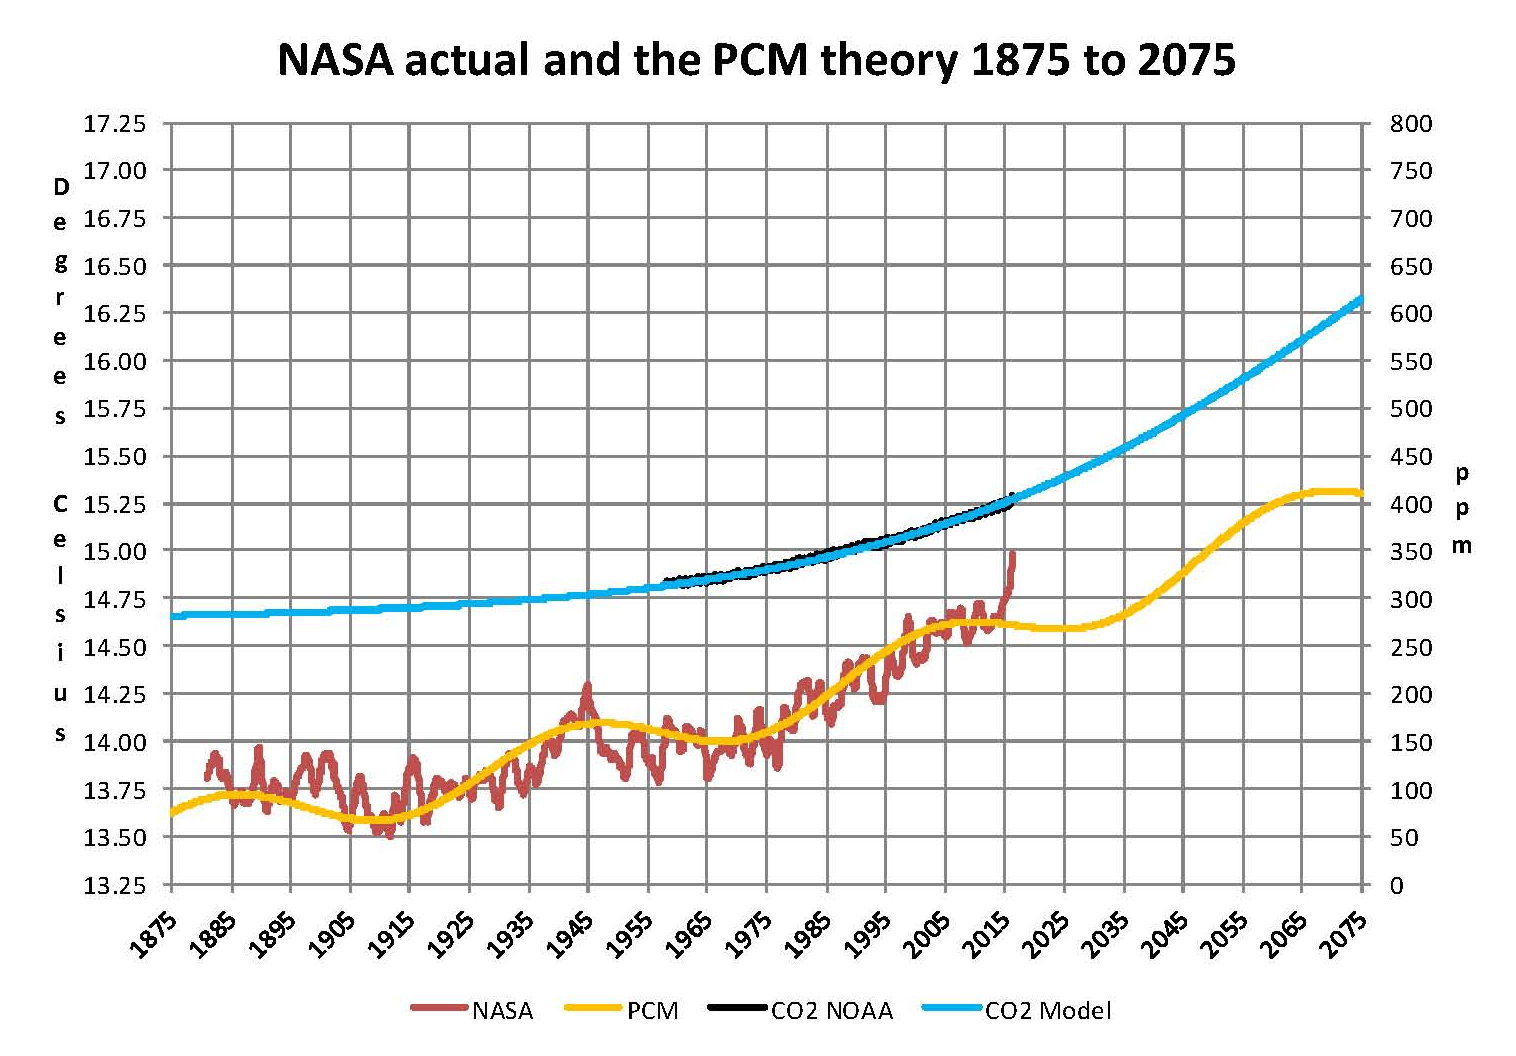
The result of looking objectively at the three possible sources of global temperature changes was a series of equations based on these observations that when added together produced a sinusoidal curve that seemed to follow NASA published temperatures very closely. Since this curve was based on observed temperature patterns it was called a Pattern Climate Model (PCM) which has been described in previous papers and posts on my blog and since it is generated by “equations” many assume it is some form of least squares curve fitting, which it is not. It does seem to be related to ocean currents.
As can be seen in the following Chart the PCM there is a 69.1 year cycle that moves the trend line up and then down a total of 0.29O Celsius and we are now in the downward portion of that trend (-.01491O C per year) which will continue until around ~2035. This short cycle is clearly observed in the raw NASA data in the LOTI table going back to 1880. Then there is a long trend, 1036.7 years with an up and down of 1.65O Celsius (.00396O C per year) also observed in the NASA data. Lastly, there is CO2 adding about .0079 degrees Celsius per year so they all basically wash out at -.0039 O C per year, which matches the current holding pattern we are experiencing. After about 2035 the short cycle will have bottomed and turn up and all three will be on the upswing again. Note: the values shown here are only representative as the actual model uses many more places than what are shown here.
When using the 12 month running average for global temperatures up until 2014 the PCM model was within +/- .01 degrees of what NASA was publishing in their LOTI table since the early 1960’s as shown in the next Chart. Further the back projection of the PCM plot matched historical records and global temperatures going back past the time of Christ. It should also be consider that geologically CO2 levels have reached levels many times that of the current 400 ppm without destroying the planet so the current hysteria over the current small numbers can only be explained by political science not real science.
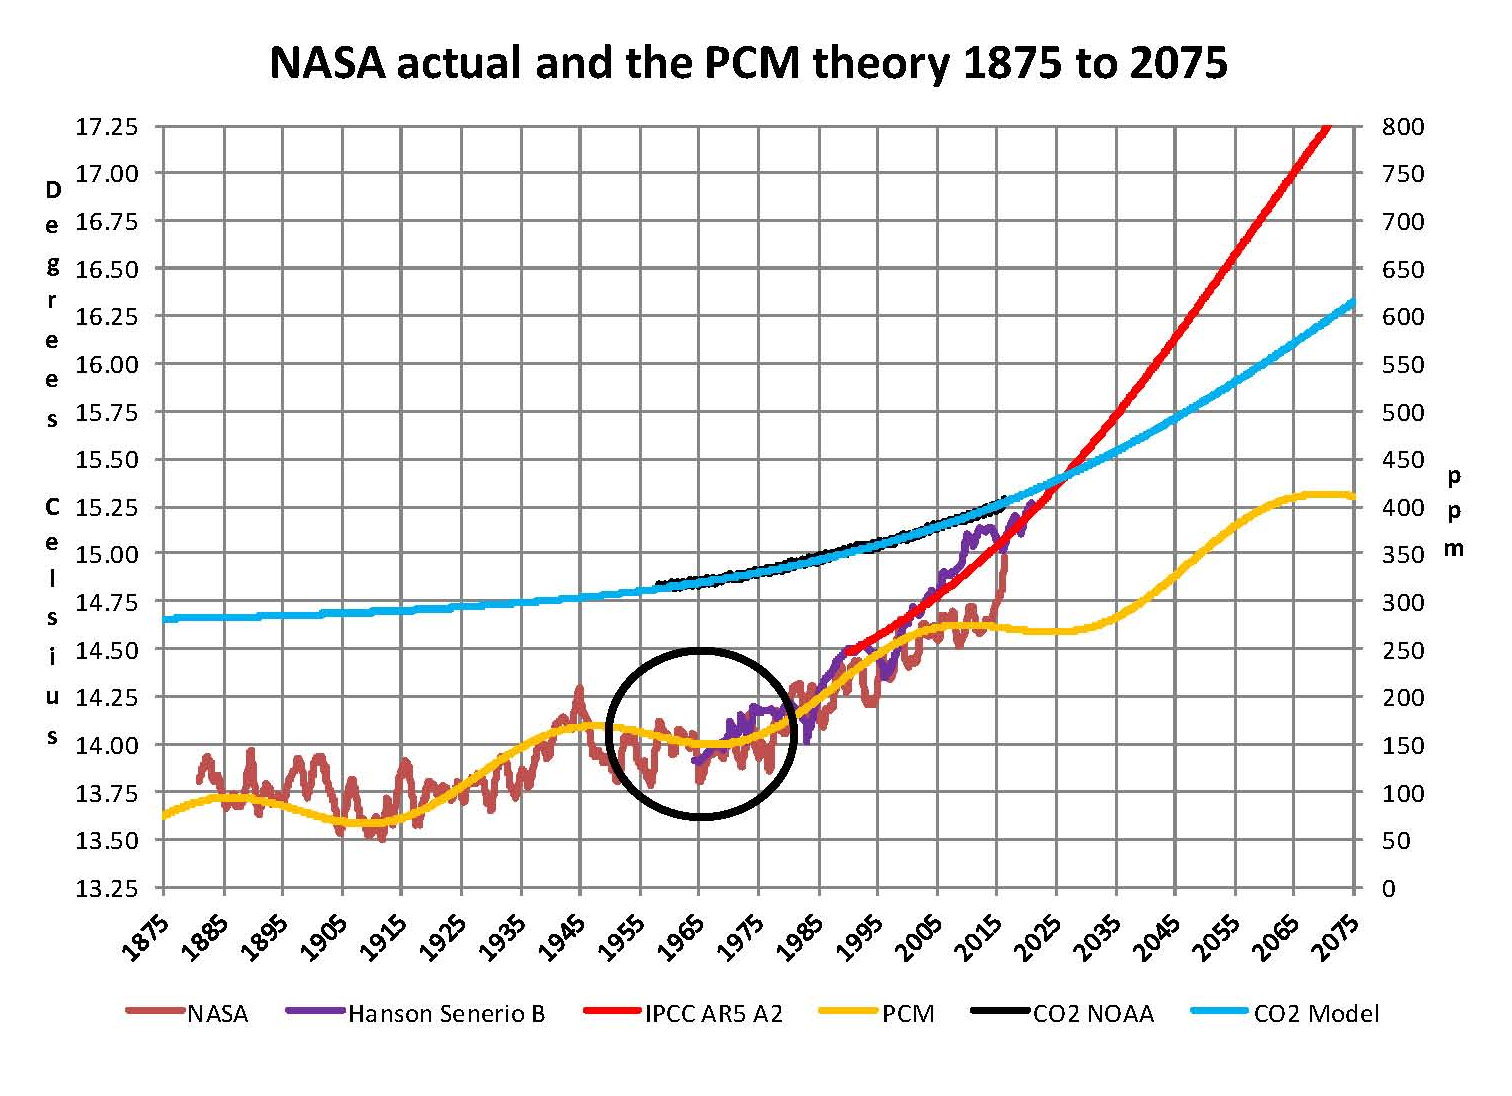
The nest step in this analysis is to put all of the known data and projections into one Chart which will contain: NASA’s table LOTI global temperature estimates, NOAA’s actual CO2 values, the CO2 model projections, the PCM model global temperature plot, Hansen’s Scenario B 1988 global temperature plot, and lastly the IPCC AR5 A2 global temperature plot. With that done we can look at the results and try to make some sense of what is going on with the various arms of the federal government that are promoting that carbon based fuels be eliminated since they are responsible for the global temperature level going up. As previously started when the government pours money into the sciences the sciences respond with technical papers the support the governments views, this is what is call political science verses real science as was done prior to the 1980’s; money talks and BS walks as everyone on the street knows. This Chart views a good overview of the current situation showing all the facts and all the projections.
This Chart contains no manipulation of the data and the only change that was made was to convert the NASA anomalies back to degrees Celsius to make it more readable to lay people. This is only a change in units and has no bearing on the look. A subject not broached here is that of the NASA homogenization process itself and the base period from 1950 to 1980. The portion in the black circle contains the NASA base period of 14.00 degrees Celsius and the reason it’s brought up here is that the Homogenization process causes the global temperatures to move around since the entire data base all the way back to 1880 is recalculated. But since the base has to stay at 14.00 degrees Celsius the program must be set to not allow changes in that period of time. I’m sure the programmers have fun with that. Prior work here has shown how this creates a teeter totter effect with the data plots, some of which have recently been significant.
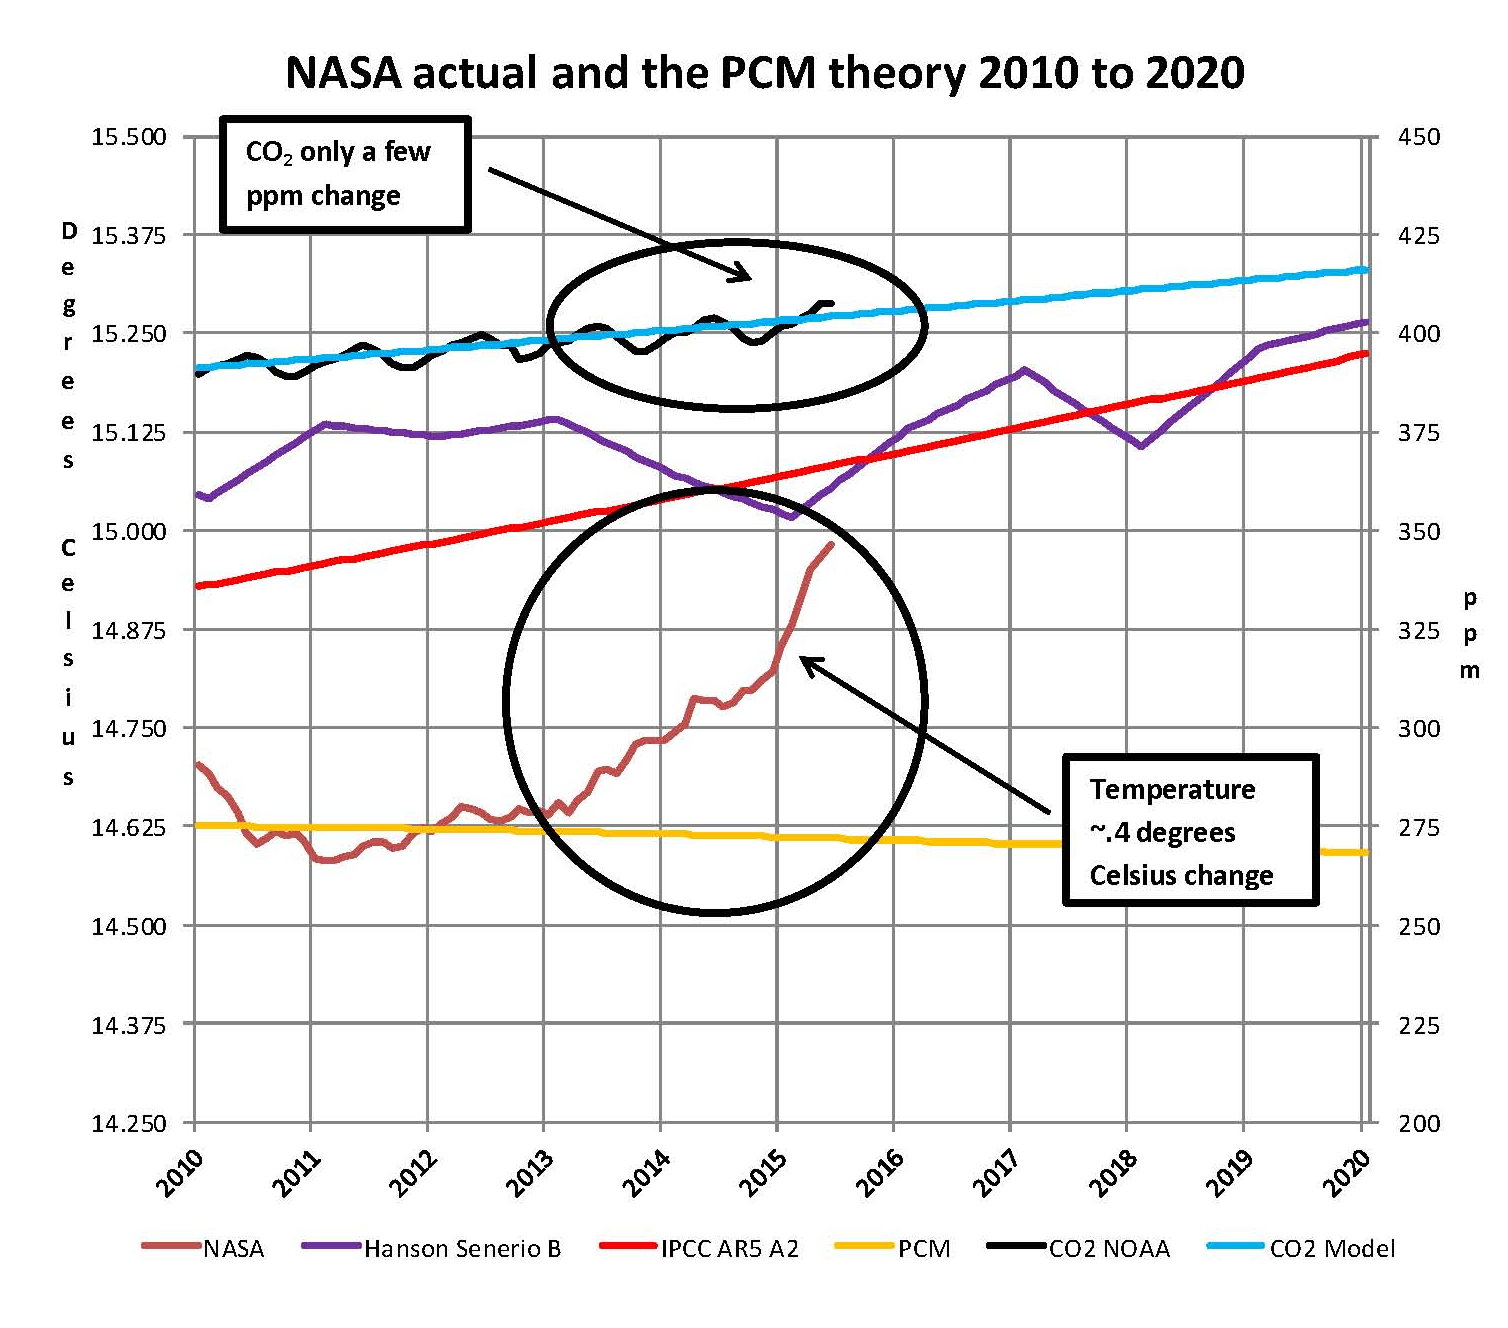
The next Chart will be a look at the period from 2010 to 2020 so we can see the detail of the past few years where a change in CO2 of only a few ppm has caused a major change in the global temperature way beyond anything previously shown in any published NASA data. There are two black ovals on the Chart one at the top of the Chart which is a black oval around the CO2 levels for 2014, 2015 and part of 2016 and it’s very obvious that there has been very little change, maybe 4 ppm or about 1%. Then at the bottom of the Chart is another black oval around the NASA global temperature levels for 2014, 2015 and part of 2016 and its very obvious that there has been a very large change, maybe .33 degrees Celsius or about 2.2%. There has never been such a large increase in temperature from such a small increase in CO2.
By contrast the previous comparable period of the last part of 2010 through 2013 shows about the same for CO2 at 1.1% but only a .2% increase for global temperature, basically flat. Worse it appears that this upward trend will continue as these values are based on a 12 month moving average and the current values being published by NASA have been very high for the past 6 months and so I would expect the NASA plot to be well over 15.00 degrees Celsius within a few months. In looking at the raw data for September 2015 and October 2015 there is a jump of about .25 degrees Celsius that is a very large number for one month and as we have shown here in a previous chart not reasonable at all and a perfect example of political science.
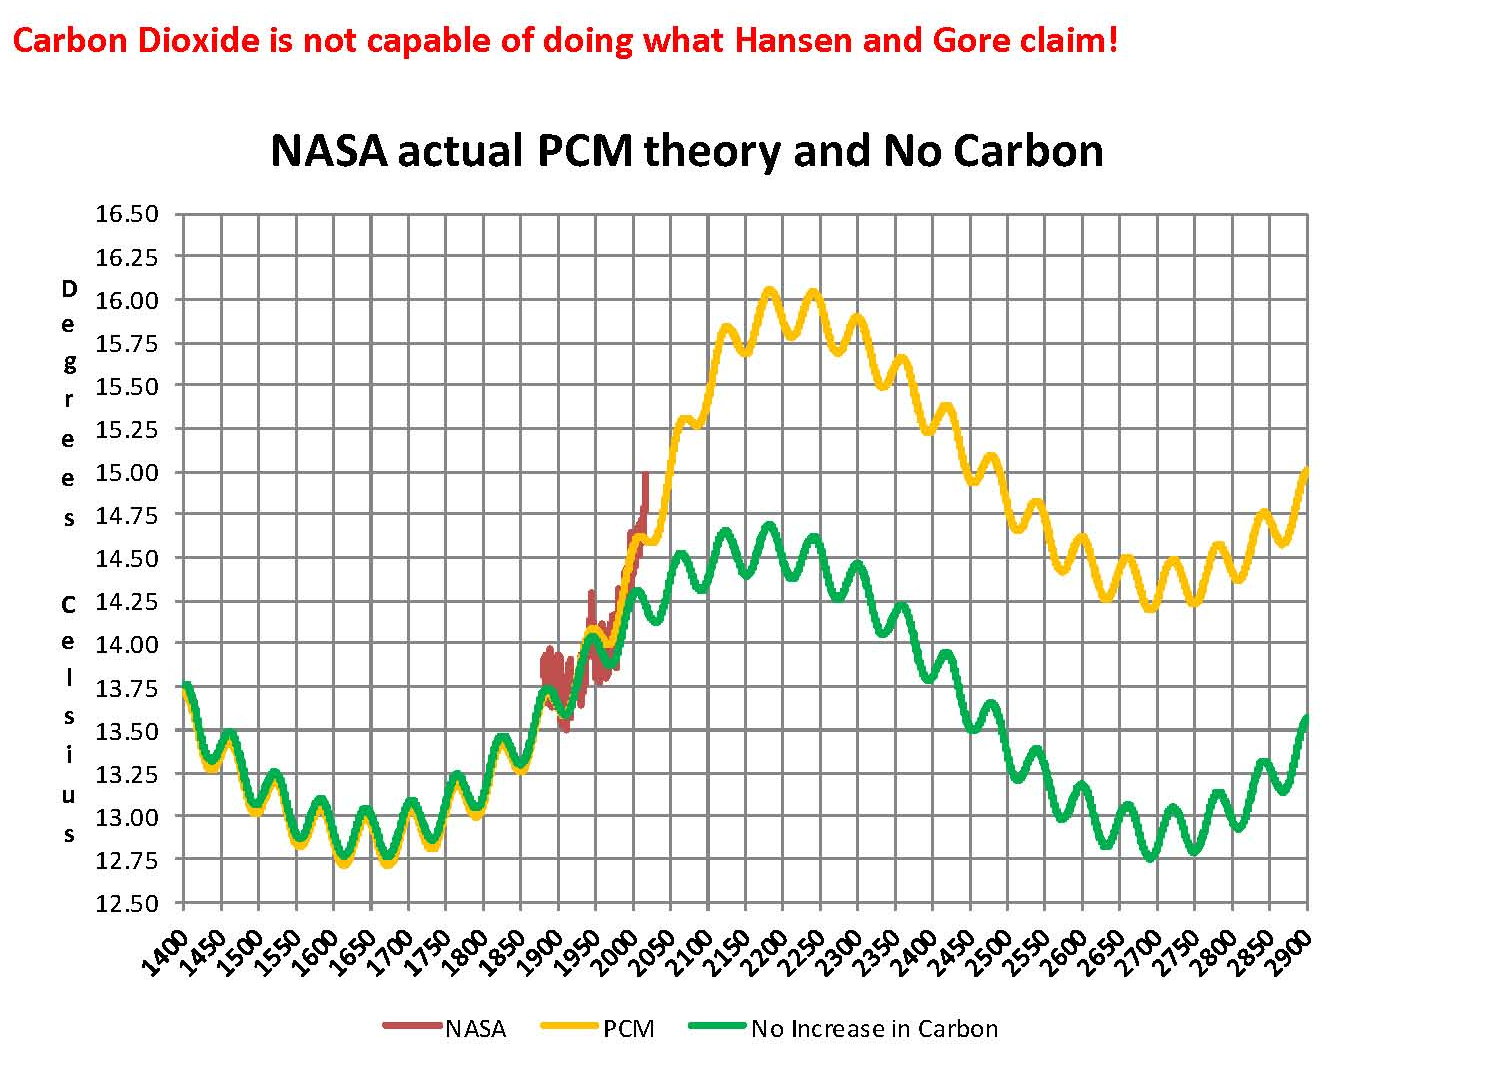
Lastly, the next chart shows what a plot of the PCM model, in yellow, would look like from the year 1400 to the year 2900. The plot matches reasonably well with history and fits the current NASA-GISS table LOTI data, in red, very closely, despite homogenization. I understand that this model is not based on physics but it is also not curve fitting. It’s based on observed reoccurring patterns in the climate. These patterns can be modeled and when they are, you get a plot that works better than any of the IPCC’s GCM’s. If the conditions that create these patterns do not change and CO2 continues to increase to 800 ppm or even 1000 ppm than this model will work into the foreseeable future. 150 years from now global temperatures will peak at around 15.75 to 16.00 degrees C and then will be on the downside of the long cycle for the next 500 years. The overall effect of CO2 reaching levels of 1000 ppm or even higher will be about 1.5 degrees C which is about the same as that of the long cycle. The Green plot on the Chart shows the observed pattern with no change in CO2 from the pre-industrial era of ~280 ppm.
The purpose of this post is to make people aware of the errors inherent in the IPCC models so that they can be corrected.
The Obama administration’s “need” for a binding UN climate treaty with mandated CO2 reductions in Europe and America was achieved as predicted at the COP12 conference in Paris in December 2015. To support this endeavor NASA was forced to show ever increasing global temperatures that will make less and less sense based on observations and satellite data which will all be dismissed or ignored. Within a few years the manipulation will be obvious even to those without knowledge in the subject, but by then it will be to late the damage to the reputation of science will have been done.
Sir Karl Raimund Popper (28 July 1902 – 17 September 1994) was an Austrian and British philosopher and a professor at the London School of Economics. He is considered one of the most influential philosophers for science of the 20th century, and he also wrote extensively on social and political philosophy. The following quotes of his apply to this subject.
If we are uncritical we shall always find what we want: we shall look for, and find, confirmations, and we shall look away from, and not see, whatever might be dangerous to our pet theories.
Whenever a theory appears to you as the only possible one, take this as a sign that you have neither understood the theory nor the problem which it was intended to solve.
… (S)cience is one of the very few human activities — perhaps the only one — in which errors are systematically criticized and fairly often, in time, corrected.
