Armstrong Economics Blog/Armstrong in the Media Re-Posted Jan 7, 2022 by Martin Armstrong
Watch Martin Armstrong’s latest interview with Maria Zeee.
For more Maria Zeee content: https://t.me/zeeemedia

Watch Martin Armstrong’s latest interview with Maria Zeee.
For more Maria Zeee content: https://t.me/zeeemedia
The Bureau of Labor and Statistics (BLS) released the December jobs report today [DATA HERE] showing 199,000 job gains in December, approximately half of what was expected. Most financial pundits are perplexed as the employment rate drops to 3.9%, because many people have dropped out of the labor force. The labor participation rate remains unchanged at 61.9%.

Keep in mind, the November jobs report showed a decline in retail jobs of 29,000, and this report shows that despite November & December being the largest shopping months for holidays, the retail sector jobs were nonexistent.
The issue is what we have discussed here for months, inflation.
The job quits and JOLT turnover reports from last week showed massive numbers of employees quitting their jobs. In part this is pressure from the vaccine mandate (more on that later). However, in the majority what we are seeing is employment decisions based on inflation hitting the labor market.
Additionally, the current BLS report does not have the Omicron “winter of death” employment impact within it. That impact will come in the January report, and it will not be good. But let’s get down to reconciling December jobs data with reality on the ground.
Inflation is chewing up income amid the workforce. This is not debatable, and this is reflected in every opinion poll and economic statistic that has surfaced for the past six months. The BLS report somewhat surprised people in the 0.6% wage gains, and average wage increases are now 4.7% year over year. That should be a good thing. However, inflation at 20 to 50+% on energy, fuel, gasoline and food means a 4.7% growth in wages is a pittance.
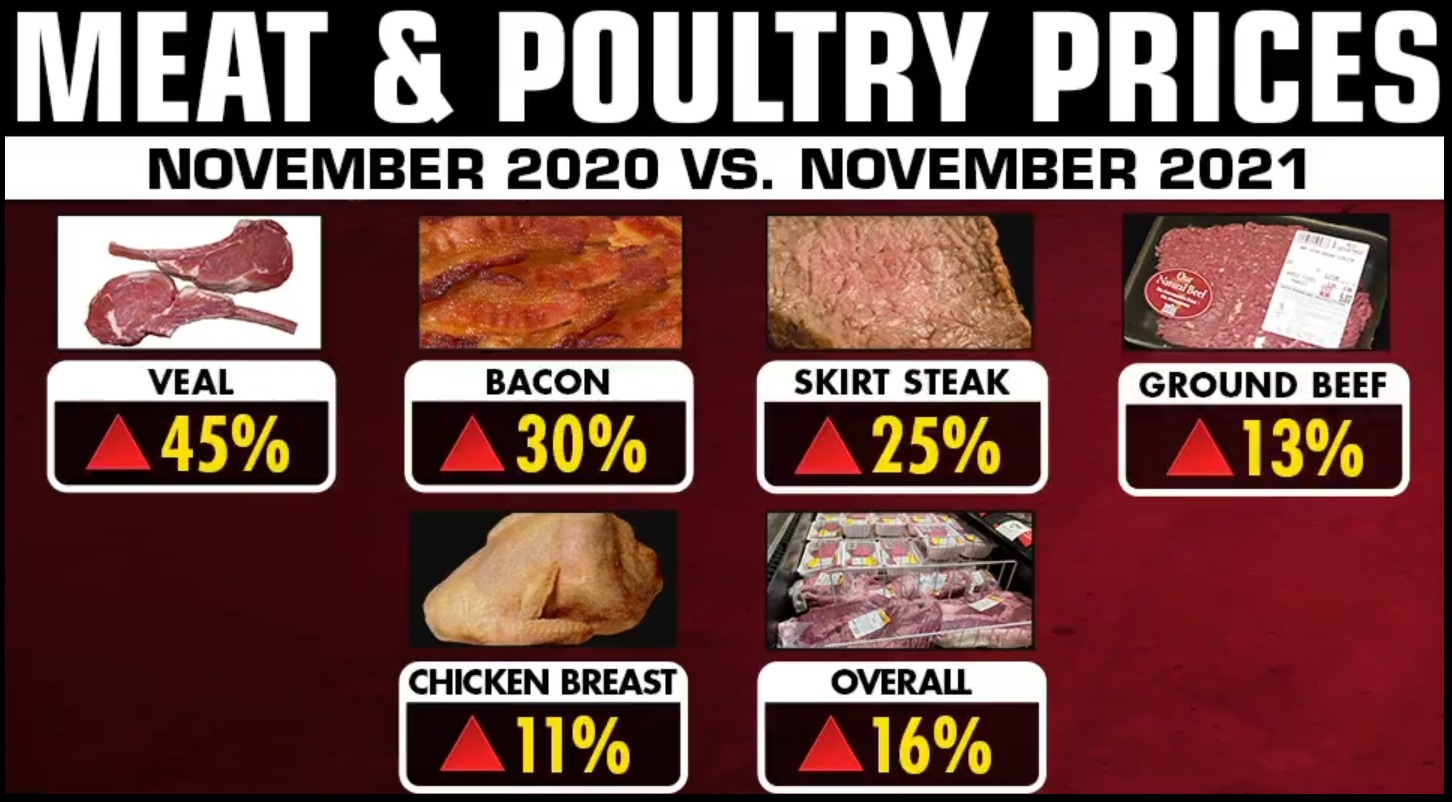
A nickel more for a dollar earned is futile against food store inflation at 20 to 40% average price increases. We have never seen food, fuel and energy increase in price at such a rate and in such a short period of time (6 months). That real price situation is not going to improve. Economists call this “sticky” inflation, but that catch phrase does not adequately explain the foreboding issue of how damaging this is.
As this inflation relates to jobs and employment, the situation is obvious. Pundits pretend not to know things, but the two issues are connected. Ordinary workers need much higher wages to compensate for massive increases in housing costs, energy costs, gas prices and, more importantly, food prices.
The fastest way to get a quick pay increase to compensate for fast and furious inflation is to switch jobs and start the new job, in the same sector, at a higher wage. That is what we are seeing with the overall turnover rate, quits report, and larger employment data. They are all connected.
Beyond inflation, you can see from this BLS data that things are tenuous in the economy. The November retail employment figure (-29,000) was a big red flag that everyone ignored. Additionally, holiday sales at +8% when the prices are +15% or more, means that people were buying less stuff at higher prices. Overall, less stuff (units sold) was purchased.
The December BLS data shows us actual hours worked in manufacturing declined (0.1 hrs), and overtime declined (0.1 hrs). Remember, the third quarter productivity rate dropped a stunning 5% overall.
Big Picture = less stuff is in demand, less stuff is being made, and less hours are being used; however, the amount of available labor in the creation of durable goods still exceeds the demand for those durable goods, hence productivity has dropped.
Construction employment is modest at +22,000 in December, but it is lower than the prior three months average of +38,000. Some of this is seasonal, but the trendline is much softer than a customary 3.9% total unemployment economy would show. Again, more evidence of weakness in the structural economy (no pun intended).
Two-thirds of the U.S. economy overall is dependent on people buying stuff. When people cannot afford to buy stuff, because their disposable income has been wiped out by inflation, things in the data start to show the wobbly wheels of a tenuous economic train.
When the number of people quitting their jobs, or switching jobs, is twice the number of people getting officially hired in the BLS jobs report, then you know things are sketchy.
Let me repeat the issue and try to emphasize the problem. It’s the inflation, stupid.
We have a looming problem that does not reconcile with 3.9% unemployment. The pundits are perplexed.
The confusion is because NO ECONOMIC data has ever shown this level of inflation in such a short period of time. There are no models. There is no experience in this situation. This is not like the 1970’s where oil prices were the direct and primary cause. This is different, because we are experiencing shortages and price increases specifically due to policy.
Energy policy is killing us (oil and natural gas prices). Legislative policy is killing us (spending and bailouts). Monetary policy is killing us (cheap lending, quantitative easing, devaluation). All of this is causing massive inflation at a level we have never seen in history, and it’s on everything.
Then we throw in a vaccine mandate, and perpetual fear of a virus that hits both the demand side and the employment side simultaneously…. and, well, here you go. The disruptions inside the economy are like deep cuts, thousands of them, and they are not accidental.
Many, if not most, of these disruptions are being done at the altar of climate change and the Green New Deal.
COVID-19 mitigation and mandates only make this worse.
The disruptions in the supply chain are a direct result of policy. Now, we have to prepare for inflation AND shortages. This will not get better in 2022.
Prepare your family accordingly. I believe those of you reading this article represent the people best prepared for what is about to happen.


Bill Gates did not become one of the richest men in the world by investing in stocks. I am not recommending any of these particular stocks, but I do want to point out where Bill Gates’ interests lie. Notice how his foundation is invested in what many would consider COVID-sensitive equities such as Caterpillar and FedEx. Nearly half (45%) of his portfolio under his foundation is invested in his former buddy Warren Buffett’s company, Berkshire Hathaway. Warren Buffett subtly distanced himself from Bill Gates last year and resigned from the Bill and Melinda Gates Foundation after 15 years.

Before I share Bill’s portfolio, I must mention that Warren Buffett is now obligated to provide shares to the Gates Foundation. In June 2006, Buffett drafted the following letter:
"I greatly admire what the Bill & Melinda Gates Foundation (“BMG”) is accomplishing and want to materially expand its future capabilities. Accordingly, by this letter, I am irrevocably committing to make annual gifts of Berkshire Hathaway “B” shares throughout my lifetime for the benefit of BMG. The first year’s gift will permit an increase in BMG’s annual giving of about $1.5 billion. In the future, I expect the value of my annual gifts to trend higher in an irregular but eventually substantial manner.

Here are the mechanics: Ten million B shares will be earmarked by me for BMG contributions. (I currently own only A shares but will soon convert a number of these to B.) In July of every year, or such later date as you elect, 5% of the balance of the earmarked shares will be contributed either directly to BMG or to a charitable intermediary that will hold the earmarked shares for the benefit of BMG. To illustrate, in 2006, 500,000 shares will be contributed. In 2007, 475,000 shares (5% of the 9,500,000 remaining after the 2006 contribution) will be contributed and thereafter 5% fewer shares will be contributed each year.

There are three conditions to this lifetime pledge. First, at least one of you must remain alive and active in the policy-setting and administration of BMG. Second, BMG (or any intermediary) must continue to satisfy legal requirements qualifying my gifts as charitable and not subject to gift or other taxes. And, finally, the value of my annual gift must be fully additive to the spending of at least 5% of the Foundation’s net assets. I expect there to be a ramp-up period of two years during which this condition will not apply. But beginning in calendar 2009, BMG’s annual giving must be at least equal to the value of my previous year’s gift plus 5% of BMG’s net assets. If this amount is exceeded in any year, however, the excess can be carried forward and be offset against a shortfall in subsequent years. Similarly a shortfall in a given year can be made up in the following year."
Buffett followed the letter by stating that in the event of his death, he expects contributions to the foundation to continue. “I will soon write a new will that will provide for a continuance of this commitment,” he penned. Although Buffett resigned last year, he also gifted the foundation $3.2 billion. However, that is based on the formula presented in his letter above from 2006 as Berkshire shares have spiked. Buffett knows that he will receive a tax incentive for donating money to the foundation as it could not possibly spend it all. Buffett says he received 40 cents in tax benefits for every $1,000 donated, but tax experts seem to believe that is misleading. Since he is avoiding capital gains and estate taxes that could hover around 40%, some experts believe he is saving around $400 to $740 on every $1,000 he gives away.
Here is a list from 2021 of the foundation’s portfolio:
[REPOST by request with note: We will get the December data in about a week from now]
You might remember: October 13, 2021, Joe Biden delivered widely carried remarks about specific actions his administration was taking to increase operations at the Port of Los Angeles (POLA) and the Port of Long Beach (POLB).

Here we take a closer look at the claims since the original announcement, and then highlight the actual results from the ports. The port operations are actually doing worse today than they were in October. They are less efficient, less productive and have handled less freight in November than they did in October. The factual results are exactly the opposite of the administration claims.
The October 13, 2021, White House fact sheet is HERE, “announcing a series of public and private commitments to move more goods faster, and strengthen the resiliency of our supply chains, by moving towards 24/7 operations at the Ports of Los Angeles and Long Beach.” On November 17, 2021, the White House gave an update, “Recent Progress at Our Ports: Moving Cargo and Filling Shelves” and claiming the increased hours of operations were delivering on the White House expectations of increased productivity and offloading capacity.
Throughout these past 11 weeks, Joe Biden, Kamala Harris and Transportation secretary Pete Buttigieg have been claiming their supply chain task force has been successful in generating exceptional results. They claimed changing the hours of operations increased the port capacity, specifically targeting the ports of Los Angeles and Long Beach. However, if we look at the actual records from both ports, we find exactly the opposite:
Ports record their data in 20-foot equivalent units, or TEU’s. The Port of Los Angeles data shows they handled 468,713 import containers in October, and 405,309 in November. That’s a decrease of 63,404 import containers from the prior month. [DATA LINK]
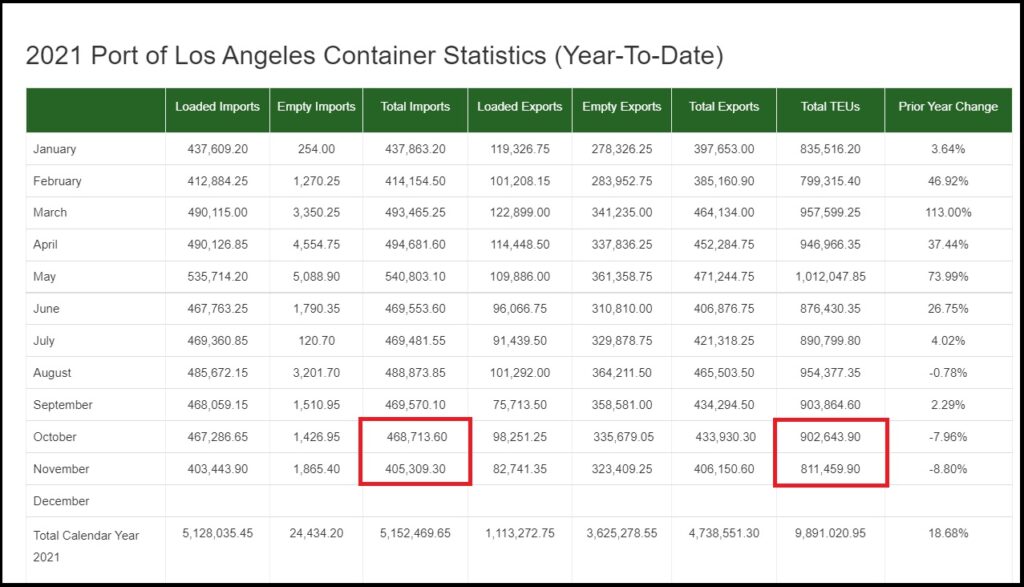
The Port of Los Angeles is the largest port of the two. The POLA also showed a decrease in Total TEU’s handled (import and export). As you can see above, the total TEU’s handled in October was 902,643. The total TEU’s handled in November was 811,459.
That’s a decrease of 91,184 total containers handled. This is the exact opposite of what Biden, Harris and Buttigieg are claiming.
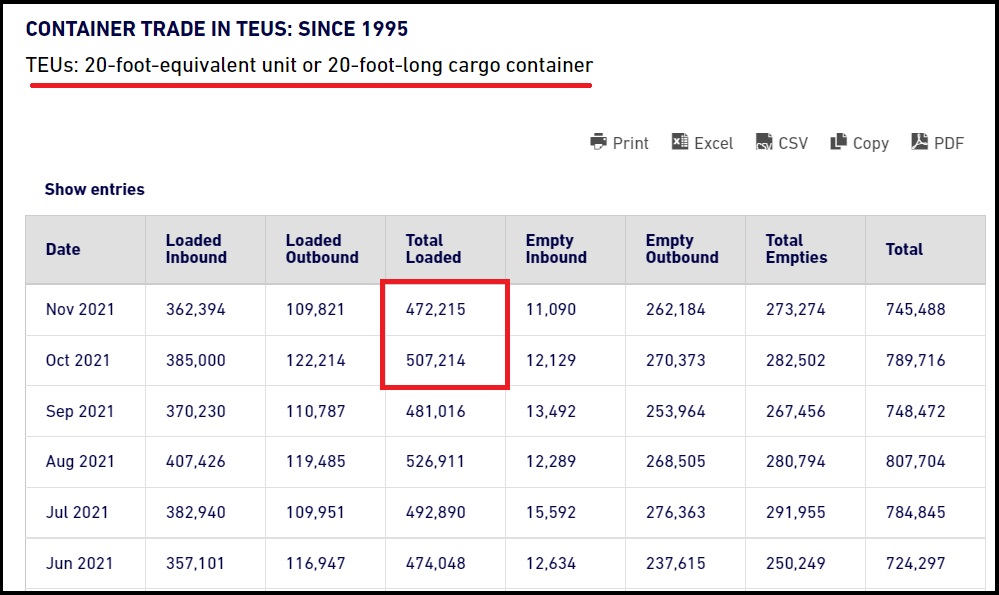
♦ Next, we look at the Port of Long Beach (POLB). [DATA HERE]
Again, we note the Total Loaded containers (carrying cargo) in October 2021, the month of the White House announcement, was 507, 214. In the full month of November 2021, the total of loaded containers handled was 472,215. That’s a decrease of 34,999 containers.
.
There is a disconnect between what the White House, Joe Biden, Kamala Harris and Pete Buttigieg are saying, and the actual results of what is taking place at the Port of Long Beach and Port of Los Angeles. They claim hours of operation have expanded to increase capacity, yet fewer containers are being handled?
Perhaps the administration did not expect anyone to check when they claimed on November 29th:
“The Ports of Los Angeles and Long Beach—which handle 40 percent of the country’s containerized imports—continue to show improvement in moving containers out of the docks and into warehouses.” [White House link]
Despite what the White House Supply Chain Disruption Taskforce is claiming, the actual records from the ports do not concur. Someone is clearly lying, and/or not expecting anyone to check.
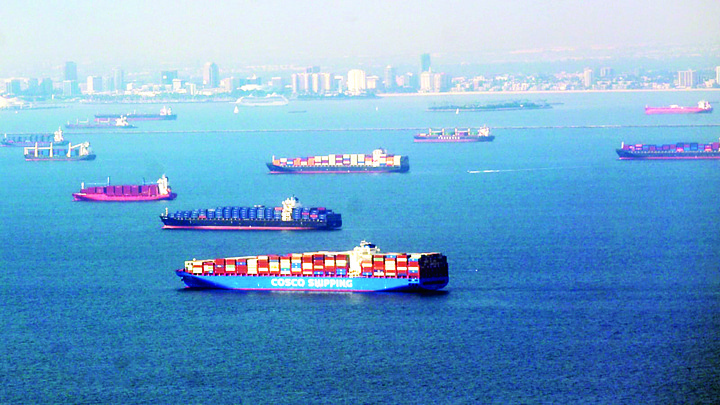
There’s a strong possibility they did not expect anyone to notice, because part of their logistical scheme involved telling the ship operators to wait further offshore so that it would give the illusion of less congestion near port:
CALIFORNIA – […] “Starting Nov. 16, ships waiting to anchor at the ports of Los Angeles and Long Beach will have to wait for a green light about 150 miles from the coast, the Pacific Merchant Shipping Assn., the Pacific Maritime Assn. and the Marine Exchange of Southern California said in a statement Thursday. That compares with 20 nautical miles (23 miles) now. North- and southbound vessels must remain more than 50 miles from the state’s coastline.” (read more)
Apparently, what the White House taskforce did was to move the line of awaiting cargo ships further offshore to make them less visible. Then, it appears, the White House just started making up talking points about productivity at the ports increasing and capacities expanding; neither claim is based on facts that surface in the actual operations of the ports.
The outcomes speak for themselves. Both the Port of Los Angeles and Port of Long Beach handled less cargo and fewer containers in the first full month of the “new expanded operations” than they did in the previous month when the expanded operations were announced.
In order to remind ourselves how big an issue this was for the White House, watch the Biden announcement from October 13, 2021, again.
It looks like the media need to start asking questions….
Oh wait, never mind.


The post-pandemic real estate frenzy led to mortgage lenders issuing more money last year than ever before. According to records, mortgage lenders in the US issued $1.6 trillion in purchase loans in 2021, an increase from $1.48 trillion in 2020. The only time mortgage loans came close to this level was in 2005, when lenders issued $1.51 trillion in loans.
Refinances declined to $2.3 trillion in 2021 from $2.6 trillion in 2020. Total originations also fell from their 2020 peak of $4.1 trillion to $3.9 trillion, with many homeowners already taking advantage of low rates. The markets are anticipating three rate hikes from the Federal Reserve this year, which would cause an increase in mortgage rates.
Mortgages are low, but home prices are at an all-time high as demand has not waned. The Federal Reserve Bank of Atlanta notes that mortgages are now less affordable relative to income than any period since 2008 during the subprime mortgage crisis. Home prices typically stay in line with inflation, but the 18.4% annual increase in average home prices recorded this past October shows that the market is indeed inflated.
The Ports of Los Angeles and Long Beach, the two most active ports in the US, will resume container dwelling fees as of today. The moratorium went into effect on October 25 as the California ports became a crowded parking lot for cargo ships. Port officials claim that this move has created a 41% decline in aging cargo on the docks.
The container dwelling fee charges carriers $100 per import container. Containers scheduled to arrive by truck have nine days before the fee is implemented, while those arriving by rail have only six days. The fee rises by an additional $100 per container for each day the ship sits stagnant.
Before the pandemic, dwelling periods for containers took around four days for local truck delivery and two days for rail delivery. It is now extremely common for ships to await docking for well over a week, at no fault of their own. There have been numerous reports of ships simply turning around as they could not offload.
If eliminating this fee actually caused a 41% decrease in aging cargo, then it seems premature to end the moratorium as the supply chain crisis is ongoing.

The US Trade deficit widened 17.5% in November, setting a new record. According to the US Commerce Department, the trade gap in goods increased from $83.2 billion in October to $97.8 billion in November. The number surpassed September’s posting of $97 billion.
Exports declined by 2.1%; however, imports are rising. The US imported $252.4 billion this November, a 4.7% MoM increase, with autos, industrial supplies, consumer goods, and food all experiencing notable gains. In addition, retail inventories rose 2%, while wholesale inventories rose 1.2%.
The US trade deficit has been high for years, and the gap continued to expand throughout 2021. January 2021 started off the new year by shattering the last deficit record posted in 2006. High trade deficits hurt America’s GDP standing, although the economy has been recovering faster than other developed nations.

COMMENT T FROM ITALY: Hi, in the blog “the war on cash and the dollar” you say as you said
other times that salvation is only in the paper dollar. Here in Italy
if I have paper dollars I have the problem that I can NOT spend them,
I can NOT use them. I agree that it pays to accumulate paper dollars
and I would like to, I know you are right. But here how can I use them
for a living?
Thank you!
REPLY: Yes, you are correct. On a day-to-day basis, you have to use a local currency that is moving toward digital. Paper dollars are being hoarded, not spent except in rare transactions. The same is taking place buying collectibles, real estate, and equities.
What has also been taking place behind the curtain from reliable sources is that European governments have been lobbying the Biden Administration to clamp down on Europeans buying US real estate. The Biden Administration is putting in restrictions to track money moving into real estate. That is being justified with money laundering. In Miami, there has been a major influx of foreign capital moving into real estate and this is being characterized as drug money from South America. In truth, much has been coming from Europe.

I have warned that Europe is the epic center for the decline and fall of Western Culture and economic strength. While the US has not yet joined Europe, the Democrats are licking their lips and trying desperately to figure out how to kill cash forcing everything to be digital in search of cash. In Europe, 18 EU countries are now restricting the use of cash and they are desperately trying to terminate cash all for control and taxes. Now it is just presumed that paying in cash means you are engaged in money laundering for that definition has been expanded to just tax avoidance.
Once upon a time, Belgium had an upper limit of €15,000 for transactions in cash. In 2012, they lowered that to €5,000, and then in 2014, they brought it down to €3,000. Bulgaria has outlawed cash payments of around €5,100 euros (10,000 Bulgarian levs) since 2016. A proposed law that has been pending since 2017 will lower that to just €500. The central bank informed the politicians it would not comply with such a low limit. The politicians even went as far as the use of the 500 euro note would have been a punishable criminal offense.
Over in Denmark since July 1, 2021, any payment of up to about 2,700 euros (20,000 Danish kroner [DKK]) is allowed whereas the previous limit was DKK 50,000 since 2013. Prior to that, the limit was from 2006 was DKK 100,000 and once more they claim this is all about combatting money laundering and the financing of terrorism.
France, the origin of communist theory, has been trying to outlaw cash for years. Today, a cash payment limitation stands at €1,000 since 2015. That was lowered from a limitation of €3,000 which was implemented in 2010. In Greece, as of the end of 2016, the upper limit on cash was just €500. Here we have a government that was as corrupt as it could be and screwed the nation by entering a conspiracy with Goldman Sachs to manipulate their debt to enter the Eurozone. Hence, the government wanted to lower the limit to €300 which would have seriously disrupted tourism and even the ECB objected. The government has imposed laws whereby Greek taxpayers must prove that they spend at least 30% of their taxable income in electronic form. If you failed to prove that 30% of your income is spent by debit/credit card, you will have to pay a penalty tax of 22% on the difference.
In Italy, the government imposed a limit on cash transactions of €2000. However, as of January 1, 2022, the government has lowered that to €1,000 proving that money laundering is no longer drugs, but not paying taxes. Throughout Europe, these trends reveal that the pretend politicians who are supposed to “represent” the people, regard the people as criminals. They have used terrorism as the justification to go after every person in the country. This is why governments have been pushing for 5G to ensure the extinction of cash and to make all payment systems instantaneous.
In the Netherlands, the government moved to introduce a cash limit of €3,000 also claiming that this was intended to be “measures to combat money laundering and terrorist financing more effectively”. Spain introduced a law in 2012 on the prevention of tax fraud in Article 7 which forbids making cash purchases of €2,500 or more. That was lowered to €1,000 as of November 2021.
In Germany, there is no limit on cash payments for the purchase of goods. However, consumers who want to pay amounts that are greater than 10,000 Euro in cash, have to show their ID card and the merchant/vendor must document their name, place of birth, date of birth, and home address as well as their nationality.

Using terrorism, all European governments are hunting cash and PRESUME people who pay in cash are engaged in money laundering they now define as simply not paying taxes. I have been warning that part of the strength behind the dollar is the fact that (1) it has never been canceled, but (2) it is the cash reserve of the world with 70% of paper dollars circulating outside the United States as the hedge against their own governments.
You might remember on October 13, 2021, Joe Biden delivered widely carried remarks about specific actions his administration was taking to increase operations at the Port of Los Angeles (POLA) and the Port of Long Beach (POLB).
Here we take a closer look at the claims since the original announcement, and then highlight the actual results from the ports. The port operations are actually doing worse today than they were in October. They are less efficient, less productive and have offloaded less freight in November than they did in October. The factual results are exactly the opposite of the administration claims.
The October 13, 2021, White House fact sheet is HERE, “announcing a series of public and private commitments to move more goods faster, and strengthen the resiliency of our supply chains, by moving towards 24/7 operations at the Ports of Los Angeles and Long Beach.” On November 17, 2021, the White House gave an update, “Recent Progress at Our Ports: Moving Cargo and Filling Shelves” and claiming the increased hours of operations were delivering on the White House expectations of increased productivity and offloading capacity.
Throughout these past 11 weeks, Joe Biden, Kamala Harris and Transportation secretary Pete Buttigieg have been claiming their supply chain task force has been successful in generating exceptional results and removing the backlog at the ports, specifically the ports of Los Angeles and Long Beach. However, if we look at the actual records from both ports, we find exactly the opposite:
Ports record their data in 20-foot equivalent units, or TEU’s. The Port of Los Angeles data shows they handled 468,713 import containers in October, and 405,309 in November. That’s a decrease of 63,404 import containers from the prior month. [DATA LINK]
The Port of Los Angeles is the largest port of the two. The POLA also showed a decrease in Total TEU’s handled (import and export). As you can see above, the total TEU’s handled in October was 902,643. The total TEU’s handled in November was 811,459.
That’s a decrease of 91,184 total containers handled. This is the exact opposite of what Biden, Harris and Buttigieg are claiming.
Next, we look at the Port of Long Beach (POLB). [DATA HERE]
Again, we note the Total Loaded containers (carrying cargo) in October 2020, the month of the White House announcement, was 507, 214. In the full month of November 2020, the total of loaded containers handled was 472,215. That’s a decrease of 34,999 containers.
.
There is a disconnect between what the White House, Joe Biden, Kamala Harris and Pete Buttigieg are saying, and the actual results of what is taking place at the Port of Long Beach and Port of Los Angeles.
Perhaps the administration did not expect anyone to check when they claimed on November 29th:
“The Ports of Los Angeles and Long Beach—which handle 40 percent of the country’s containerized imports—continue to show improvement in moving containers out of the docks and into warehouses.” [White House link]
Despite what the White House Supply Chain Disruption Taskforce is claiming, the actual records from the ports do not concur. Someone is clearly lying, and/or not expecting anyone to check.
There’s a strong possibility they did not expect anyone to notice, because part of their logistical scheme involved telling the ship operators to wait further offshore so that it would give the illusion of less congestion near port:
CALIFORNIA – […] “Starting Nov. 16, ships waiting to anchor at the ports of Los Angeles and Long Beach will have to wait for a green light about 150 miles from the coast, the Pacific Merchant Shipping Assn., the Pacific Maritime Assn. and the Marine Exchange of Southern California said in a statement Thursday. That compares with 20 nautical miles (23 miles) now. North- and southbound vessels must remain more than 50 miles from the state’s coastline.” (read more)
Apparently, what the White House taskforce did was to move the line of awaiting cargo ships further offshore to make them less visible. Then, it appears, the White House just started making up talking points about productivity at the ports increasing and capacities expanding; neither claim is based on facts that surface in the actual operations of the ports.
The outcomes speak for themselves. Both the Port of Los Angeles and Port of Long Beach handled less cargo in the first full month of the “new expanded operations” than they did in the previous month when the expanded operations were announced.
In order to remind ourselves how big an issue this was for the White House, watch the Biden announcement from October 13, 2020, again.
It looks like the media need to start asking questions….
Oh wait, never mind.
I have created this site to help people have fun in the kitchen. I write about enjoying life both in and out of my kitchen. Life is short! Make the most of it and enjoy!
De Oppresso Liber
A group of Americans united by our commitment to Freedom, Constitutional Governance, and Civic Duty.
Share the truth at whatever cost.
De Oppresso Liber
Uncensored updates on world events, economics, the environment and medicine
De Oppresso Liber
This is a library of News Events not reported by the Main Stream Media documenting & connecting the dots on How the Obama Marxist Liberal agenda is destroying America
Australia's Front Line | Since 2011
See what War is like and how it affects our Warriors
Nwo News, End Time, Deep State, World News, No Fake News
De Oppresso Liber
Politics | Talk | Opinion - Contact Info: stellasplace@wowway.com
Exposition and Encouragement
The Physician Wellness Movement and Illegitimate Authority: The Need for Revolt and Reconstruction
Real Estate Lending
