A More Sophisticated Version Of AOC


A Technical Study in the Relationships of Solar Flux, Water, Carbon Dioxide and Global Temperatures, March 2019


From the attached report on climate change for March 2019 we have the two charts showing how much has the global temperature actually gone up since we started to measure CO2 in the atmosphere? To show this graphically Chart 8 was constructed by plotting CO2 as a percent increase from when it was first measured in 1958, the Black plot, the scale is on the left and it shows CO2 going up about 30.0% from 1958 to February of 2019. That is a very large change as anyone would have to agree.  Now how about temperature, well when we look at the percentage change in temperature from 1958, using Kelvin (which does measure the change in heat), we find that the changes in global temperature (heat) are almost un-measurable. The scale on the right side had to be expanded 10 times (the range is 40 % on the left and 4% on the right) to be able to see the plot in the same chart in any detail. The red plot, starting in 1958, shows that the thermal energy in the earth’s atmosphere increased by .30%; while CO2 has increased by 30.0% which is 100 times that of the increase in temperature. So is there really a meaningful link between them that would give as a major problem? The numbers tell us no there isn’t.

The next chart is Chart 8a which is the same as Chart 8 except for the scales which are the same for both CO2 and Temperature. As you see the increase in energy, heat, is not visually observably in this chart hence the need for the previous chart 8 to show the minuscule increase in thermal energy shown by NASA in relationship to the change in CO2. Based to these trends, determined by excel not me, in 2028 CO2 will be 428 ppm and temperatures will be 15.0o Celsius and in 2038 CO2 will be 458 ppm and temperatures will be 15.6O Celsius. This is what the data shows no matter what the reasons are, so I have no idea how the IPCC gets to predict that the world will end in ten or twenty years.

The full 37 page report explains how these charts were developed and why using NASA and NOAA data are used with out change to prove that The New Green Deal is not required and any attempt to compliment that plan will be a world wide disaster.

Click on the link below for the full report that you can download.

BLACKBODY TEMPERATURE 2019-03

Are Two-Tier Monetary Systems a Possible Tool?


QUESTION: Mr. Armstrong; It seems few people even understand that there have been two-tier monetary systems. Do you think this can be a possible tool in the currency crisis you are forecasting for 2021?

Thank you;

Looking forward to Rome and meeting Mr, Farage as well

PC

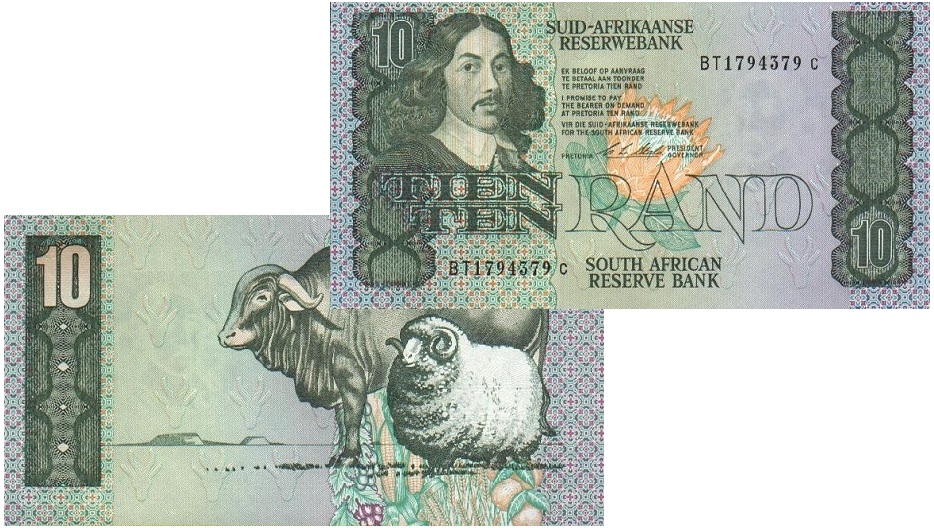
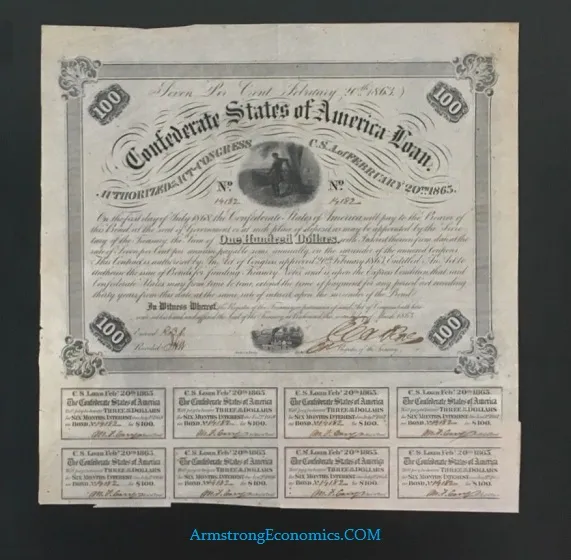
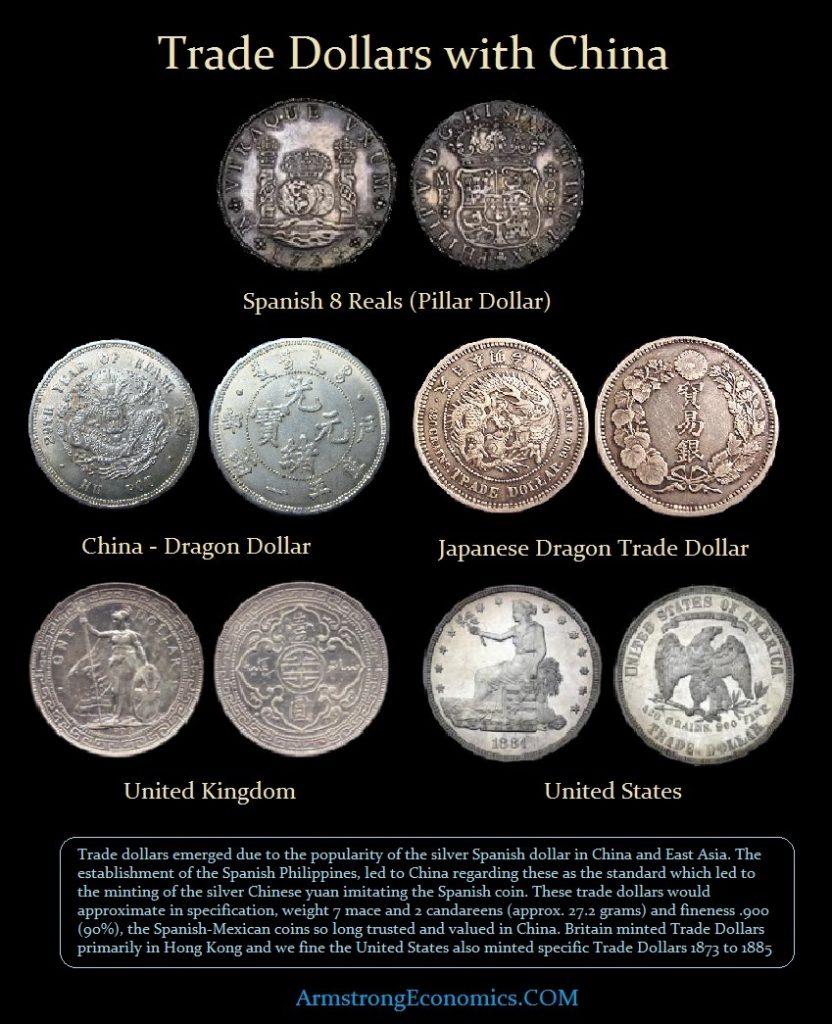
ANSWER: Various countries used to mint trade dollars in silver with different weights for external trade with China. That was a two-tier monetary system for trade during the 19th century. But there have been instances where there were two separate currencies that were also used as capital controls to isolate the domestic economy from the external international capital flows. This was the case with South Africa.

An important example of an official deliberate two-tier monetary system is the modern monetary history of South Africa. Until the late 1960s, South Africa had a fixed exchange rate for its currency. The rand was pegged to major foreign currencies, as was the case under the Bretton Woods system.

It was during 1979 when the South African government switched to a system that formally expressed parity against the dollar. The value of the rand followed changes in the balance of payments and moved roughly with sterling and other weaker currencies until 1985 when the dollar soared and the birth of the Plaza Accord took place.

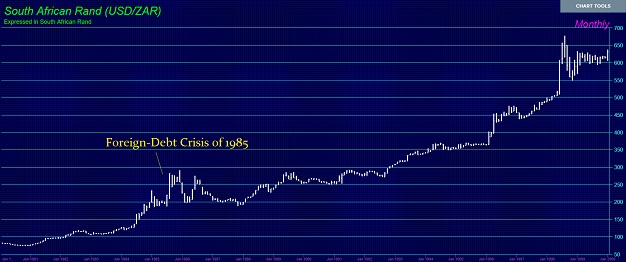
The foreign debt crisis of 1985 caused the rand to depreciate at a spectacular rate and the dollar rose in value. The rand fell to an all-time low of less than 40 cents to the US$. The rand recovered somewhat in 1987, reaching 43 cents, but it declined steadily thereafter into 1998. The rand collapsed to about 26 cents against the US$ in late 1995. Between February 1, 1996 and May 1, 1996, the rand lost roughly 16% of its exchange value, falling from R3.7 to R4.33 = US$1, or a value of about 23 cents to the US$.

The government realized that its domestic policy objectives were incompatible with international investment. They then created a parallel currency to act as a two-tier currency unit they named the “Financial Rand.” This hybrid currency was used exclusively for the movement of nonresident capital during the 1980s and early 1990s. The Financial Rand developed out of currency-exchange controls instituted in the early 1960s, known as the “blocked rand.” The Financial Rand was available only to foreigners for investment in South Africa and was created by the sale of nonresidents’ assets in the country.

Therefore, South Africa created a formal two-tiered currency system, which insulated the country’s foreign reserves from politically motivated capital flight. Since any divestment by nonresidents was automatically met by new investment, and the price of the Financial Rand varied independently of the commercial rand, a stability was achieved.

The Financial Rand invariably stood at a discount to the commercial rand, but the size of the discount depended on South Africa’s relative attraction as an investment destination. The discount stood at almost 40% during most of 1992 during the political crisis. The Convention for a Democratic South Africa (CODESA) began in December 1991 at the Johannesburg World Trade Center, attended by 228 delegates from 19 political parties. Mandela remained a key figure and after de Klerk used the closing speech to condemn the ANC’s violence, he took to the stage to denounce de Klerk as the “head of an illegitimate, discredited minority regime”.

This confrontation caused the rand to collapse. CODESA 2 was held in May 1992, at which de Klerk insisted that post-apartheid South Africa must use a federal system with a rotating presidency to ensure the protection of ethnic minorities. Mandela opposed this idea and demanded a unitary system governed by majority rule. Following the Boipatong massacre of ANC activists, Mandela called off all negotiations, and called for a special session of the UN Security Council and proposed that a UN peacekeeping force be stationed in South Africa to prevent “state terrorism.” Calling for domestic mass action, in August the ANC organized the largest-ever strike in South African history, and supporters marched on Pretoria. The rand declined to about 20% by late 1993.

Reserve Bank governor Chris Stals, under pressure from the banking and business communities, said that the government would phase out the Financial Rand in 1994 or 1995, assuming that South Africa’s foreign currency reserves reached at least R20 billion and that the discount between the financial and the commercial rends narrowed to about 10%. Foreign currency reserves were low in early 1994 but thanks to a dramatic reversal of the capital outflow in 1993, foreign currency reserves increased throughout 1994 and into early 1995.

Finally, by March 1995, with foreign reserves of only about R12 billion, the government abolished the financial rand. The newly unified currency began to trade on international currency markets, marking a vote of confidence in South Africa’s business potential.

Only a two-tier currency system can possibly weather the economic storm on the horizon from the collapse of the European Union at the hand of this lethal combination of policies. The next banking crisis will most likely begin in the Eurozone due to a continued failure to resolve the systemic weaknesses of its construction. The failure to have consolidated the debts means that the failure on the state level will ripple through the entire European economy. In the United States, state debt is not used for reserves. The failure of California will only send bond seekers into the federal debt who are fleeing state and municipal debt. We see that in Europe as capital fled from most members concentrating in Germany, which is the US Treasury equivalent within the Eurozone. With the first bail-in under the BRRD agreement, the contagion will be devastating as was the case when Michigan closed its banks in 1933 in the USA.

The Financial Rand fell below the domestic commercial rand when the 1992 political crisis unfolded, and capital fled South Africa unwilling to invest in a nation that might move into civil war. The two-tier currency system can and does help to distinguish between domestic and international capital flows.

There is the potential to create a two-tier monetary system with a new type of international currency that is separate and distinct from that of the domestic currency. This would allow the US dollar to end its reserve status and end the clash between domestic and foreign policy objectives.


The Fate of Europe


QUESTION: Marty; Your capital flow models have been remarkable. Do you see Europe as ever getting its act together? We need support to get decisions approved as you know. Will you provide that for us to present to the men above?

Thanks.

Nice to see you in Europe. Rome should be great at this time of year.

PDC

ANSWER: I have covered that is a special report for attendees. It took me a month to write this one. I have tried to cover every aspect so we can deal with the forecasting at the conference rather than all the supportive history. I understand that institutions need the support to justify their decisions. This is the report everyone needs for their files to CYA as the say for decisions.

Things look very dicey for Europe and this will be a very interesting WEC. Here is the Index of the Report. I believe this will answer all questions and provide the backup you need to present to any board of directors.


The Consequence of War that Led to the German Hyperinflation


QUESTION: Everyone has a chart of the German DAX postwar. I have never seen a chart of the German stock market before the war. Do you have any?

HVS

ANSWER: Yes. However, you must understand that because the world was on a gold standard, the arbitrage volatility was reflected in the bond and share markets when the currency was fixed. This is why the German share market closed in August 1914, along with just about everyone else. Here is a chart that show the performance of the German share market during the hyperinflation period. We have the DAX also extended back in time. But don’t forget, the DAX is a total return index. If we plot just price, you will see that the German share market looks very much like France.

The primary stock exchange in Germany was in Berlin. However, there were 21 exchanges in total. The origins of the Frankfurt Stock Exchange date back to medieval trade fairs during the 11th century. By the 16th century, Frankfurt developed into a wealthy and busy city with an economy based on trade and financial services. Annuities in particular were the hot items back then. It was in 1585 when the bourse was established to trade in fixed currency exchange rates. Currencies actually led to exchanges rather than shares. Eventually, Frankfurt developed into an early share market, competing with London and Paris. Mayer Amschel Rothschild and Max Warburg became very influential in the financial trade of Frankfurt.

The Frankfurt Stock Exchange had been a major international center. It was completely wiped out by World War I and its consequences. Back then, foreign shares and bonds traded on cross exchanges since money was fixed. German investors at the start of World War I dumped foreign bonds and shares, fearing that their capital would be restricted or confiscated. This is also why all the exchanges simply closed in Europe. Any capital they managed to free up from the sale of foreign investments was reinvested mostly in German government bonds. They were patriotic and believed in their government. However, by the end of the war, the Frankfurt Stock Exchange lost all foreign securities listings for bonds or shares. Frankfurt lost its standing as an international stock exchange entirely, and that would only begin to resurface in 1949.

In Europe, the fear of catastrophic declines in stock prices was met with controls at first. Overall, stocks and bonds were not allowed to trade below the price they had been trading at on July 31, 1914. Restrictions were also placed on capital. Money movement was highly restricted to preventing any large outflows of capital, forcing many into black markets. One means was to buy collector stamps and coins. They would then export especially rare stamps and then sell them in America. After two world wars, most of the rare stamps happened to be in America and gradually returned to Europe during the late 1960s.

With these restrictions in place, markets reopened in Europe. The London Times began printing stock prices for London and Bordeaux on September 19th and for Paris on December 8, 1914. In January 1915, all shares were allowed to trade on the London Stock Exchange, though with price restrictions. The St. Petersburg exchange reopened in 1917, only to close two months later due to the Russian Revolution. The Berlin Stock Exchange did not reopen until December 1917.

The loss of the war meant those who had invested in German bonds suffered the same fate as those Americans who invested in Confederate bonds. Indeed, to fund World War I, Germany relied more on raising money by selling bonds than imposing taxes. This had the net effect of wiping out the savings of the middle class and upper class. During the hyperinflation going into 1923, the losses in bonds were devastating, but in contrast, equities became a prized object among speculative investors. The Frankfurt stock exchange saw unprecedented losses in the bond markets and shares became the speculation objects that rose sharply going into 1923.

The German war costs covered by taxation, including state and federal combined, was only 13.9% which was lower than 18.2% taxation imposed in Great Britain for the war effort. German debt exploded after 1916. That is when the federal government’s short-term floating debt grew relentlessly, and by the end of the war it accounted for nearly one-third of the German national debt. The seriousness of the German debt crisis, which led to the postwar hyperinflation, was the fact that after 1916 German banks began to purchase more of the government’s floating debt. Government debt dominated the market and banks took on more public debt than private. When the public debt was marginalized by hyperinflation, it also wiped out the banking system.

By the end of the war, the international contacts of the Frankfurt Stock Exchange had been lost. Inflation set in and reached its first peak in 1923. In October 1929, the Germany stock exchange prices crashed dramatically on the 25th. The world economic crisis ruled the following years. The economy only began to stabilize in 1932. The following year, the Nazis took over and centralized the nation’s economic policy. The Frankfurt Stock Exchange was merged with the Mannheim Stock Exchange and the number of exchanges nationwide was reduced from 21 to nine. Under the stringent Nazi economic regime, free trade was suffocated as Hitler defaulted on external debt. The majority of capital assets was directed to benefit the war economy. He even issued conversion fund certificates that were exchanged one for one with German marks if you sought to leave the country. This was part of the currency controls but they were worthless once you left the country.


Study of the Blackbody Temperature of Earth, Written first in 2017 update monthly


The purpose for this paper

This paper is not meant to be a peer-reviewed work; but it is meant to give a foundation for a more serious study of the subject matter presented here which is of determining the basis of developing a global temperature. The key is the base which what is the base temperature of the planet and, of course, it is  the solar radiation received from the sun. Therefore, the energy absorbed by the planet must equal the energy emitted by the planet and we can calculate this using the Stefan-Boltzmann Law the the result is called the blackbody temperature. The energy flux emitted by a blackbody is related to the fourth power of the body’s absolute temperature. In the case of the earth use means and averages that temperature is -18.8 degrees Celsius but wait the current temperature around 14.6 degrees Celsius today that is a difference of 33.4 degrees Celsius; where did that come from. The answer is that is the greenhouse effect. and at least 85% of that is form the water in the atmosphere making water the primary green house gas by far.

This paper has been written to show the read the basics of the science of determining the key variables that make up earth the temperature. What you will find is that the planet has been very stable over time and that its currently much cooler than it ever has been.  The following chart is developed from ice core and is onlyu one of many that show the same thing.

There are three areas of interest.

1) The amount of thermal energy that reaches the planet from the sun.
2) The amount of thermal energy that is initially absorbed by the planet.
3) The process on the planet that ‘temporarily’ holds thermal energy on the planet.

In this paper I will give a frame work for determining all three aspects.

Part One, the blackbody temperature of the planet
Part Two, the planetary greenhouse effect
Part Three, the probable range of temperatures on the planet

Appendix

NASA Table Land Ocean Temperature Index (LOTI) April 2008
NASA Table Land Ocean Temperature Index (LOTI) current to the date of this paper

The link below will allow you to download the paper, if you want, and at no cost.

BLACKBODY TEMPERATURE PAPER

The Real “An Inconvenient Truth,” Written in 2014


From the Background in the book

Back in 2004 as my work on a PEM fuel cell research project wound down there were concerns building in the news that the various regulatory programs, both in the US and else ware, were adversely affecting energy production. This was a subject of which prior experiences to include the one winding down were familiar to me from work done when I worked at General Electric, first in their R&D labs near their main production facility in Schenectady, New York and later in Erie Pennsylvanian building Diesel Electric Locomotives. With some time now available it didn’t take long with the now well established web resources for me to acquire additional technical knowledge on this subject.

After tentative research started Al Gore’s documentary “An Inconvenient Truth” was released in 2006; this documentary was produced by Davis Guggenheim and it was a story about how the burning of fossil fuels were destroying the planet. It seemed to be targeted at young adults without the education to discern truth from fiction and it was very successful in achieving negative awareness on the subject. Unfortunately, the message in that documentary was not factually correct and appeared to be only an emotional appeal to support the regulation of Carbon Emissions’ (CO2) in some form of Carbon Tax. Governments always need more money and this seemed to be a way for them to achieve that end. Unfortunately, almost all our energy comes from carbon based fuels and the proposed taxes would significantly add to the cost of producing energy. Since cheap energy is the very heart of a modern industrial society this would have disastrous economic effects.

An interesting fact, Al Gore was one of the investors that had helped set up a Carbon Trading exchange in Chicago along with a young Barack Obama (on the board of the major investor The Joyce Foundation located in Chicago) that they named the Chicago Carbon Exchange CCX in 2003. When The House of Representatives bill HR 2454 (American Clean Energy and Security Act of 2009) was not passed by the US Senate in 2009 the CCX exchange folded the following year, 2010. Gore has been very vocal on this subject and if HR 2454 had been passed by the US Congress Gore would have become very wealth; so the question is was his involvement because he believed what he was promoting or because what he was promoting would have made him very wealthy?

By 2007 it was becoming clear that there were holes in the theory (Anthropogenic Climate Change) that was used to justify the reduction of carbon and that changed my view that this might be a real issue into the realization that this was going to be very bad and unnecessary if HR 2454, or any like bill, actually implemented. By 2008 this project was taking up a significant amount of my time and after the financial collapse, almost full time for a couple of years. During this time a method was found to model the world’s climate that appeared to work; and by 2012 it was virtually certain that this model was showing what was actually going on in the climate at the macro level.
This book is a summary of almost a decade of technical work which started in 2004, ten years ago. Although my background is neither physics nor chemistry those subjects and others such as climatology are part of my technical background as well as mathematics and statistics. Then forty years of experience as an engineer, researcher and inventor, much in the field of energy, does allow one to study and make observations on the movements of things especially when they have very obvious patterns. This book is based on observations and modeling and that is certainly something that someone with an economics and engineering background can do even without a PhD. But I should add here that this is not a book in the normal sense; it’s more a series of discussions taken from various papers and studies that I’ve written over the last decade.

This is a graphic of the energy flows in the Earths atmosphere the represents the energy flows that keep the Earths Temperature Stable that I created after I understood what was happening. Will Happer was instrumental in my education on the “real” physics involved! 

I have tried to put the works in an order that makes sense but since this is a composite there is some duplication in a few places.
Predicting what will happen tomorrow or years from now has never been easy, and never will be since there are always the messy and unforeseen things that get in the way. But having said that when a forecast is desired and a model or simulation is constructed and there is sufficient relevant information available, it may be possible to construct a model that works — as long as conditions do not change. Finding information that correlates into causal relations is the key to the success of any model; but it’s also very easy to fall into the trap of correlation but no cause and effect as data streams often move together but for many and varied reasons, some of which are not causal.

For example we have a road coming from the south going north turning to the west and entering a gap in some mountains that are in the way. There is also a railroad line coming from the east and going west passing though the same gap for the same reason and they run parallel to each other as that is the best way through the mountains. For the time they are both in the gap they run together and in the same direction so that a train and a car could be traveling next to each other and maybe even at the same speed through the entire gap. An observer in the mountains could say after observing both moving together and in the same direction that both were going to the same place. That observer could not know that only a few miles up the gap the road and the track would go their separate way.

We have the same situation with anthropogenic climate change where from the 1970’s until just a few years ago when both CO2, as measured by NOAA, and global temperatures, as measured by NASA seemed to be going up at a similar rate. The issue wasn’t that they were or weren’t moving together but whether it was coincidence or correlation with cause and effect. Models that are designed and built around incomplete data no matter how well indented to not work once the conditions change. During this period it is a fact that both moved together, just like the car and train, but before then and ever since, they were going their own separate ways.

Since all have to agree that a model is only as good as the forecasts it makes and therefore the current global temperature reductions which are not shown in any of the IPCC climate models means that there is something wrong or something missing. In this book we will show a different way of looking at climate that gives significantly better predictive results. This alternative model is significantly more accurate than that of the IPCC models and is therefore by definition a better model. The reason this is so is that there are many problems with the assumptions used to build the IPCC climate models which are at the heart of the anthropogenic climate change debate, and the debate is far from settled.

The balance of this book is showing how the IPCC climate assumptions are incomplete and how when those assumptions are modified that a model can be designed that actually works. This is original research based on information easily found on the web. It is the opinion of the author that this model is valid and has correctly identified the key variables.

Since this book was written I have made some revisions but the basic principles are the same.


The link below will allow you to download the book, if you want, and at no cost.

The Real “An Inconvenient Truth”

Book on Economics, Written in 1994


From The introduction to my book …

I first had the idea of writing a book such as this about ten years ago. It seemed to me that each of us learns something of value as we go through life, but most of us do not succeed in passing along our knowledge to others before we die. This, then, is my attempt to pass on to others what I, over my fifty-odd years, have come to believe are the truths of life and what I believe may be a path into a better future. Much of what I write about involves economic issues, since I am an economist by training. Economics, however, is a social science, and my excursions into other areas of the social sciences are therefore not totally out of line.

I have had a great deal of “life” experience (both educational and professional) and this book thus covers many subject areas. While analyzing these subjects, I have tried to be logical and objective (as I have tried to be all my life), and hopefully this proclivity is reflected herein. You, the reader, will probably disagree with some or much of what I have written. That’s fine if your disagreement is based on fact; it’s unacceptable, however, if your disagreement is the result of prejudice and preconceived ideas.
Throughout this book, I have included editorial writings, which I felt were astute, and which help to illuminate my ideas. In each case, I have credited the author and distinguished his/her writing from my own.

Much of what I write about could be construed as anti-religious; it is not. It has not been my intention to support or deny the existence of God or a Supreme Being.
A thought that should be kept in mind when reading this book is that virtually nothing we do today is done as it was in the past. By this I mean the “near past”–remember that radio was invented only ninety-nine years ago, and it has been only ninety-one years since the first powered flight. Most of the technology that we now take for granted has been developed in the past fifty years. The corollary to this is that our ideas and attitudes must also be different from those of the past. Try to imagine how people will regard the “absurdly primitive” last decade of the twentieth century in the year 2045 (when all that we know today will have been gone for fifty years). The point is to keep an open mind, don’t pre-judge, and don’t be too certain about anything.

We live in a world of fantastic ideas if only we can keep an open mind!

The link below will allow you to download the book, if you want, and at no cost.

Power Economics