Tag Archives: Hyperinflation
They See It Coming – Fitch Joins S&P to Downgrade USA Credit Rating
Posted originally on the CTH on August 2, 2023 | Sundance
Collapse is never a sudden occurrence; it is an outcome of gradual erosion over time. A weakening that takes place almost invisible to those who pass through the construct, until eventually, at an uneventful time in the mechanics of history, the process gives way.
Fitch has joined with the prior position of Standard & Poors to downgrade the USA credit rating. The weight of debt, in combination with reverberations from the continued hammering deep inside the political fundamental change operation, has triggered another flare.
In the bigger picture, this is a self-fulfilling prophecy driven by the latest focus on unsustainable economic policy, aka The Green New Deal. The efforts of the fiscal, monetary and economic policy are all aligned to shrink the U.S. economy, thereby creating the era of “sustainable energy” a possibility. Unfortunately, this is akin to a household intentionally shrinking their income while at the same time taking on credit card debt. The process itself is not sustainable.
(Reuters) – Rating agency Fitch on Tuesday downgraded the U.S. government’s top credit rating, a move that drew an angry response from the White House and surprised investors, coming despite the resolution of the debt ceiling crisis two months ago.
Traders’ immediate response was to embark on a safe-haven push out of stocks and into government bonds and the dollar.
Fitch downgraded the United States to AA+ from AAA, citing fiscal deterioration over the next three years and repeated down-the-wire debt ceiling negotiations that threaten the government’s ability to pay its bills.
[…] “In Fitch’s view, there has been a steady deterioration in standards of governance over the last 20 years, including on fiscal and debt matters, notwithstanding the June bipartisan agreement to suspend the debt limit until January 2025,” the rating agency said in a statement.
U.S. Treasury Secretary Janet Yellen disagreed with Fitch’s downgrade, in a statement that called it “arbitrary and based on outdated data.”
[…] In a previous debt ceiling crisis in 2011, Standard & Poor’s cut the top “AAA” rating by one notch a few days after a debt ceiling deal, citing political polarization and insufficient steps to right the nation’s fiscal outlook. Its rating is still “AA-plus” – its second highest.
After that downgrade, U.S. stocks tumbled and the impact of the rating cut was felt across global stock markets, which were in the throes of the euro zone financial meltdown.
In May, Fitch had placed its “AAA” rating of U.S. sovereign debt on watch for a possible downgrade, citing downside risks, including political brinkmanship and a growing debt burden. (read More)
What do Barack Obama and Joe Biden have in common? They were both in office, executing an identical economic, fiscal and monetary policy, when the USA credit was downgraded.
Trying to Make Heads or Tails about Recessions
Armstrong Economics Blog/Economics Re-Posted Jul 28, 2023 by Martin Armstrong
QUESTION: Looking at Socrates, do you think that these people who were constantly calling for a recession because there were two quarters that declined with covid really need revision? Socrates was correct, no recession. But it is showing major turning points in 2024 which seem to align with your old ECM forecast calling for commodity inflation into 2024. How would you define a recession?
EJ
ANSWER: In trading, reactions are 1 to 3 time units. I believe that the same definition should be used for classifying a recession. They define a recession as two consecutive quarterly declines. If you look at the “Great Recession” of 2008-2009, you will see three consecutive quarterly declines and a rebound. If we look at the COVID recession caused by locking everyone down, that was just two consecutive quarterly declines.
I personally would argue that a true economic recession MUST exceed three consecutive declines. Here is the chart of GNP from 1929 to 1940. There were three years of negative growth. I simply think that this definition of two quarters is wrong. You can have a slight decline of 1 to even 5%, but that does not suggest a recession. In the case of 1929, that was a decline of 9.5% in 1930 – the first year. Now look at the COVID Crash, which was also a decline of 9.53%. But the difference is that the COVID decline was forced and not natural. That is why it rebounded so quickly. Now the so-called “Great Recession” of 2008-2009 only saw a decline in GDP of 3.47%.
The “Great Recession” was not really so great. It wiped out real estate and bankers but did not fundamentally alter the economy. So who is right and who is wrong will always depend upon the definition. Yes, the AI Timing Arrays point to a recession starting Next Year by their definition. This will most likely be caused by the decline in confidence that will lead to UNCERTAINTY, and as such, the consumer will contract. Up to now, the continued expansion of the economy into 2024 has also been fueled by the shift in assets from public to private.
As originally forecast, we should have seen a commodity boom into 2023,
and we should expect a highly authoritarian attempt by 2028.
The Bankers Who Are De-Banking Those They Just Disagree With
Armstrong Economics Blog/Politics Re-Posted Jul 28, 2023 by Martin Armstrong
I want to stress that I have been getting emails that the same trend is emerging in the United States. Some banks have embraced WOKE, and with it, they are engaging in DISCRIMINATION. This equality only works when you agree with them. If you disagree, you are to be cast out of society, de-banked, and unable to even survive, pay a mortgage, or food.
Chase had debanked Dr. Mercola. I too was debanked by Chase after sending bonuses to our overseas employees. They did not ask for any explanation – they just closed the account. This is becoming common these days.
US Households Paid an Additional $10K Under Biden Regulations
Armstrong Economics Blog/Politics Re-Posted Jun 30, 2023 by Martin Armstrong
University of Chicago professor Casey Mulligan recently compared regulatory records from the Obama Administration to now. Mulligan found that Biden has imposed the most costly regulations in recent history at a rate of $617 billion annually. Her research concluded that the average American household now pays $9,600 more under Biden.
This uptick in spending found in this study is solely due to regulation. If we were to factor in inflation, which Biden poured gasoline on (no pun intended), the figure would be even higher. The Build Back Better agenda comes at a cost to the people. Auto fuel and emissions standards compose one-third of total regulatory costs alone.
Trump attempted deregulation and saved the average American household $11,000 during his four-year term. Trump’s main regulatory initiative that was a costly mistake was Operation Warp Speed, which cost over $300 billion. “President Trump showed that regulatory costs can be subtracted rather than perpetually added,” the report states. “Four years of President Trump reduced regulatory costs by about $11,000 per household. Eight years would have saved a total of more than $21,000, which is a gap of $61,000 to $80,000 from the Biden trajectory.”
Biden had the audacity to tote “Bidenomics” at a recent speaking engagement. Clearly, his economic policies have put America in a dire situation. Biden plans to continue implementing costly regulations. Mulligan’s estimates also do not account for the coming war his administration is thrusting us into without just cause. The nation simply cannot afford to keep him in power. Too bad we don’t have the ability to determine our own elections.
Credit Card Debt on the Rise
Armstrong economics Blog/USA Current Events Re-Posted Jun 5, 2023 by Martin Armstrong
Credit card debt in the US spiked to its highest quarterly level in Q4 2022 after increasing by $85.8 billion. The average American household has about $10,000 in credit card debt, marking an 8.9% YoY increase. Now, Americans are facing $1 trillion in credit card debt due to rising APR and inflation.
The Federal Reserve reported that credit card debt has risen by $250 billion over the past two years amid record inflation. Consumer spending declined during the pandemic, as did credit card debt. However, inflation was nowhere close to what it is today. Credit balances declined by $100 billion from Q1 of 2020 to Q2 of 2021. Consumers were paying off their debts during this time, aided by numerous stimulus packages provided by the government.
Everything changed when Biden took office, killed America’s energy independence, and inflation began to spike. The central bank raised rates right before the war in Ukraine broke out, and have continued to do so at every meeting since. Various data collectors noted that consumers are not using their credit cards for luxury goods – they’re using credit to simply get by and pay for essentials.
Bankrate reported that 46% of cardholders cannot pay off their monthly credit card payments, up 7% from last year. The average APR is around 24% as of May 2023. The US Bureau of Labor Statistics claims that the CPI rose 0.4% in April after increasing 0.1% in March. I reported how the true inflation rate is over 30%; they do not want to scare the public by posting the real data. Food, energy, shelter, and all the essentials to survival have reached historic levels. If nearly half of people cannot pay their credit card balances off each month, and interest is at a record high, consumer debt is guaranteed to rise continually. Nothing is more inflationary than war, and our war cycle is picking up going into 2024. So not only is the US government drowning in debt, but the average American is also struggling to make ends meet.
May Jobs Report Show 339,000 Jobs Gained, Worked Hours Declines, Unemployment Rate Increases to 3.7%
June 2, 2023 | Sundance
There is a strong divergence within the May jobs report as released by the Bureau of Labor and Statistics (BLS) [DATA HERE]. Payrolls increased 339,000 in May from April and previous months were revised up by 93,000. That is good news. However, the household survey, from which the unemployment rate is derived, showed employment down 310,000 jobs and the unemployment rate increased to 3.7%.
One of the aspects driving higher payroll starts are the number of people taking on additional part-time jobs. This aspect is noted in a decline for the number of hours in the average workweek. As more PT jobs are added, the number of hours in a workweek declines. As noted in the BLS data, “the average workweek for all employees on private nonfarm payrolls edged down by 0.1 hour to 34.3 hours in May.”
There were 161.0 million people working in April. There are 160.7 million people working in May.
There were 5.7 million people unemployed in April. There are 6.1 million unemployed people in May.
The unemployment rate increased from 3.4% to 3.7%.
There are 310,000 fewer people working in May than were working in April. However, payrolls increased by 339,000 over the same timeframe. See graph above for where those jobs were gained.
(NBC) – […] Job gains were broad-based last month with health care contributing 52,000 and leisure and hospitality adding 48,000. Food services and drinking places led the increase in the latter industry, which had been adding an average of 77,000 jobs per month over the prior 12 months.
Overall, the U.S. economy added 339,000 jobs for the month, much better than the 190,000 Dow Jones estimate and marking the 29th straight month of positive job growth.
The unemployment rate rose to 3.7% in May against the estimate for 3.5%. The jobless rate was the highest since October 2022, though still near the lowest since 1969.
Olu Sonola, head of U.S. regional economics at Fitch Ratings, said the jobs report is a mixed bag.
“The strength of the payroll survey is clearly a big surprise, largely on the back of robust job growth in the healthcare sector and the business and professional services sector,” said Sonola. “However, the 0.3% increase in the unemployment rate is the highest monthly increase since April 2020.” (more)
WAGES – As noted within the BLS report, “In May, average hourly earnings for all employees on private nonfarm payrolls rose by 11 cents, or 0.3 percent, to $33.44. Over the past 12 months, average hourly earnings have increased by 4.3 percent.” Wage growth still lags inflation; the middle class is getting poorer. However, with the fed focused on wage growth as the leading indicator of their false pretenses to combat inflation, wage growth is too high (they want around 3.0%).
The Biden economic and monetary policies are delivering the results they want. Higher energy prices, higher costs of living, lower real wages and increased middle class pressure. The serf model.
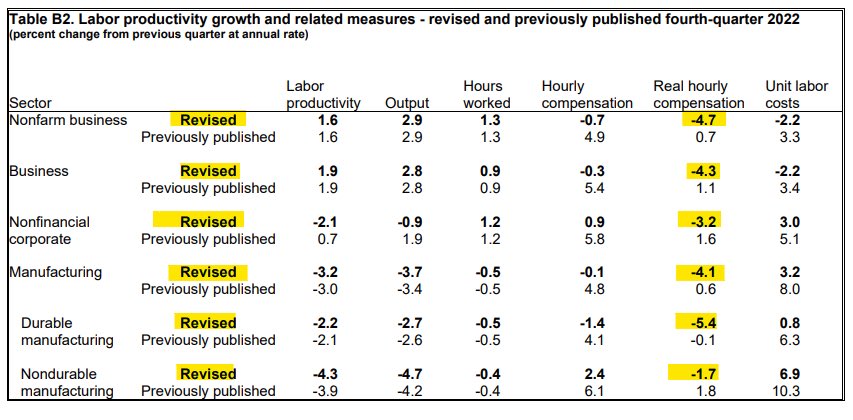
The BLS was forced to admit yesterday their Real Hourly Compensation growth was previously flawed. [CHART DATA SOURCE]
That chart of revisions to real wages tells us a lot about the economic pain being felt by the working class in the U.S. If it feels like you are working harder and going backwards in your ability to afford basic essentials, that’s because you are.
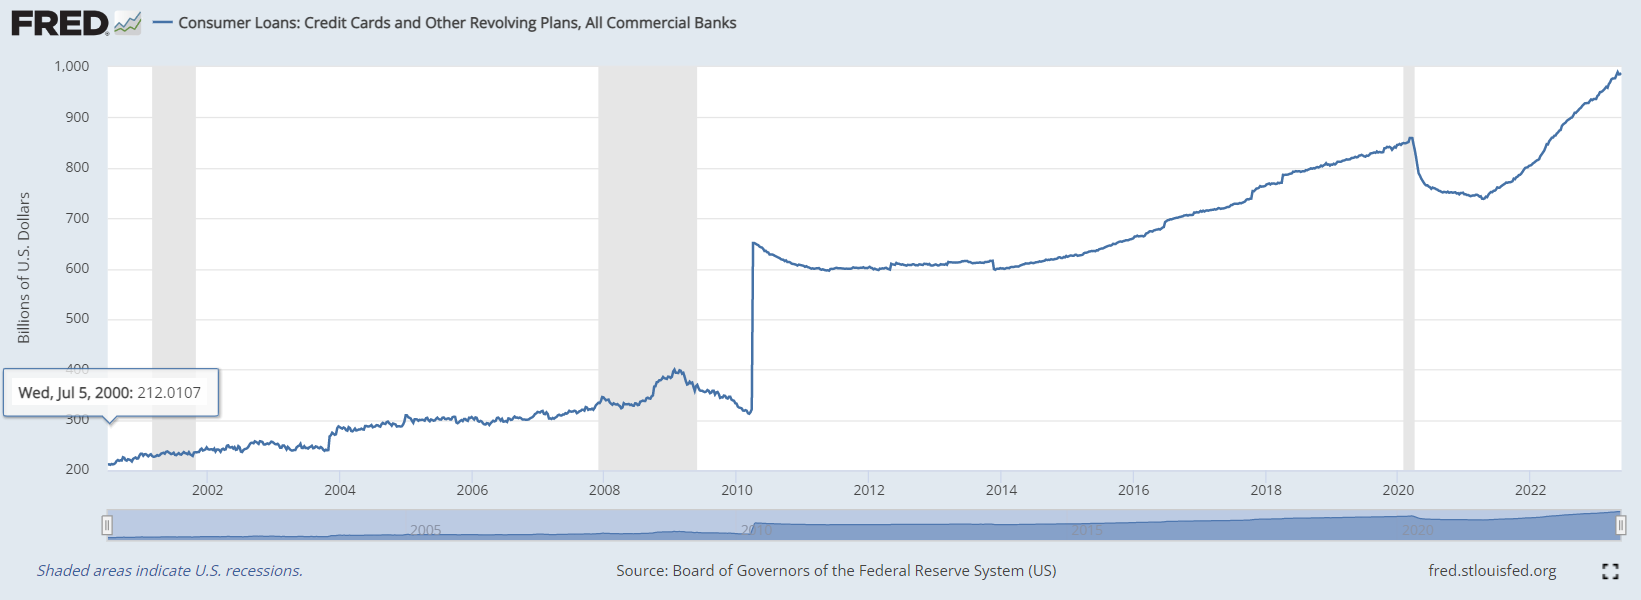
The prices for essential goods and services have risen at a much greater rate than the wages needed to afford them. This is the result of Joe Biden’s energy policy, economic policy, and now magnifying monetary policy.
Our goods and housing costs are higher. Our wages are not growing much. The cost to borrow money to afford the gap is increasing. This is unsustainable.
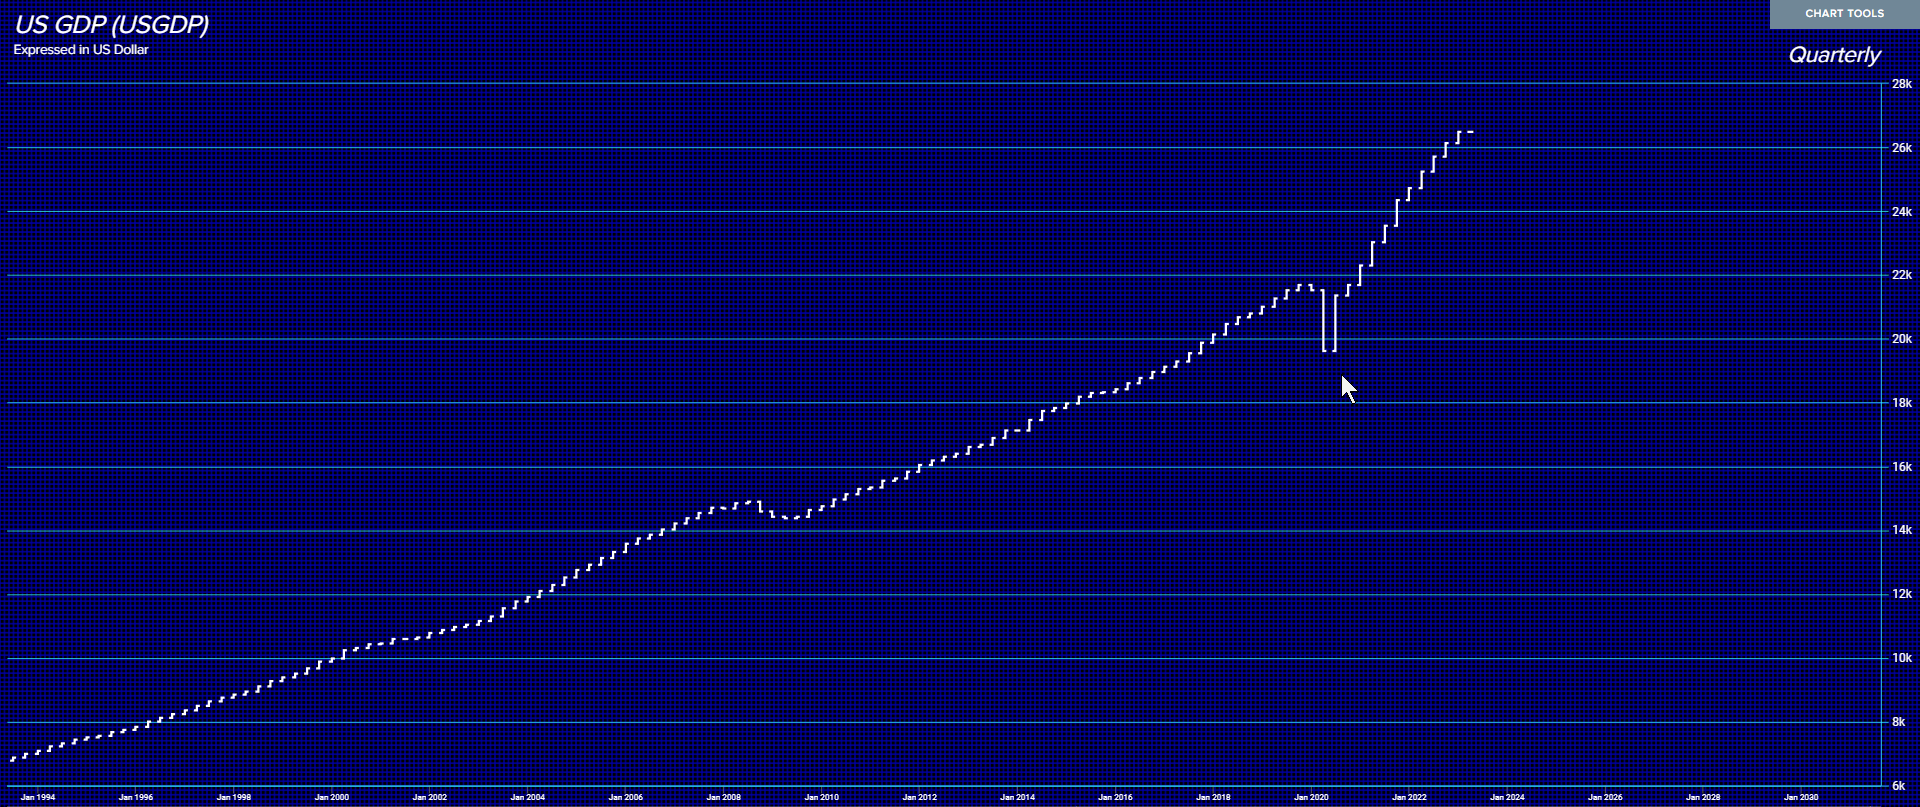
In my opinion, the economy overall – as a measure of units produced and sold – has been in a contracting position since the fourth quarter of 2021. The appearance of economic growth, the value of goods and services, is an illusion that has been created by higher prices, ie. inflation.
Interview: Martin Armstrong on Why the CBDC Will Fail and a Great Depression is About to Begin
Armstrong Economics Blog/Armstrong in the Media Posted May 20, 2023 by Martin Armstrong

Rumble link Martin Armstrong on Why the CBDC Will Fail and a Great Depression is About to Begin
Interview: The Real Rate of Inflation
The Gold Crash & Our Fate
Armstrong Economics Blog/ECM Re-Posted May 19, 2023 by Martin Armstrong
COMMENT: Marty; Socrates is absolutely amazing. At the start of the year, you showed April as a key turning point in gold followed by May June. The weekly array projected this was the week for the Directional Change. There is nobody with a system like this, which brings to mind its forecasts for war. Ukrainians are out of their mind to go against the trend. They never even considered what if they lose. It seems like a fool’s bet. This not about just occupying the Donbas which has always been Russian. This is about destroying Russia. They should listen to Socrates to save their own country.
Thank you so much for bringing Socrates to the public rather than just institutions.
HR
ANSWER: I know. These forecasts are not my personal opinion. When you put the entire world together, the trend becomes obvious. Just as I said Ukraine needs to lose to save the world, I also know that we will not all escape the end conclusion. Just as a Serb assassinated the Archduke in Sariavo which began World War I, this entire region is notorious for personal grudges and hatreds that draw in the entire world.
Schwab may have taken our forecast for 2032 and rephrased it as his Great Reset and is hoping to push the falling tree into his direction, that too will fail. But between here and 2032, we are entering a phase of chaos and havoc. I wish I could prevent it, but that is just our fate.


