Armstrong Economics Blog/Banking Crisis
Re-Posted Apr 4, 2019 by Martin Armstrong

QUESTION: As of today, Basel III comes in effect. Rumour goes that in a couple of months, there will be a lot of turmoil on the market and it would be the start of the implementation of an SDR like thing where people would lose 20-30% of their value and get stuck with this new currency. You have mentioned before this was in the pipeline but no timing was given. Is it really this close or is it for 2020-2022?
PT’S
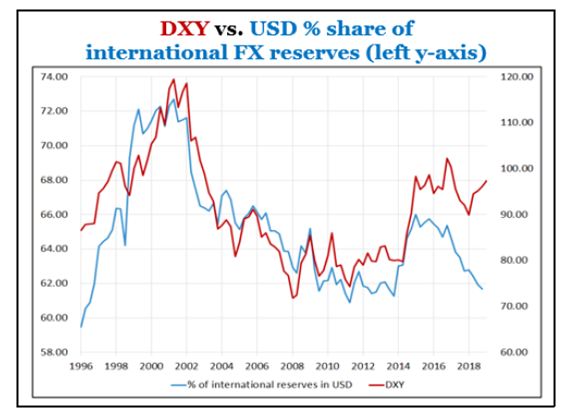
ANSWER: The IMF has been pitching Washington to let their SDR become the new reserve currency. They claim this would eliminate the problem of the Fed having to worry about external influence v domestic. Let me say that this will NEVER eliminate the issues of international capital flows. The fixed exchange rate of Bretton Woods never prevented that problem and it was that very issue that brought it crashing down. Until we are ready to begin teaching the meaning of a floating exchange rate system and abandon Keynesian economics, I do not see this problem ever being eliminated.
Basel III is separate from the IMF and its purpose is capitalization of banks — not the reserve currency of a dollar v SDR. Basel III was agreed upon by the members of the Basel Committee on Banking Supervision in November 2010, and was scheduled to be introduced from 2013 until 2015. However, implementation was extended repeatedly to March 31, 2019, and then again until January 1, 2022. The Committee replaced the existing Basel II floor with a floor based on the revised Basel III standardized approaches. This revised output floor is to be phased in between January 1, 2022, and year-end 2026, thereby becoming fully effective on January 1, 2027, if the banking system can survive that long to begin with.
The Basel III leverage ratio framework and disclosure requirements (“the Basel III leverage ratio framework”) was supposed to be raised to protect banks from failures. Many were required to raise more capital. The Net Stable Funding Ratio (“Basel III NSFR standards”) was to be applied to participating banks. Moreover, the committee is monitoring the overall impact of Total Loss Absorbing Capacity (TLAC) and banks’ holdings of TLAC instruments. Capital requirements for market risk as well as the committee’s finalization of post-crisis reforms were all supposed to be back-tested. Additionally, profit and loss (P&L) accounts related to the revised internal models-based approach (IMA) for calculating minimum capital requirements for market risk more specifically.

All of that said, the crisis we have is a LIQUIDITY Crisis. This time it has been created especially by the European Central Bank (ECB). By keeping interest rates negative and punishing banks for having cash, they have (1) lent into real estate to get higher yields but this type of asset cannot be sold easily, (2) buying emerging market debt to get a high-yield like Turkey. Turkey was the favorite of Spanish Banks and the capital controls that Turkey did before the election sent shivers down the spine of institutional investors. The ECB has driven banks into these markets that are notoriously illiquid. This means that under Basel III, banks will not have the liquid assets to support their capitalization requirements. It becomes more likely that the Basel III requirements will be suspended or else there will be a wholesale collapse of the banking system.
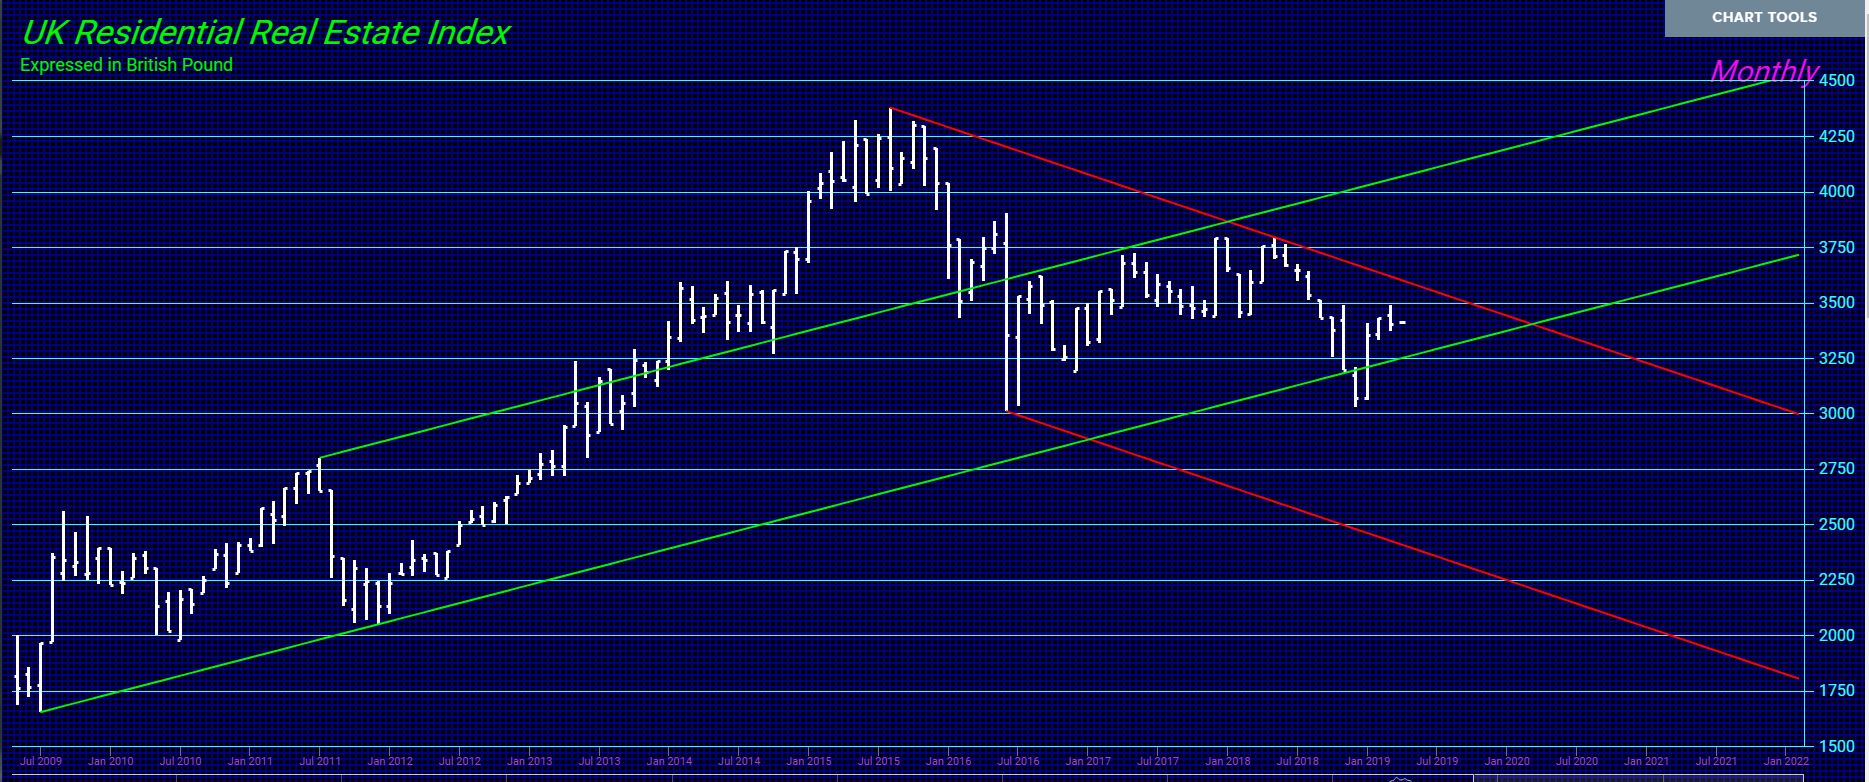
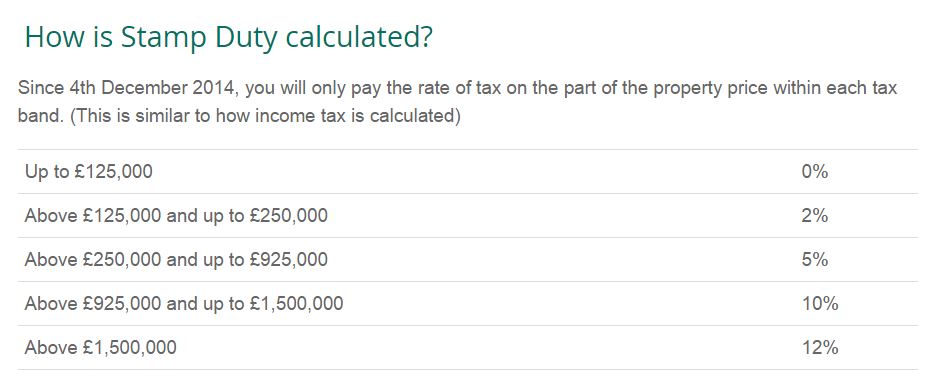
 REPLY: The biggest problem with London real estate has been the change in taxation to supposedly make the property more accessible. That means that the government deliberately wanted to create a bear market. The stamp duty was really abusive. It is hard to see where London property could survive after that.
 The London housing market sales began to crash from the peak in the Economic Confidence Model 2015.75 as reported in