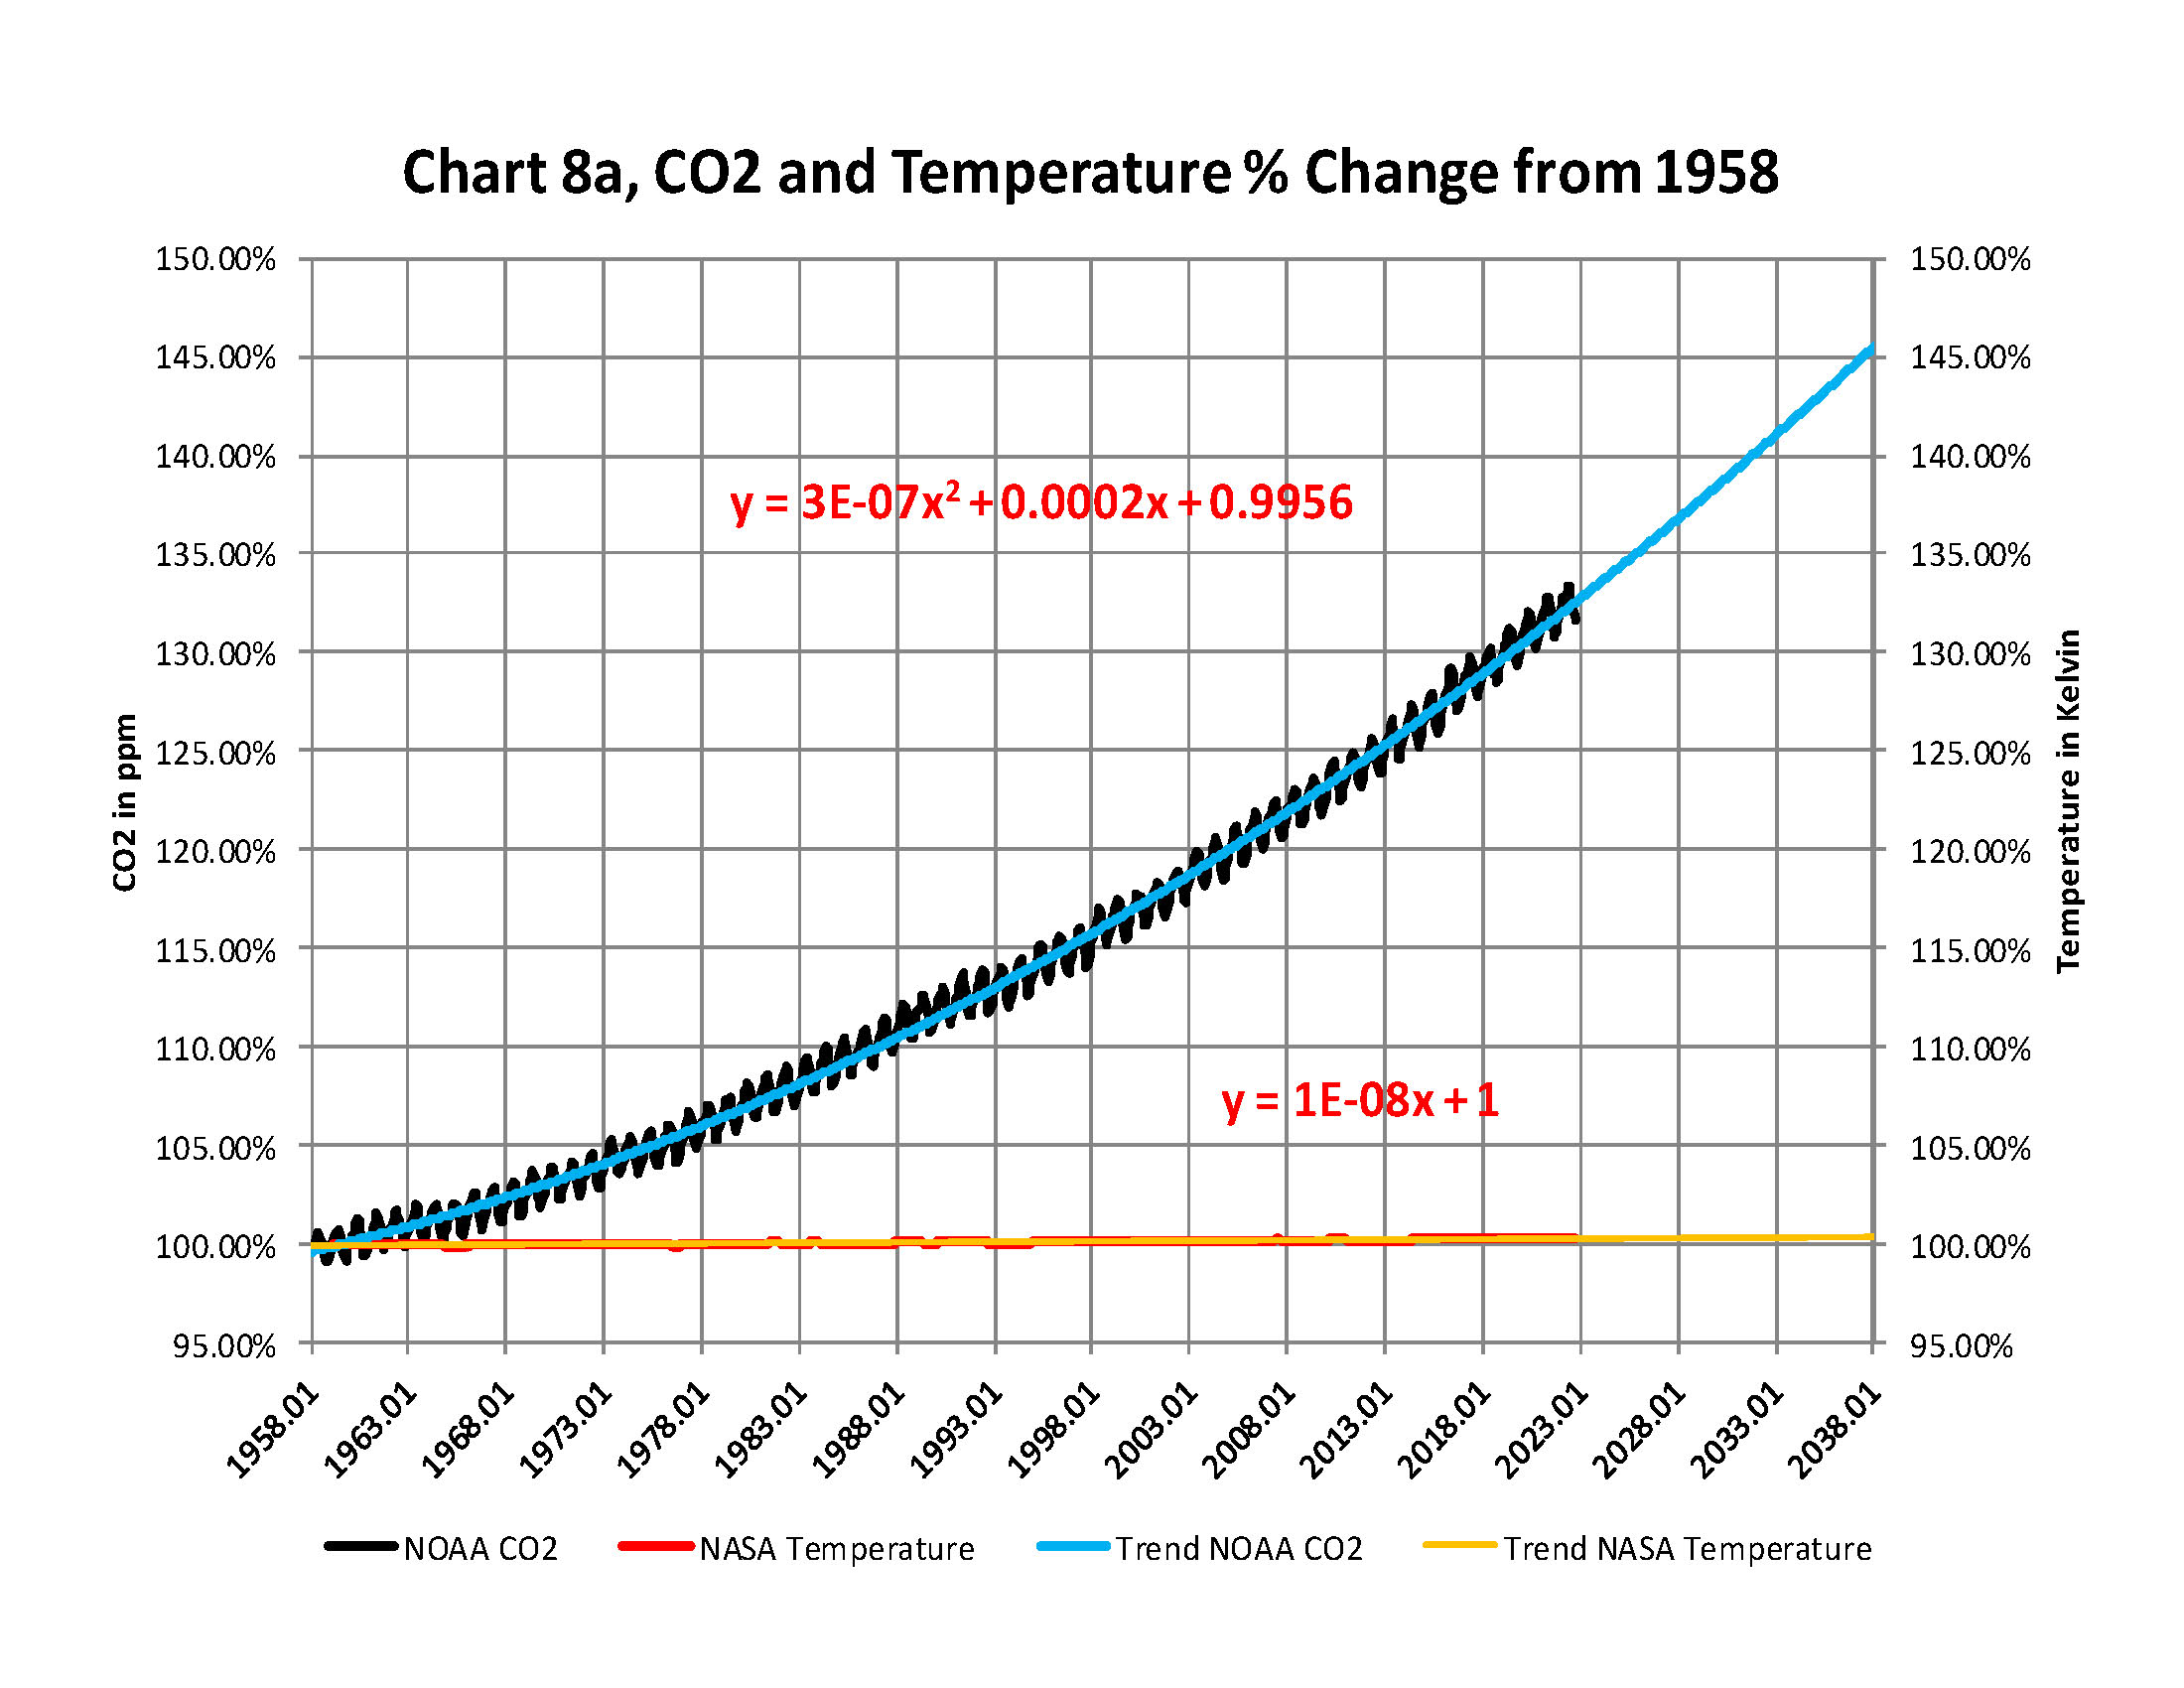
From the attached report on climate change for November 2022Data we have the two charts showing how much the global temperature has actually gone up since we started to measure CO2 in the atmosphere in 1958? To show this graphically Chart 8a was constructed by plotting CO2 as a percent increase from when it was first measured in 1958, the Black plot, the scale is on the left and it shows CO2 going up by about 32.4% from 1958 to November of 2022. That is a very large change as anyone would have to agree. Now how about temperature, well when we look at the percentage change in temperature also from 1958, using Kelvin (which does measure the change in heat), we find that the changes in global temperature (heat) is almost un-measurable at less than .4%.
As you see the increase in energy, heat, is not visually observably in this chart hence the need for another Chart 8 to show the minuscule increase in thermal energy shown by NASA in relationship to the change in CO2 Shown in the next Chart using a different scale.
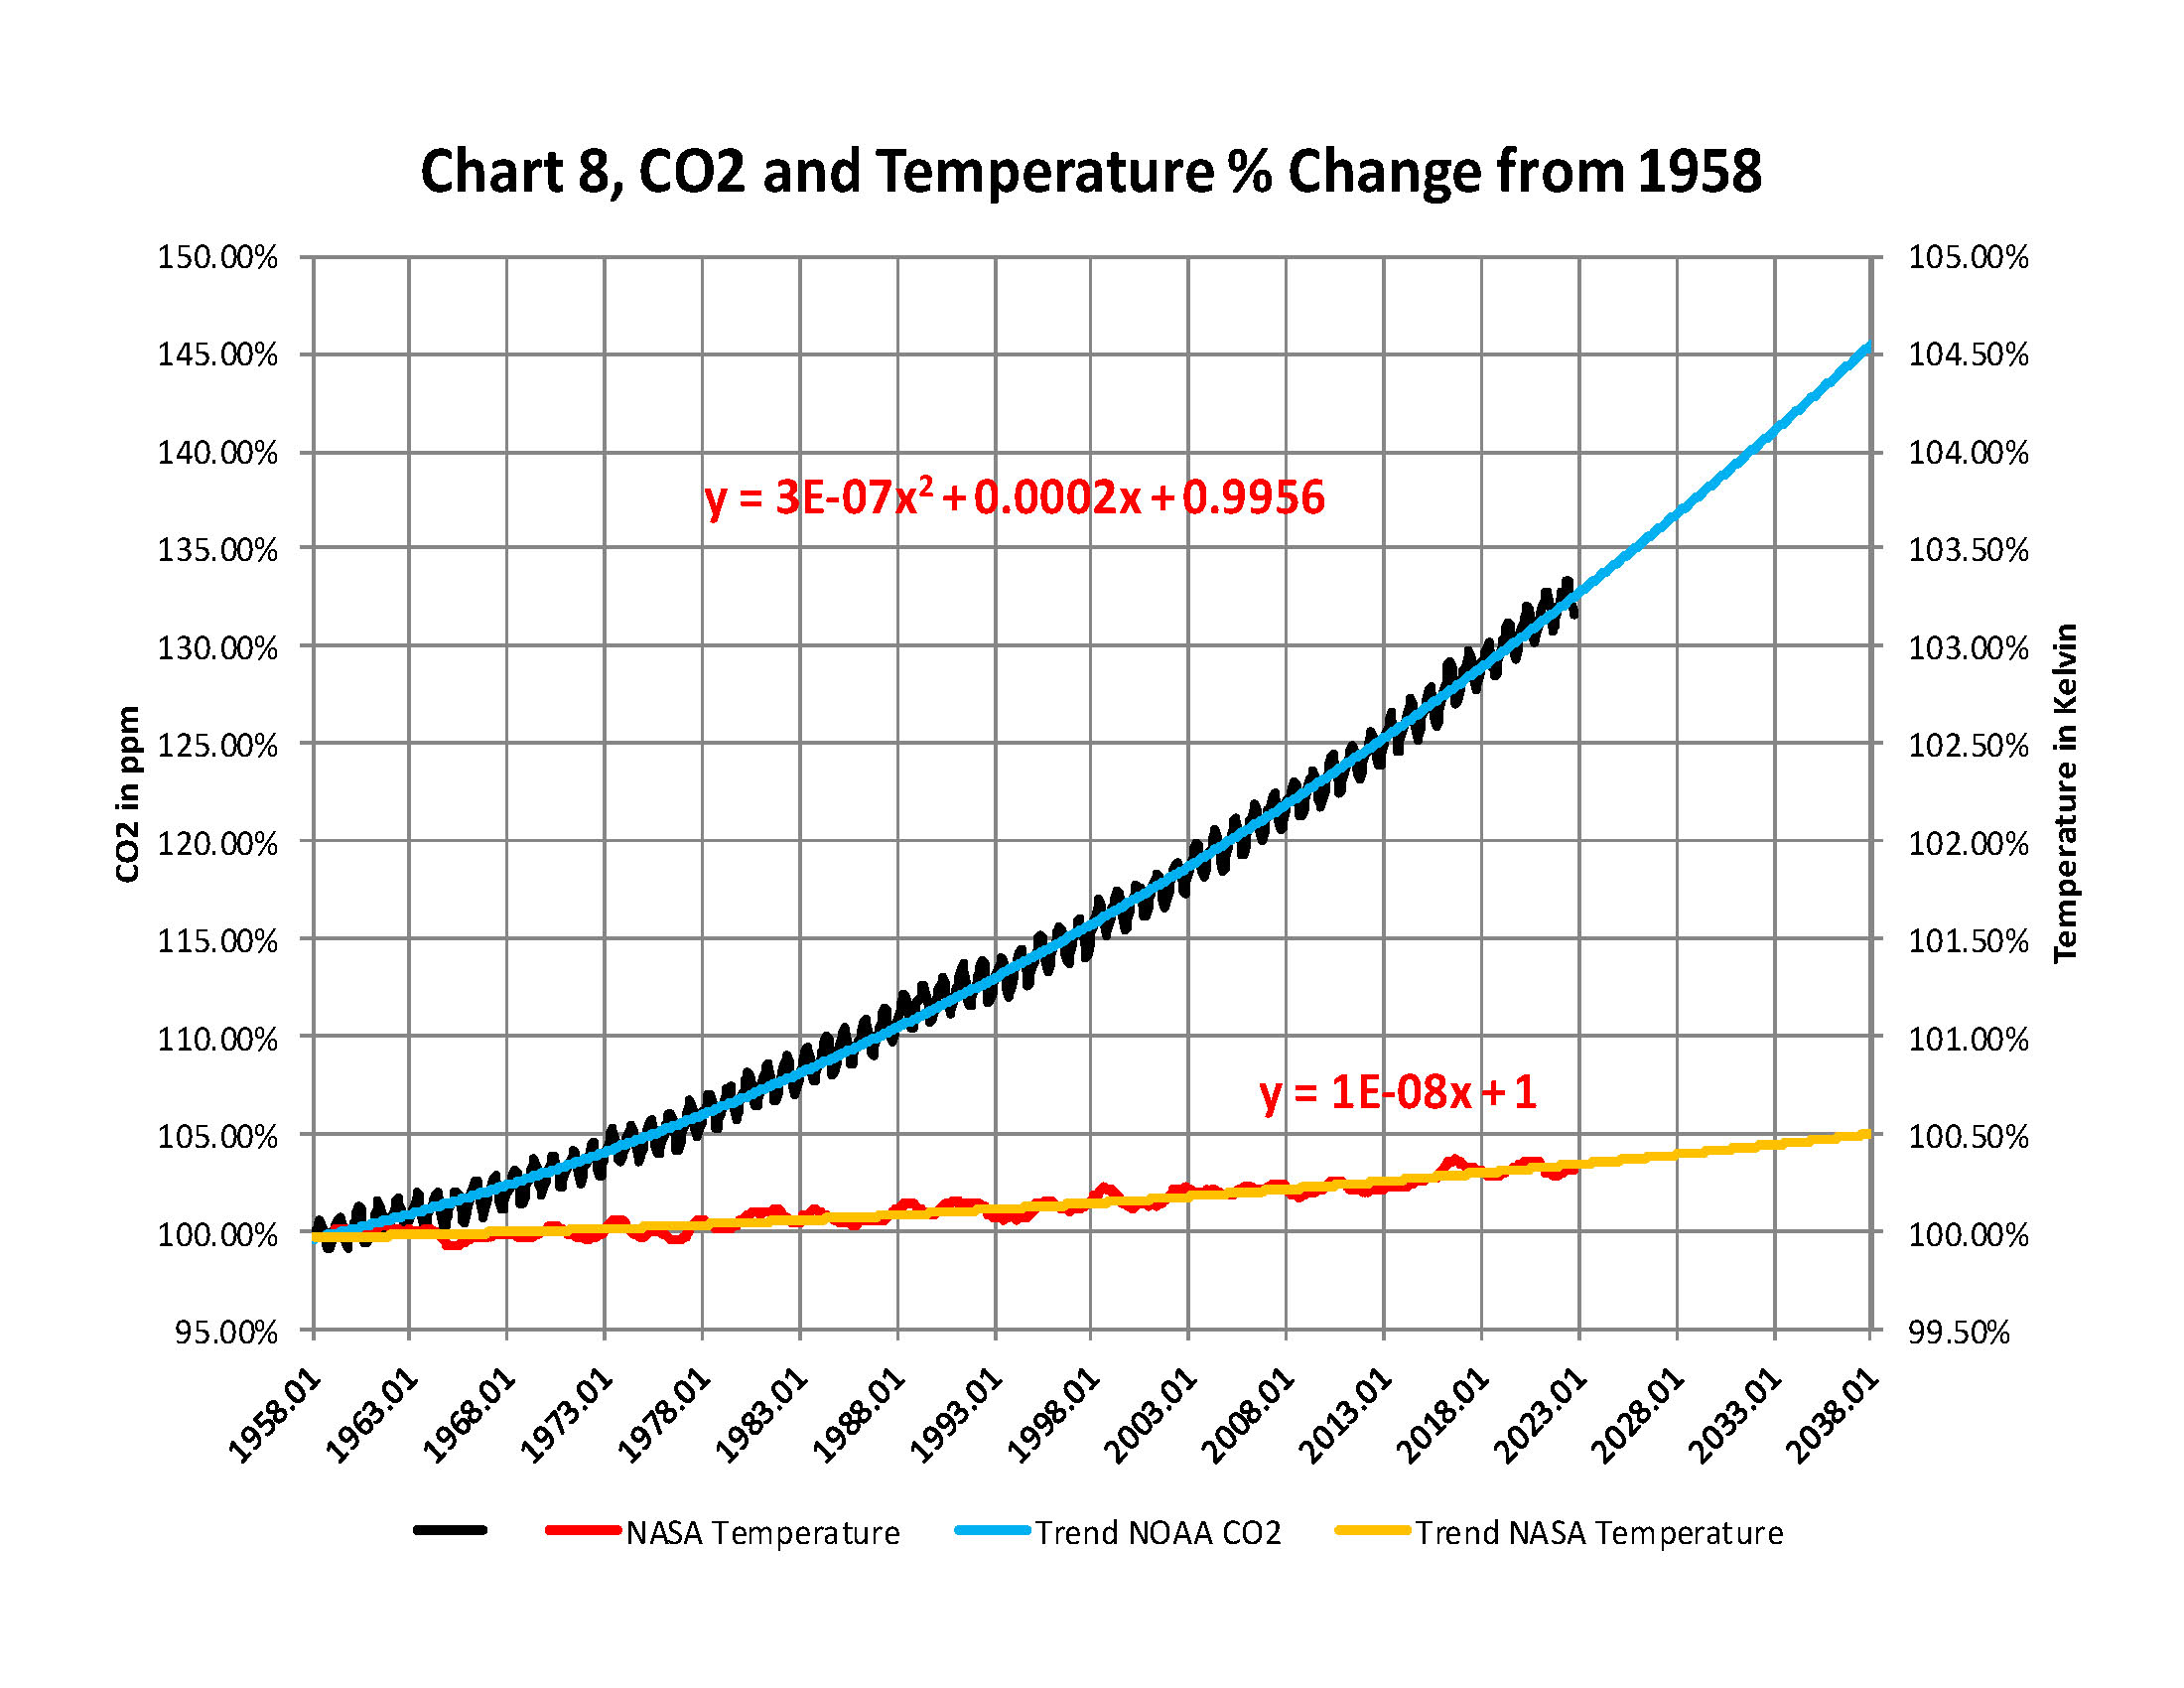
This is Chart 8 which is the same as Chart 8a except for the scales. The scale on the right side had to be expanded 10 times (the range is 50 % on the left and 5% on the right) to be able to see the plot in the same chart in any detail. The red plot, starting in 1958, shows that the thermal energy in the earth’s atmosphere increased by .40%; while CO2 has increased by 32.4% which is 80 times that of the increase in temperature. So is there really a meaningful link between them that would give as a major problem?
Based to these trends, determined by excel not me, in 2028 CO2 will be 428 ppm and temperatures will be a bit over 15.0o Celsius and in 2038 CO2 will be 458 ppm and temperatures will be 15.6O Celsius.
The NOAA and NASA numbers tell us the True story of the
Changes in the planets Atmosphere
The full 40 page report explains how these charts were developed .
Posted originally on the conservative tree house on December 15, 2022 | Sundance
Friends, in the late summer and fall of 2021 CTH warned of massive waves of price increases that would push inflation to record highs. We watched as each wave arrived almost on schedule throughout 2022, and as a direct result of Joe Biden energy and economic policy, prices necessarily skyrocketed.
In essence in 2021 we were warning about the expenditure side of the ledger that all working-class and fixed income families would experience. We advised to take every proactive measure possible to avoid future price increases.
Now, unfortunately, we begin moving those same warnings to the other side of the ledger; because as a natural consequence of consumer checkbook pain, the financial pressure always transfers to the income and employment side of the economic dynamic.
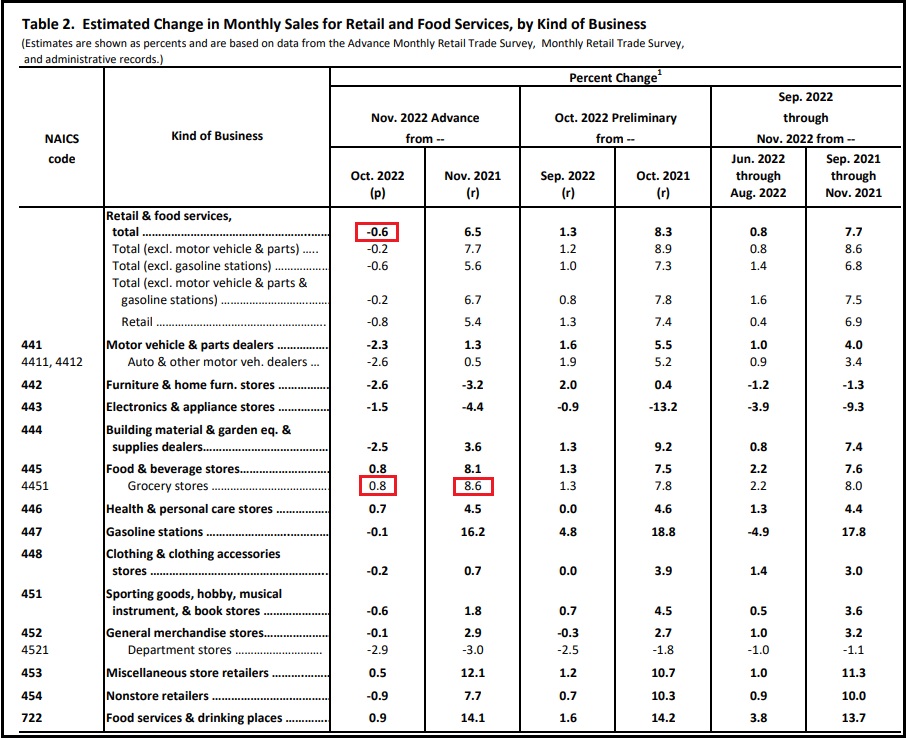
Keep in mind, retail sales are calculated in dollars spent by consumers. November 2022 retail sales as reported by the commerce department today [DATA pdf], reflect a 0.6% decrease in spending vs October. November data includes Thanksgiving, Black Friday and the traditional early holiday shopping. 0.6% less dollars were spent, despite prices being double digits higher than the prior year.
When the prices you are charging for goods and/or services are 10, 20, even as high as 60 percent more than prior year, yet your sales are running flat to negative – that means consumer purchases of those goods/services are substantially lower.
If you were selling 100 widgets for $1 each in 2021, you gross $100. If your widgets now sell for $1.25 and you gross $94 in 2022 sales, you have sold 75 widgets.
In 2021 you sold 100 widgets, in 2022 you sold 75 widgets, a difference of 25 widgets.
Everything attached to the raw material, creation, manufacturing, distribution and sale of those 25 missing widgets is no longer part of the economic activity associated with your widget business. You are now telling your suppliers you don’t need as many widgets, because they are not selling. You have lost 25% of your business in this scenario.
Everything associated with the drop in consumer spending now begins to downsize. Downsizing means less labor needed. This process triggers the economic impact shifting from the consumer sales side of the ledger to the income side of the ledger for employers, employees and workers.
If this consumer spending trend continues, and there is absolutely no reason to think it will reverse, we are entering a phase of serious financial instability for the American worker, at a scale that will dwarf the 2006/’07 and ’08 recession.
I am not a doomsayer pundit on economic matters. I am a proactive planner on economic forecasts. With consumer credit costing more, with fed interest rates climbing, with import orders cancelled, with shipping costs dropping, with consumer spending contracting, with fewer units moving, with inventories climbing, all of the data only points in one direction.
Serious consumer defaults are looming.
Government policy has been hammering the demand side of the economy, proclaiming -falsely- that excessive consumer demand was the cause of inflation. This game of economic pretending is about to get very serious.
Consumer spending, as measured in actual units created and purchased in the economy, has been contracting since the third quarter of 2021 (started June, July, August ’21). Simultaneously, consumer spending as measured in actual dollars spent to purchase food, fuel and energy, has been skyrocketing. This is a supply side inflationary cycle with no soft landing.
(Wall Street Journal) – U.S. retail spending and manufacturing weakened in November, signs of a slowing economy as the Federal Reserve continues its battle against high inflation.
November retail sales fell 0.6% from the prior month for the biggest decline this year, the Commerce Department said Thursday. Budget-conscious shoppers pulled back sharply on holiday-related purchases, home projects and autos. Manufacturing output declined 0.6%, the first drop since June, the Fed said in a separate report.
The Fed on Wednesday raised its benchmark interest rate 0.5 percentage point to a 15-year high and signaled plans to continue lifting rates through the spring. Fed officials have increased rates at the fastest pace since the 1980s to cool the economy and bring down inflation, which is running near a 40-year high.
“Most households are acting strategically, planning for a road ahead that may be more difficult to traverse, with higher interest rates, the housing slump, and ongoing inflation—and the very real possibility of a recession,” said Craig Johnson, president of the retail consulting firm Customer Growth Partners. (read more)
Businesses are going to start cutting expenses in order to survive.
The number one expense for almost all businesses is the labor cost.
Non-essential and high wage labor is going to get removed first.
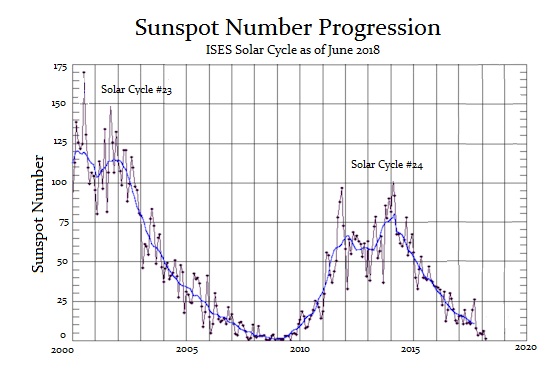
We are now in Solar Cycle 25 with peak sunspot activity expected in 2025. Solar Cycle 24 which ended in December 2019, was of average in length, at 11 years. However, it was the 4th-smallest intensity since regular record keeping began with Solar Cycle 1 in 1755. We’re now in Solar Cycle 25 and we are still in Solar Minimum conditions at this time. Solar Maximum is predicted to occur midway through this cycle which may come as soon as November 2024 but no later than March 2026, with this ideal peak reaching most likely by July 2025.
Right now, the solar wave is conforming more to our model than that of NASA. The Sun has become far more active than NASA has forecast or expected. NASA is beginning to worry that this Solar Cycle 25 could become the Strongest Cycle Since Records Began. Effectively, in terms of our model terminology, Solar Cycle 25 may be a Panic Cycle. In other words, we appear to be headed into the strongest cycle on record following the weakest cycle. That is high volatility in cycle terminology.
So what does this mean for Markets?
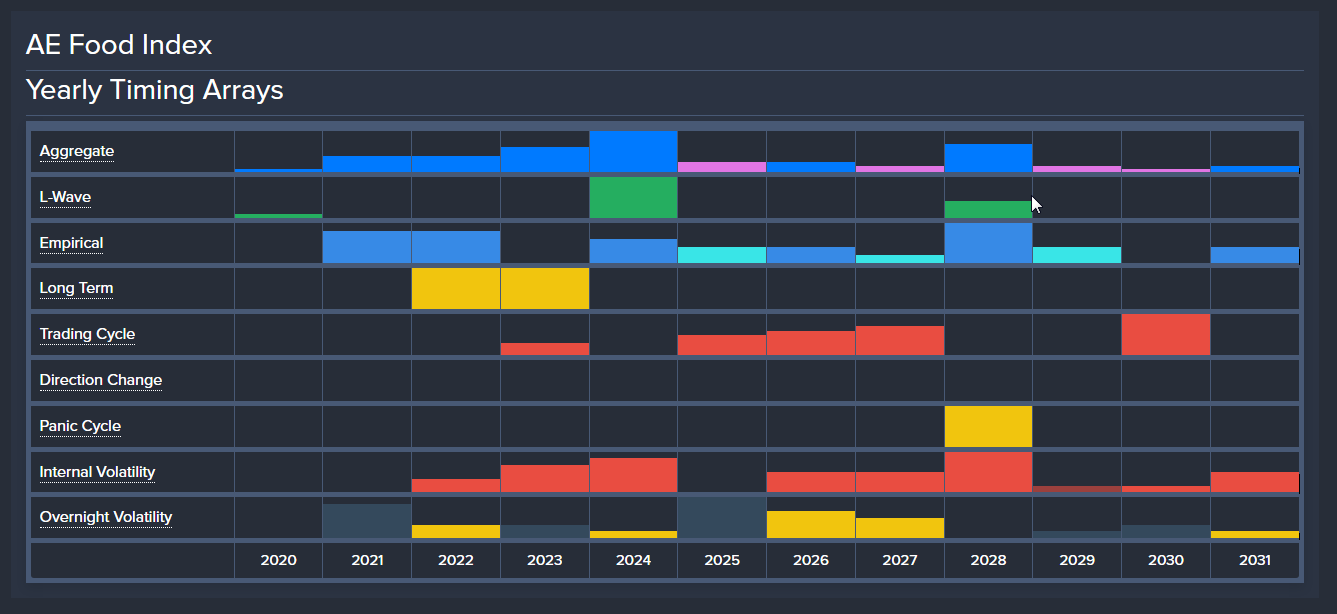
Since this Solar Minimum may continue into 2024, that appears to be a very major turning point on our global food index. Most of our models on markets are showing Panic Cycles in the 2027-2028 time period. That appears to be more war than nature.
I warned that Socrates, which monitors everything around the world, noticed a distinct correlation that more volcanos erupt during Solar Minimum. There have been many studies on the impact of UV and gamma radiation during solar changes and events. Gamma-rays are a form of electromagnetic radiation, as are radio waves, infrared radiation, ultraviolet radiation, X-rays, and microwaves. Gamma-rays can be used to treat cancer, and gamma-ray bursts are studied by astronomers.
I have also reported that our correlation models also show that solar minimums correspond to increased volcanic activity. Volcanic winters take place during solar minimums. It certainly seems that gamma-rays may be the reason volcanoes erupt more during these periods. This certainly also reduces food production and increases disease, presumably because of a rise in malnutrition. However, since gamma-rays are also used to treat cancer, there is at least a basis to warrant further investigation if the increase in gamma-rays during solar minimums impact certain susceptible people or those with particular DNA sequences.
We tend to ignore volcanos since they are not in our backyard. The deadly aspect of these volcanic eruptions is not the loudness of the boom, but how much ash it throws up into the atmosphere which then blocks the sun creating Volcanic Winter.
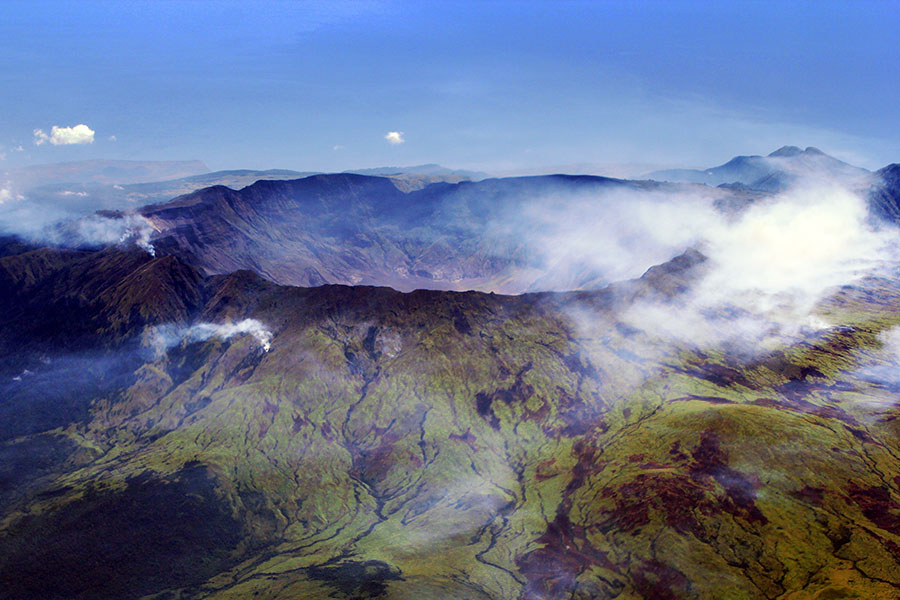
Mount Tambora (VEI 7) erupted in 1816 and threw into the air so much ash that it snowed during the summer in New York City. It became known as 18-hundred-and-froze-to-death. This account from history tells the story that 1816 was a year when the sunlight could not penetrate the natural pollution from Tambora. As a result of a volcanic eruption at Mount Tambora in Indonesia, weather patterns were disrupted worldwide for months, allowing for excessive rain, frost, and snowfall through much of the Northeastern U.S. and Europe in the summer of 1816.
The global cooling altered the natural weather and it resulted in a serious food shortage that set off a mass migration from New England to the Midwest within the USA as people were trying to find the sun. Some saw this as an omen and there was also a religious revival.
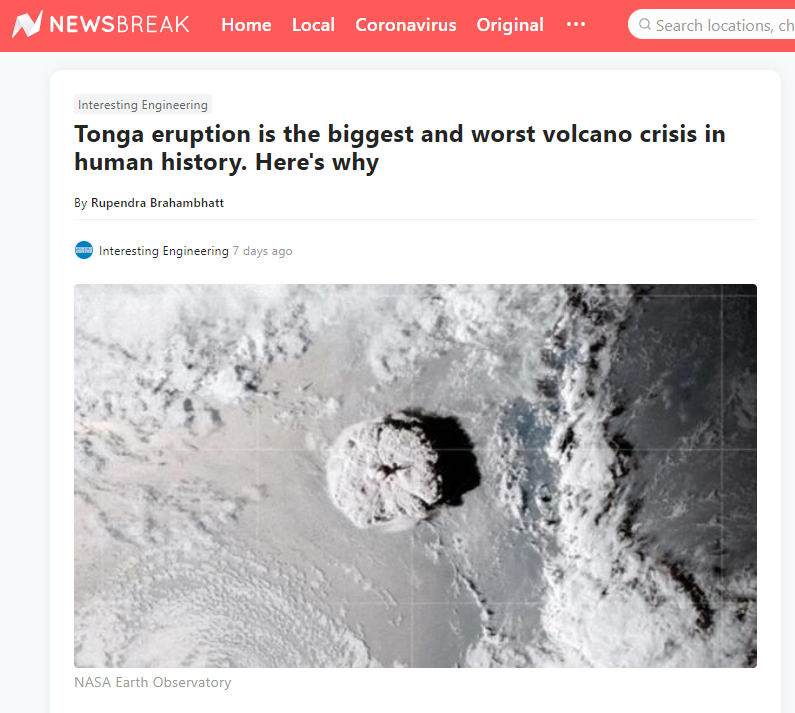
Almost one year has now passed since the Hunga-Tonga-Hunga-Ha’apai volcano erupted (VEI 5). Only now are we starting to realize that this eruption was the biggest volcanic event in human history. They have mapped the 22,000 km(2) area around the Tonga volcano. This has curiously taken place with the weakest solar minimum on record. More significantly, such a major explosion takes about one year before its true impact is understood worldwide.
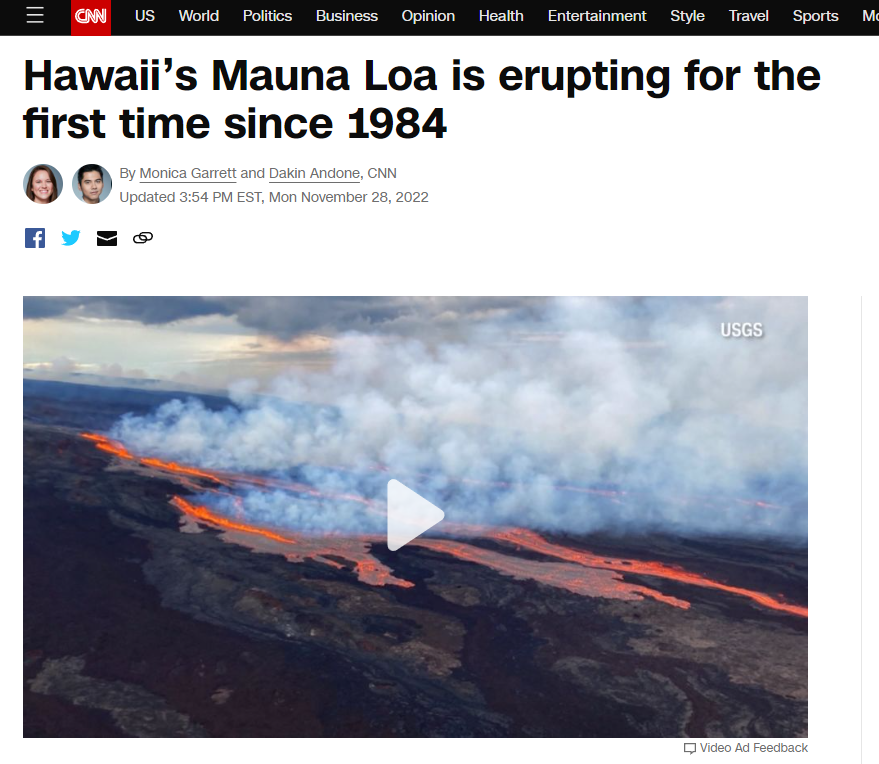
Mauna Loa, which is the largest volcano in the world covers half the island of Hawaii. It has erupted 33 times since 1843 making this an average cycle of 5.4 years. It tends not to be extremely violent as many others. Hawaii’s Mauna Loa has therefore erupted for the first time in decades but nearby, Kilauea is also erupting and both on the archipelago’s Big Island. Dual eruptions haven’t been seen since 1984.
The last eruption took place in 1984, making this prolonged quiet periodthe volcano’s longest in recorded history. More interesting, it is near Kilauea which erupted in 2018. The concern is not this volcano by itself. We are looking around the world at increased volcanic activity for the danger is a volcanic winter coming on top of these shortages manufactured by COVID restrictions.
There has been activity which has been detected in Alaska under what has been an 800-year dormant volcano near Sitka known as Mount Edgecumbe. This volcano was believed to have been extinct since it has not been active for at least 800 years. Earthquakes began earlier this year.
Just in August, in Indonesia, the Anak Krakatau Volcano erupted in Seven Explosions within Two Days. It unleashed 1500-Metre-High Scorching Ash.
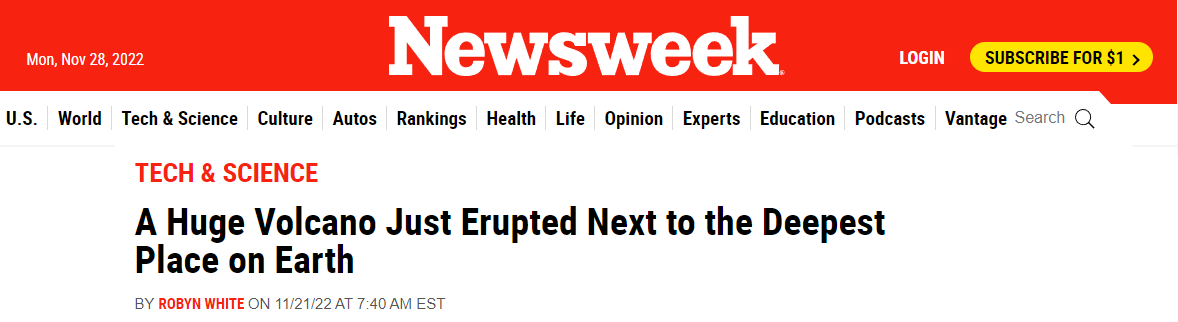
The Ahyi Seamount is the largest submarine volcano which lies 449 feet deep in the Pacific Ocean below the Northern Mariana Islands, which are more than 3,700 miles west of Honolulu.
Meanwhile, over in Italy, the Stromboli volcano has also erupted also during October 2022. Several explosions inside of Italy’s Stromboli volcano sent enormous plumes of smoke into the sky and major streams of lava into the Tyrrhenian Sea over the weekend.
Over in Russia, its Shiveluch volcano has become active and now a powerful explosion is considered possible at any moment. It is one of the largest in the Russian far East volcanos recorded and it has had volcanic ash plume rising up to around 13000ft altitude.
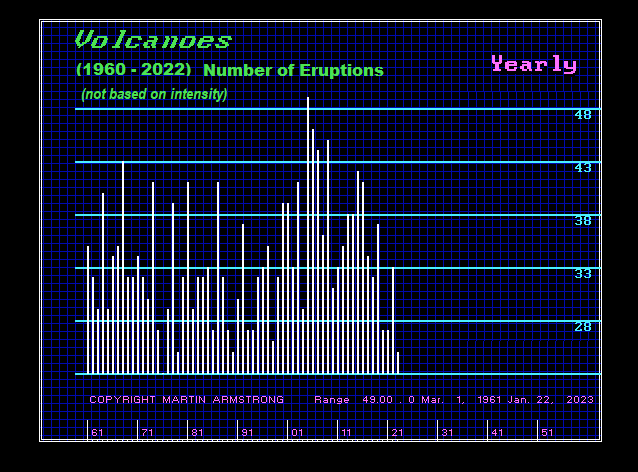
There were 5 eruptions last year around the world at 5 or higher on the Volcanic Explosivity Index (VEI). The first two eruptions here in 2022 were Bezymianny in Russia during May and Popocatépetl in Mexico during June. There was only one in 2020, but 5 during 2019. It appears we are witnessing a rise in global activity that is starting from a general major low in volcanic activity overall.
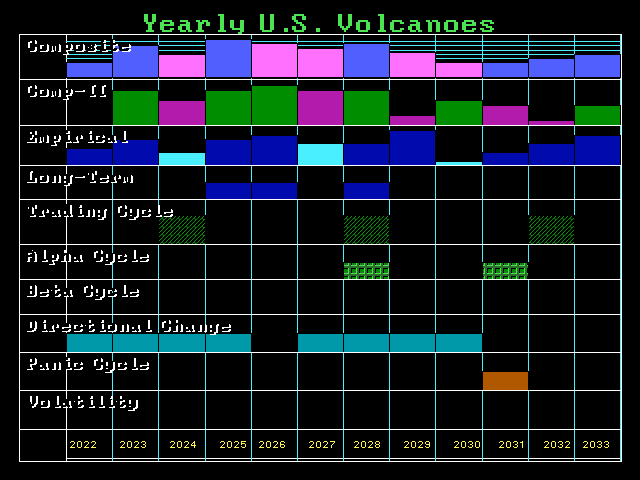
We have a string of Directional Changes between 2022 and 2025. We may be looking at rising volcanic activity into 2025. We will run our models on intensity as well. The undersea Hunga Tonga-Hunga Ha’apai eruption of December 2021 into January 14-15, 2022 was a volcanic explosivity equivalent to VEI 5. It was an eruption of a magnitude greater than the 1991 eruption of Pinatubo in The Philippines. According to a news article, the main undersea international fiber-optic communication cable that had been severed in multiple places due to the eruption had been repaired by February 21, 2022, and internet connectivity was restored the following day.
The sheer magnitudes of this eruption tends to warn that we may in fact witness a very significant rise in both the frequency of eruptions as well as the magnitude into 2025. The VEI describes the size of explosive volcanic eruptions based on magnitude and intensity. The numerical scale (from 0 to 8) is a logarithmic scale, and is therefore similar to the Richter and other magnitude scales for the size of earthquakes.
The largest eruption of magna took place at Yellowstone at Huckleberry Ridge about 2.1 million years ago. Our cycle models on Yellowstone have turned up and the “ideal” target would be in the year 2100. The difference between a VEI5 and VEI6 is a factor of 10 to 100.
Posted originally on the conservative tree house on November 26, 2022 | Sundance
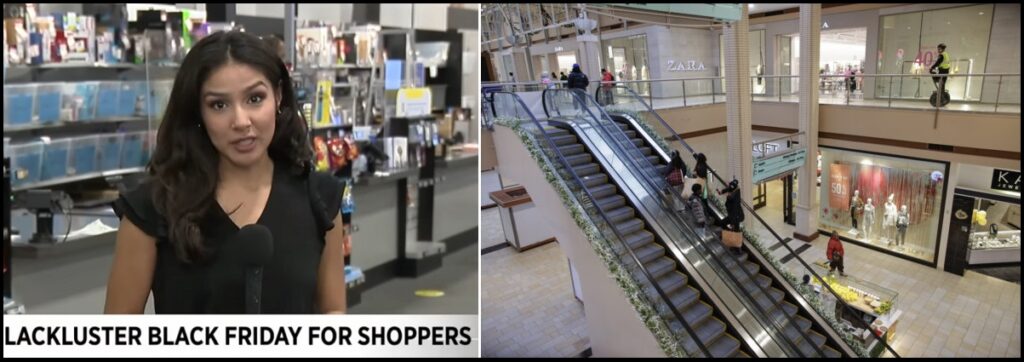
“Crowds? I see nothing. I’m surprised,” retail worker Jeremy Pritchett told FOX 2. “Normally, it’s wrapped all the way around the building. Today: no one.”
That’s the typical ground report from areas all over the country. No one, literally almost no one, is doing any holiday shopping and the traditional Black Friday rush to get deals and discounts just didn’t happen. Financial media are scratching their puzzlers, perplexed with furrowed brows.
Interestingly, almost every financial media outlet is using the same Retail Federation talking point about anticipating an 8% increase in holiday sales this year. Apparently, pretenses must be maintained. Meanwhile, news crews and camera crews are having a desperate time finding any holiday shopping to use as background footage for the claims that sales are strong.
“Look, over there. There’s a person buying something. Oh, wait, no, that’s just an employee dusting the empty cash register.” At a certain point, one would have to believe reality would run head-first into the mass delusional pretending. Maybe this holiday season will be it, maybe not.
Reuters – […] About 166 million people were planning to shop from Thursday’s Thanksgiving holiday through this coming “Cyber Monday,” according to the National Retail Federation, almost 8 million more than last year. But with sporadic rain in some parts of the country, stores were less busy than usual on Black Friday.
“Usually at this time of the year you struggle to find parking. This year, I haven’t had an issue getting a parking spot,” said Marshal Cohen, chief industry adviser of the NPD Group Inc.
“It’s a lot of social shopping, everybody is only looking to get what they need. There is no sense of urgency,” Cohen added, based on his store checks in New York, New Jersey, Maryland and Virginia.
At the American Dream mall in East Rutherford, New Jersey, there were no lines outside stores. A Toys ‘R’ Us employee was handing out flyers with a list of the Black Friday “door buster” promotions. (read more)
It’s almost Kafkaesque to see how the media are continuing to maintain economic pretenses, yet the reality of a completely collapsed consumer economy is physically staring them in the face.
(Bloomberg) – Activity Light at One San Francisco Mall (4:40 p.m.) – At the Stonestown mall in San Francisco, shoppers were few and far between. The Target and Zara stores were mostly empty, and there was no line for the mall’s Santa Claus. Uniqlo and Apple were the busiest locations, but they still weren’t crowded.
[…] Crowds were thin in the late morning at the Stamford Town Center mall. Kay Jeweler, empty. Safavieh, empty. Only a couple of people waited at the checkout line at Forever 21 and just a few were in line for a purchase at Barnes & Noble.
[…] At a Target store on Chicago’s North Side, the parking lot was barely half full at about 9 a.m. local time. Shoppers were greeted with $3 ornaments and discounted Christmas trees when entering, and the store seemed calm and relatively quiet.
[…] The Macy’s in Stamford, Connecticut, was neat and orderly — maybe a little too neat and orderly on a day associated with shopping chaos. The furniture section was nearly deserted, though there were more shoppers looking at shoes. (read more)
Posted originally on the conservative tree house on November 24, 2022 | sundance
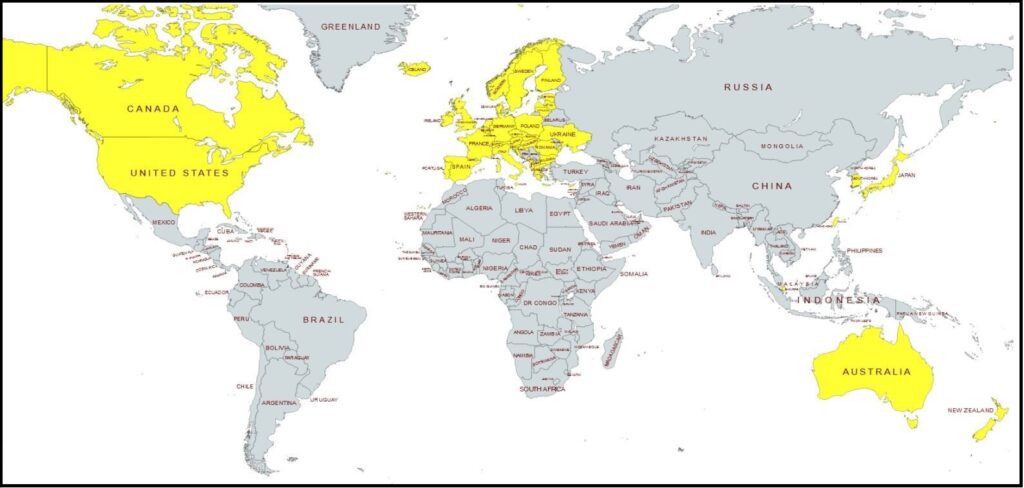
We have been closely monitoring the signs of a global cleaving around the energy sector taking place. Essentially, western governments’ following the “Build Back Better” climate change agenda which stops using coal, oil and gas to power their economic engine, while the rest of the growing economic world continues using the more efficient and traditional forms of energy to power their economies.
Within the BBB western group (identified on map in yellow), the logical consequences are increased living costs for those who live in the BBB zone, and increased prices for goods manufactured in the BBB zone. In the zone where traditional low-cost energy resources continue to be developed (grey on map), we would expect to see a lower cost of living and lower costs to create goods. Two divergent economic zones based on two different energy systems.
This potential outcome just seemed to track with the logical conclusion. The yellow zone also represented by the World Economic Forum, and the gray zone also represented by an expanding BRICS alliance. Against this predictable backdrop we have been watching various events unfold, some obvious and some less so.
Today, we get an obvious example:
NEW DELHI, Nov 24 (Reuters) – Fiat parent Stellantis (STLA.MI) has concluded it can’t currently make affordable electric vehicles (EVs) in Europe and is looking at lower-cost manufacturing in markets such as India, its chief executive told reporters.
If India, with its low-cost supplier base, is able to meet the company’s quality and cost targets by the end of 2023, it could open the door to exporting EVs to other markets, said Carlos Tavares, CEO of the group whose brands also include Peugeot and Chrysler.
“So far, Europe is unable to make affordable EVs. So the big opportunity for India would be to be able to sell EV compact cars at an affordable price, protecting profitability,” Tavares told reporters at a media roundtable in India late on Wednesday.
Stellantis is investing heavily in EVs and plans to produce dozens in the coming decade, but Tavares warned last month that affordable battery EVs were between five and six years away.
On his first visit to India since taking over as Stellantis CEO, he said the company was still working out a plan regarding EV exports from the country and had not yet taken any decisions. (read more)
.
Normally we would expect to see market forces determining the ultimate economic outcome. Historically, we would not expect government policy that puts their nation at an economic disadvantage. However, in this WEF controlled new western economic normal we see multinational corporations’ making decisions and government leaders creating policy to support the corporations.
There is money to be made by corporations within the climate change agenda, and there is money to be made by producing goods with low-cost wages and cheap materials. Eventually, if you keep following this to its natural conclusion, the entire yellow zone becomes a service driven economy.
Multinational corporations in control of government are what the BRICS assembly foresaw when they first assembled during the Obama administration. When multinational corporations run the policy of western government, there is going to be a problem. Brazil, Russia, India, China and South Africa (BRICS) saw President Obama sub-contracting, actually giving away, U.S. trade policy.
In the bigger picture, the BRICS assembly are essentially leaders who do not want corporations and multinational banks running their government. BRICS leaders want their government running their government; and yes, that means whatever form of government that exists in their nation, even if it is communist.
BRICS leaders are aligned as anti-corporatist. That doesn’t necessarily make those government leaders better stewards, it simply means they want to make the decisions, and they do not want corporations to become more powerful than they are. As a result, if you really boil it down to the common denominator, what you find is the BRICS group are the opposing element to the World Economic Forum assembly.
The BRICS team intend to create an alternative option for all the other nations. An alternative to the current western trade and financial platforms operated on the use of the dollar as a currency. Perhaps many nations will use both financial mechanisms depending on their need.
The objective of the BRICS group is simply to present an alternative trade mechanism that permits them to conduct business regardless of the opinion of the multinational corporations in the ‘western alliance.’
Again, if you follow the Build Back Better agenda to its natural conclusion, the entire yellow zone becomes a service driven economy.
The United Nations proposed a new method to funnel money out of developed nations during the COP27 meeting – climate reparations. The United Nations is still negotiating who will pay what, but rest assured, the US will likely pay the most. President Biden fully supports the idea in addition to the $1 billion he was granted last year to fight third-world climate change. China is considered a developing nation, according to the UN, and will not contribute to the global fund despite being the largest polluter in the world.
The ”loss and damage fund,” as it is known, would take money from rich nations in an attempt to change the weather and prevent natural disasters that would take place even if humans did not inhabit Earth. The funds would primarily be sent to countries in Latin America, Africa, and Asia. Fears are sparking that this would act as a confession, and developing nations could sue developed nations and/or businesses for additional compensation.
Trump attempted to get America out of the Paris Accord. The GOP-majority House will likely not vote in favor of this measure. Our best bet is to hope they kick the can down the road until Biden’s term has ended.
From the attached report on climate change for October 2022Data we have the two charts showing how much the global temperature has actually gone up since we started to measure CO2 in the atmosphere in 1958? To show this graphically Chart 8a was constructed by plotting CO2 as a percent increase from when it was first measured in 1958, the Black plot, the scale is on the left and it shows CO2 going up by about 32.4% from 1958 to October of 2022. That is a very large change as anyone would have to agree. Now how about temperature, well when we look at the percentage change in temperature also from 1958, using Kelvin (which does measure the change in heat), we find that the changes in global temperature (heat) is almost un-measurable at less than .4%.
As you see the increase in energy, heat, is not visually observably in this chart hence the need for another Chart 8 to show the minuscule increase in thermal energy shown by NASA in relationship to the change in CO2 Shown in the next Chart using a different scale.
This is Chart 8 which is the same as Chart 8a except for the scales. The scale on the right side had to be expanded 10 times (the range is 50 % on the left and 5% on the right) to be able to see the plot in the same chart in any detail. The red plot, starting in 1958, shows that the thermal energy in the earth’s atmosphere increased by .40%; while CO2 has increased by 32.4% which is 80 times that of the increase in temperature. So is there really a meaningful link between them that would give as a major problem?
Based to these trends, determined by excel not me, in 2028 CO2 will be 428 ppm and temperatures will be a bit over 15.0o Celsius and in 2038 CO2 will be 458 ppm and temperatures will be 15.6O Celsius.
The NOAA and NASA numbers tell us the True story of the
Changes in the planets Atmosphere
The full 40 page report explains how these charts were developed .
Posted originally on the conservative tree house on November 9, 2022 | Sundance
Hurricane conditions are expected from Boca Raton to Flagler/Volusia County line along the coast in Florida tonight. However, do not focus only on the center of the storm. Hurricane winds extend 25 miles from center, tropical storm winds 400+ miles from center, and massive rain are anticipated over central Florida with significant flooding north of Lake O. Residents along coastal and inland waterways should be fully prepared for this storm. Overnight conditions will deteriorate rapidly.
At 1000 PM EST (0300 UTC), the center of Hurricane Nicole was located near latitude 27.0 North, longitude 78.9 West. Nicole is moving toward the west-northwest near 13 mph (20 km/h). A turn toward the northwest is expected on Thursday, followed by a turn toward the north and north-northeast on Friday.
On the forecast track, the center of Nicole will move onshore the east coast of Florida within the hurricane warning area late tonight or early Thursday. Nicole’s center is then expected to move across central and northern Florida into southern Georgia Thursday and Thursday night, and into the Carolinas Friday.
Maximum sustained winds are near 75 mph (120 km/h) with higher gusts. Little change in strength is expected until Nicole makes landfall along the Florida east coast. Nicole is expected to weaken while moving across Florida and the southeastern United States Thursday through Friday, and it is likely to become a post-tropical cyclone by Friday afternoon. (more)
Many of us have spent the past 36 hrs preparing for this storm; however, my gut is telling me many are not ready for the potential flooding from Nicole. Toolboxes and supplies are loaded, and relief/recovery supplies staged south of Lake-O are prepared to move north as needed.
Now, is when the southeast and southcentral east coast needs to hunker down in safe, secure and hardened structures away from the water.
Power is likely to be lost along the coastal and near coastal areas of Florida as well as central Florida north of Lake-O. Stay inside during the storm passing and pay attention to local officials for instructions related to road closures and transit corridors.
East coast of Florida Treepers, if you find yourself in an emergency situation, feel free to reach out in the comment section or email directly.
Keep a good thought, all will be okay.
I know it is unnerving when these storms move in at night, but everything will be okay. Nicole will hopefully pass through quickly, but the rain, ground saturation and potential for flooding may be problematic for several days.
Hurricanes can be frightening; downright scary. There’s nothing quite like going through a few to reset your outlook on just how Mother Nature can deliver a cleansing cycle to an entire geographic region. The sounds are scary. Try to stay calm despite the nervousness. Trees will bend and break; the sounds are dramatic.
If you are near the eyewall, there’s a specific sound when you are inside a hurricane that you can never forget. It ain’t a howl, it’s a roar. It is very unique sound in depth and weight. Yes, within a hurricane wind has weight. Stay clear of windows and doors, and within an interior room of the house or apartment if possible.
That scary roar sounds like it won’t ever quit…. it will… eventually; but at the time you are hunkering down, it doesn’t seem like it will ever end.
A hurricane wind, even a moderate one, is a constant and pure rage of wind that doesn’t ebb and flow like normal wind and storms. Hurricane wind is heavy, it starts, builds and stays; sometimes for hours. Relentless, it just won’t let up. And then, depending on Nicole’s irrelevant opinion toward your insignificant presence, it will stop.
Judging by the forward speed the hurricane force winds will likely last around 2 hours before she lets up.
Meanwhile, tomorrow you might walk outside and find yourself a stranger in your messed up neighborhood. It will all be cattywampus. Trees gone, signs gone, crap everywhere, if you don’t need to travel, DON’T.
I mean CRAP e.v.e.r.y.w.h.e.r.e. Stay away from powerlines.
Try to stay within your immediate neighborhood for the first 36-48 hours. Keep the roadways and main arteries clear for recovery workers, power companies and relief trucks.
Remember, when it is safe to drive, if the power is out – every single intersection must be treated like a four-way stop…. and YOU ARE GOING TO HAVE TO PAY ATTENTION. Even the major intersections.
You’ll need to override your brain tendency to use memory in transit. You’ll need to pay close attention and watch for those who ain’t paying close attention. Travel sparingly, it’s just safer.
Remember, this is important – YOU are the first responder for your neighborhood. Don’t quit. Recovery is a process. Depending on the scale of the impact zone, the process can take days or weeks. Take care of your family first; then friends and neighborhood, and generally make a conscious decision to be a part of any needed solution.
Keep a good thought. Who knows, we might even end up shaking hands.
It might suck a little bit, but it will be okay. Promise.
Posted originally on the conservative tree house on November 8, 2022 | Sundance
The counties with ballot counting issues remain consistent over years until someone steps in and fixes the root cause of the problem, democrat election officials. Nothing destroys election integrity faster than county election problems that repeat in the exact same precincts year after year.
Unfortunately, Maricopa County, Arizona, is one of those regional areas with major election integrity problems each voting cycle, this midterm 2022 election is no different.
According to multiple reports Maricopa County ballot tabulation machines are not working again. Approximately 20% of the ballot tabulation machines in Maricopa County are not working which is causing delays, frustration and voter concern over the integrity of the election. Voters have been told to leave their ballots in a box for tabulation later at a central location. Many voters are not willing to ‘trust’ the process.
ARIZONA – Vote-counting machines weren’t working in about 20% of polling sites in Maricopa County, Arizona, as Election Day voting in the midterms began, county officials said.
The Maricopa County Recorder’s Officer said technicians were called to fix the tabulator machines that weren’t working, Fox10’s TV station in Phoenix reported. It’s not clear how many of the machines were malfunctioning in the state’s most populous county.
“About 20% of the locations out there where there’s an issue with the tabulator … they try and run (completed ballots) through the tabulator, and they’re not going through,” Maricopa County Board of Supervisors chairman Bill Gates said in a video posted on Facebook. Long lines of voters were appearing throughout the county as officials tried to reassure people that all votes would be counted. (read more)
STAY IN LINE and VOTE!
Arizona,
We have the best election integrity lawyer in the country.
If you’ve *checked in* at a Maricopa County voting location where tabulators don’t work, you should *not* leave & go to another location without casting a vote. Your provisional ballot at new location likely will not count/cont’d/
If you’ve *checked in* at a Maricopa County voting location where tabulators don’t work, you should *not* leave & go to another location without casting a vote. Your provisional ballot at new location likely will not count/cont’d/
4/ and if you are leaving your ballot in the box to be tabulated later, we have trained Republican volunteers who will follow and track the transportation of these ballots and monitor their counting. This was pre-arranged given prior issues in Maricopa County. Do VOTE!
I have created this site to help people have fun in the kitchen. I write about enjoying life both in and out of my kitchen. Life is short! Make the most of it and enjoy!
This is a library of News Events not reported by the Main Stream Media documenting & connecting the dots on How the Obama Marxist Liberal agenda is destroying America