Texas Authorities Urgently Beg Residents to Turn Off Air Conditioning Because There is No Wind to Power the Windmills


Posted originally on the conservative tree house on July 11, 2022 | Sundance 

This is not The Onion or any form of spoof.  This is real life, and it is happening today.

Amid a heatwave throughout most of Texas, The Electric Reliability Council of Texas, or ERCOT, is urgently asking Texas residents to conserve electricity because “it has projected a shortage in energy reserves Monday “with no market solution available.” Voluntary conservation is needed between 2 p.m. and 8 p.m. Monday.”

The problem, as the Texas power authorities have identified it, is outlined via NBC News:

According to ERCOT, factors driving the need for this important action by customers:

    • Record high electric demand. The heat wave that has settled on Texas and much of the central United States is driving increased electric use. Other grid operators are operating under similar conservative operations programs as ERCOT due to the heatwave.
    • Low wind. While solar power is generally reaching near-full generation capacity, wind generation is currently generating significantly less than what it historically generated in this time period. Current projections show wind generation coming in less than 10 % of its capacity.

Conservation notifications are issued when projected reserves may fall below 2300 MW for 30 minutes or more, according to ERCOT. (link)

I Feel Like I’m On A Debt Treadmill And It’s Never Ending!


The Ramsey Show – Highlights  Published originally on Rumble on  July 8, 2022

I Feel Like I’m On A Debt Treadmill And It’s Never Ending!
Subscribe and never miss a new highlight from The Ramsey Show: https://www.youtube.com/c/TheRamseyShow?sub_confirmation=1

The Transition from Fossil Fuel to Wind and Solar


An engineering study on the timing of the proposed change in our form of energy generation. Written on July 3, 2022 by Centinel

With the transition out of fossil fuels into green energy now well underway, there will be an unavoidable lag in available energy. The reason for this is that the solar panel fields being built and the wind turbines installations are both occurring at a rate way too slow to keep up with the reduction of fossil fuel production that is already being implemented. The energy gab is what is driving the price of fuel (gasoline and Diesel) up.

 Approximately, 88% of U.S. energy is from Petroleum, Natural Gas, Coal, and Nuclear and of the remaining 12% is from all other sources, but only 4% of that is Solar and Wind. The other 8% is hydroelectric and biomass; which I’m not sure they really count if you want zero CO2 emissions by 2030.

To reach that goal of zero CO2  means we have to get rid of 88% of the existing US generating capacity and increase the Solar and Wind from 4% to 88% or 22 times the existing solar and wind capacity. The issue is that to keep everything running we need to install the green energy first and then cut out the fossil fuels in proportion to the increase of the green energy; for example look at this approximation below based on The US Energy Information Administration (EIA) June 2022 report for the year 2021 above.

Year   Solar Wind    Coal, Oil, Natural Gas

2022        4%                  88%

2024        25%                66%

2026        46%                44%

2028        67%                22%

2030        88%                0%

If the Coal, oil and natural gas production is removed faster than the Green Solar and Wind capacity is increased than blackouts of increasing duration will result and the economy will shut down. It is basic engineering and not political. The politicians tell us the science is settled on Climate change and this has to be done and if that is true then to get to zero CO2 by 2030 the previous numbers must be followed, the engineering to accomplish that goal is also settled, This issue with politicians is they are not capable of making rational decisions on major projects just like they are also not capable of winning a war i.e. Vietnam under President Johnson and WW II Germany under Hitler. It’s a basic rule in The Art of War that the king or ruler must let the generals run the war. Here in the U.S. the politicians are not letting the engineers run the conversion.

The politicians decided to reduce the U’S’ production of fossil based fuel when they took over and that started the price increase on day one, January 20, 2021, of the Biden Administration. There are two kinds of inflation product supply and excess demand. If supply goes down and demand is constant, the price goes up. On the other side if demand goes up and supply does not then that drives up the price from the demand side.

In the current U.S. case its primarily supply shortages of gasoline and diesel coupled with increased demand as we came out of the COVID economics issues. Since everything moves by truck or rail, the price increases of diesel affects everything.

A Technical Study of Relationships in Solar Flux, Water and other Gasses in the upper Atmosphere, Using the May, 2022 NASA & NOAA Data


From the attached report on climate change for May 2022 Data we have the two charts showing how much the global temperature has actually gone up since we started to measure CO2 in the atmosphere in 1958? To show this graphically Chart 8a was constructed by plotting CO2 as a percent increase from when it was first measured in 1958, the Black plot, the scale is on the left and it shows CO2 going up by about 32.0% from 1958 to May of 2022. That is a very large change as anyone would have to agree.  Now how about temperature, well when we look at the percentage change in temperature also from 1958, using Kelvin (which does measure the change in heat), we find that the changes in global temperature (heat) is almost un-measurable at only .4%. As you see the increase in energy, heat, is not visually observably in this chart hence the need for another Chart 8 to show the minuscule increase in thermal energy shown by NASA in relationship to the change in CO2 Shown in the next Chart using a different scale.

This is Chart 8 which is the same as Chart 8a except for the scales. The scale on the right side had to be expanded 10 times (the range is 50 % on the left and 5% on the right) to be able to see the plot in the same chart in any detail. The red plot, starting in 1958, shows that the thermal energy in the earth’s atmosphere increased by .40%; while CO2 has increased by 32.0% which is 80 times that of the increase in temperature. So is there really a meaningful link between them that would give as a major problem?

Based to these trends, determined by excel not me, in 2028 CO2 will be 428 ppm and temperatures will be a bit over 15.0o Celsius and in 2038 CO2 will be 458 ppm and temperatures will be 15.6O Celsius.

The NOAA and NASA numbers tell us the True story of the Chan ages in planets Atmosphere

The full 40 page report explains how these charts were developed .

Canada Completes Construction of Manufacturing Facility to Make Food from Bugs


Posted originally on the conservative tree house on June 20, 2022 | Sundance 

I’m not sure how everyone feels about this new effort to make bugs into food for humans, but everything about it seems weird.   A Canadian company is now celebrating the opening of a manufacturing facility in Ontario what will generate 9,000 metric tons of crickets for people to eat.

I will not be eating the bugs, slugs or any other creepy crawling critter regardless of “protein transfer efficiency.”  Nope. Not happening.

(CANADA) – On May 26th, Aspire Food Group announced that it has completed construction of its alternative protein manufacturing facility. London, Ontario is now home to the world’s largest cricket production facility.

Aspire’s new plant will reportedly produce 9000 metric tons of crickets every year for human and pet consumption. That’s about two billion insects to be distributed annually across Canada and throughout the United States.

Aspire also reports that it already has orders for the next two years.

Crickets are currently being explored as a protein-rich superfood. They contain fibre and are already found in grocery stores and restaurants, and have a smaller environmental footprint than traditional protein sources. (read more)

There it is, Samsung Signal Flare, Demand Side Contraction, Inventories Too High, Request Suppliers Stall Shipments


Posted originally on the conservative tree house June 16, 2022 | Sundance 

We have been waiting for the non-essential durable goods side of the manufacturing sector to start showing evidence of demand side contraction in consumer purchases.  There have been subtle sector-by-sector indicators of consumer spending shifts for several months; however, today we get the direct evidence from Samsung.

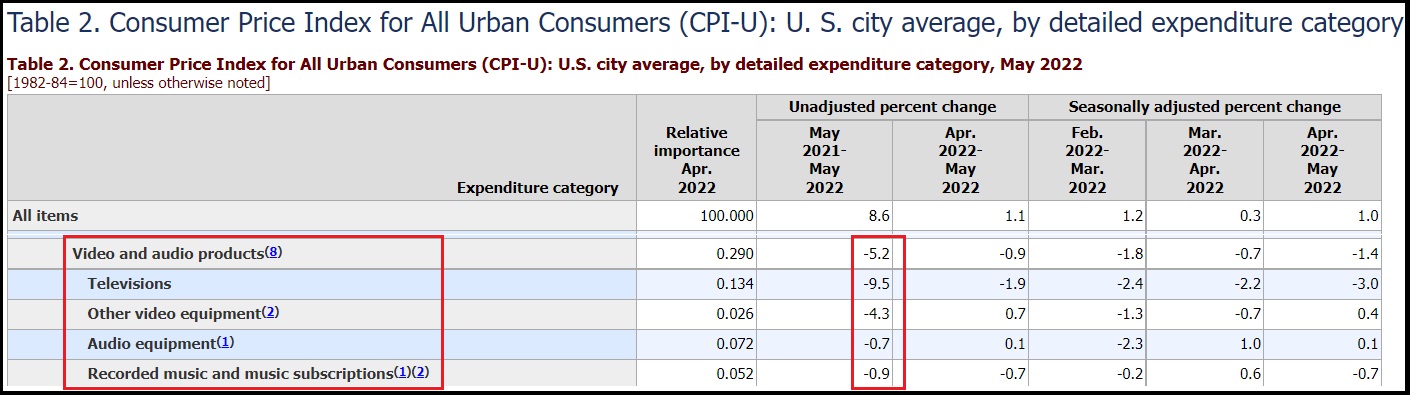
Samsung is one of the leading manufacturers of consumer electronics and products that require chips.  For three months the electronics sector has shown background signals that inventory was not moving.  One of the more recent indicators of a demand side contraction was the lack of upward price pressure inside the electronics sector.  Essentially, consumers are not purchasing the current inventory, so prices are actually dropping in this segment.  [SEE TABLE 2, CPI Chart]:

Despite overall inflation of 8.6% within the CPI, deep inside the category indexes you will note that electronic prices are actually dropping.  Televisions -9.5%, Video equipment -4.3%, etc.  Video and audio products overall dropped in price 1.4% for May, and dropped 5.2% year-over-year.

The supply chain in this sector is lengthy. Meaning inventory builds slowly as consumers stop purchasing in the USA.  Retail store inventory turns slow, store inventory climbs, then warehouses inventories climb as stores do not need product. The negative boxcar effect travels back to the manufacturer overseas over the course of several purchase cycles.  Eventually, everyone within the sector is telling the supplier we do not need product.  Then the manufacturer has to quickly slowdown raw material.

Due to lengthy supply chains, including trans-pacific shipments, the process to stop deliveries in this electronic goods sector is around 90-days before the drop in retail sales reaches the manufacturer to stop production.  Here is the announcement from Samsung:

TAIPEI/ SEOUL — Samsung Electronics is temporarily halting new procurement orders and asking multiple suppliers to delay or reduce shipments of components and parts for several weeks due to swelling inventories and global inflation concerns, sources have told Nikkei Asia.

The notification by the South Korean tech titan applies to components for multiple key product lines, including TVs, home appliances and smartphones, four people familiar with the situation said, and the postponement of orders involves a wide range of components across chips, electronics parts and final product packages.

The move by Samsung, the world’s No. 1 smartphone and TV maker and one of the leading home appliance providers, is the latest sign that electronics makers are pessimistic about the economic outlook amid global inflation risks.

Samsung told suppliers that the company needs to closely review its inventory levels of both components and final products to ensure stock on hand is manageable, according to the sources. Two people said the move will last until the end of July. One of the people said shipments from that source’s company have not been completely halted but the volume of the company’s planned shipment to Samsung for July has been slashed by 50%.

Samsung’s inventory assets reached 47.6 trillion won ($36.9 billion) at the end of March, up from 41.4 trillion won in December, according to its first quarter earnings report. The ratio of inventory assets to total assets also jumped to 10.8% from 9.7% during the same period. (read more)

Various Wall Street economists and MSM pundits have stated, erroneously – and many intentionally, there has been no evidence of a demand side contraction.  However, CTH reviews of the data have shown exactly the opposite.  There are multiple indicators of demand side contraction, including drops in retail sales units that goes all the way back to last holiday season.

Yesterday the U.S. Dept of Commerce released the May retail sales [pdf DATA HERE], showing a 0.3% drop in retail sales for the month.

Retail sales -as measured in units purchased- have been in a contracting position since June of 2021.  When the current data shows a drop of -0.3% in May, the actual drop in retail sales is much, much greater.  The dept of commerce calculates retail sales in dollars.  When prices are 20% higher and sales are low, retailers are selling less stuff (fewer units) at higher prices.  This has been the reality of our economy for several months.  This is also why productivity has been declining for more than a year.

If you take the 8.6% inflation rate (far understated) and an aggregate drop in sales of 0.3% (again, far understated as a measure of inflation), that means consumers are spending limited incomes on critical or essential purchases like housing, food, fuel and energy.  Consumers are not purchasing durable goods; people are hunkering down.

Yearly retail sales (May ’21 compared to May ’22) are +8.1%.  However, yearly retail inflation for the same period is +8.6%.  Again, reflecting that less stuff is being purchased inside the economy at higher prices.  If the commerce dept was measuring actual units being purchased, we would be seeing massive drops in sales.

Samsung is reacting to a demand side contraction.

The New G8


Armstrong Economics Blog/Politics Re-Posted Jun 16, 2022 by Martin Armstrong

Russia has created a new alliance that many are calling the “new G8.” Russia was expelled from the original Group of Eight in March 2014, following the annexation of Crimea. Russia stated that it did not care about the snub. “All the economic and financial questions are decided in G20, and G8 has the purpose of existence as the forum of dialogue between the leading Western countries and Russia,” Russian Foreign Minister Sergey Lavrov stated. There is no dialogue between the major Western superpowers in Russia at this point in time. Former President Obama’s ambassador to Russia, Michael McFaul, went as far as saying that the West must insure Russia has “no real allies.”

Due to backfiring sanctions, Russia certainly does have allies and has created a new G8 for good measure. Vyacheslav Volodin, head of the State Duma, stated the following:

“The economies of the United States, Japan, Germany, Britain, France, Italy, and Canada continue to collapse under the pressure of sanctions against Russia.

The breakup of existing economic relations by Washington and its allies has led to the formation of new points of growth in the world.

The group of eight countries that do not take part in the sanctions wars – China, India, Russia, Indonesia, Brazil, Mexico, Iran, Turkey – is 24.4 per cent ahead of the old group in terms of GDP per capita.”

Volodin said that the seven named countries are interested in developing “mutually beneficial relations with Russia,” and have already seen economic progress despite ongoing sanctions. Putin has also said that he would like to collaborate with emerging economies such as certain African nations that are “still sleeping, but about to wake up.”

The plan to divorce Russia from the world economy has backfired. Russia is increasing its international partnerships and trade as a direct result of the policies aimed at isolating it from the world.

Production Prices Continue Exceeding Current Consumer Prices, Meaning Higher Prices Still Coming


Posted originally on the conservative tree house on June 14, 2022 | Sundance 

The “Producer Price Index” (PPI) is essentially the tracking of wholesale prices at three stages: Origination (commodity), Intermediate (processing), and then Final (to wholesale). Today, the Bureau of Labor and Statistics (BLS) released the May 2022 price data [Available Here] showing another 10.8% increase year-over-year in Final Demand products at the wholesale level.

The inflation within the total goods supply chain continues to accumulate at a more significant rate than the finished goods on the store shelves.  This means replacement goods will continue arriving with higher prices than current.   Final demand goods in May were 1.4% higher than April (16.8% annualized).  And the May year-over-year prices show a 10.8% increase [See Table A].  However, there’s more trouble ahead:

More troubling than the final demand price increases (wholesale finished goods), are the price increases in the intermediate goods and unprocessed raw materials.

Intermediate processed goods increased 2.3% in May (27.6% annualized).  The intermediate unprocessed goods, raw materials, jumped even higher in price at 6.3% for May (that’s a whopping 75.6% annualized increase).   It would appear the raw materials coming into the goods sector are coming in with even higher built-in energy costs than most people anticipated.

Once those intermediate products reach the final demand stage (wholesale), the cumulative price increase will mean even higher consumer prices.

(VIA ABC) – WASHINGTON — U.S. producer prices surged 10.8% in May from a year earlier, underscoring the ongoing threat to the economy from inflation that shows no sign of slowing.

Tuesday’s report from the Labor Department showed that the producer price index — which measures inflation before it reaches consumers — rose at slightly slower pace last month than in April, when it jumped 10.9% from a year earlier, and is down from an 11.5% yearly gain in March.

On a monthly basis, producer prices climbed 0.8% in May from April, above the previous month, when they increased 0.4%.

Energy prices, led by gas, rose 5% just in May from April. Another big driver of the price gains last month was a sharp 2.9% increase in the cost of truck freight hauling, a sign that supply chain problems still aren’t fully resolved. Food costs were unchanged.

The figures indicate that rising prices will continue to erode Americans’ paychecks and wreak havoc on household budgets in the coming months. Inflation has created major political headaches for President Joe Biden and congressional Democrats and has forced the Federal Reserve into a series of rapid interest rate hikes intended to slow the economy and cool price increases. (read more)

Another Strike Against Cryptos


Armstrong Economics Blog/Corruption Re- Posted Jun 14, 2022 by Martin Armstrong

I’ve said it before and will say it again – cryptocurrencies are not a safe investment. I know it is not a popular opinion; people have had success with trading. The problems with cryptocurrencies: (1) they depend entirely upon the government; with the stroke of a pen, they can all be seized; (2) they depend upon a power grid; (3) they also become dependent upon others accepting them.

A fourth all too common issue is that crypto trading platforms can prevent people from trading with little or no explanation. Binance recently announced that users are not permitted at this time “due to a stuck transaction causing a backlog.” CEO Changpeng Zhao stated on Twitter that the issue would be fixed in under 30 minutes. Later in the day, he said the issue would “take a bit longer to fix than my initial estimate,” but would only impact the Bitcoin network. Uncoincidentally, this sudden system glitch occurred after bitcoin fell by 10% beneath the $24,000 level.

This happens more than they would like people to believe. A few years back, a friend of mine was blocked out of their Bittrex account as soon as one of their cryptos began crashing. At one point, Bittrex suspended and eliminated numerous accounts in 2017, and it took them days to respond. They claimed the issue was a “compliance review,” as these platforms can seemingly make up any excuse they please. During that instance, they did not even inform users before they were locked out of their accounts. Unpopular opinion but the fact of the matter is that cryptos are seriously flawed.

Credit Card Debt on the Rise


Armstrong Economics Blog/USA Current Events Re-Posted Jun 14, 2022 by Martin Armstrong

The various handouts and moratoriums during the pandemic drove the personal savings rate down to World War II levels. Everything was closed – there weren’t many opportunities to spend. US consumers paid off a record $83 billion in credit card debt during the pandemic, but that has all come crashing down.

The Federal Reserve reported that revolving credit card debt in April reached $1.103 trillion, surpassing pre-pandemic levels and spiking 20% from the year prior. Credit card balances reached an alarming $841 billion in the first three months of this year alone, and the Fed expects that figure to continue rising due to the unsustainable price of living. In addition, household debt is now close to $16 trillion after consumer debt spiked 1.7% in Q1.

Unfortunately for those already behind, the rising interest rates will only cause them to carry a higher balance of debt. Once the prime rate rises, credit card companies will follow. The APR on credit cards is already 16.61%, nearing the high of 17.87%, on average, but is expected to rise. Debt can easily become a vicious cycle from which there is little escape for the average person. Those who budgeted in the belief that Biden would actually cancel their student debt were misled if not gullible. As housing, food, gas, and other necessities rise, those who are already void of liquid assets will find themselves in a dire situation.