Evidence is surfacing that the military was engaged in domestic surveillance in Britain as well as Canada of anyone who was a critic of the COVID lockdowns. It is very clear that there was no historic precedent whatsoever for locking down all of society for a virus that was not even lethal beyond the normal flu virus. All the data coming out on the fatalities and injuries surrounding the vaccines is another issue altogether.
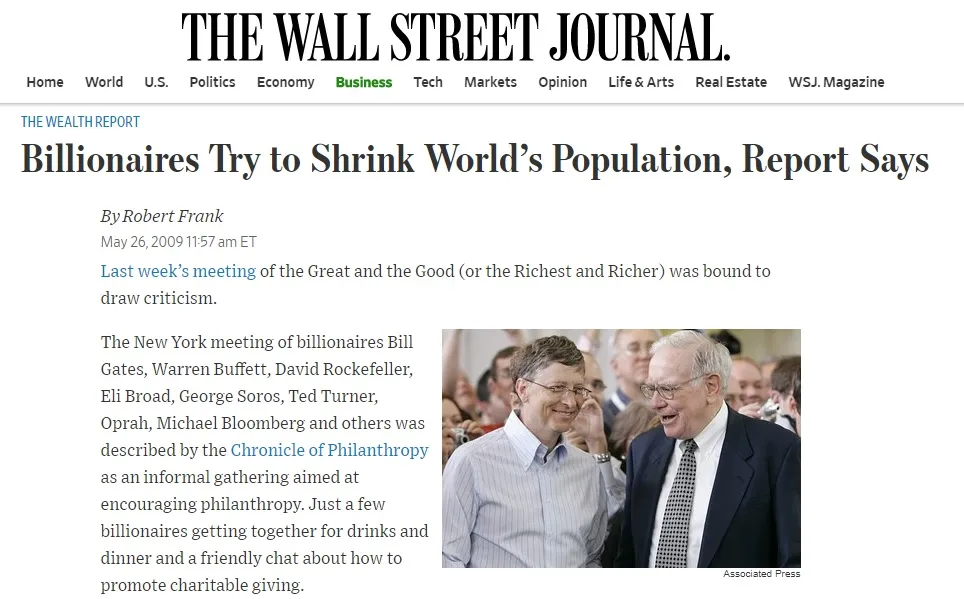
There, the conspiracy theories have suggested that Pfizer has been behind a plot to actually reduce the population which has been a pet project of Bill Gates. It certainly does not do well for society as a whole when our fearless leaders hand absolute immunity to Pfizer to actually kill or maim as many people as they desire all because they did not take the time to really test their vaccines. I choose not to be vaccinated simply because once the government got involved by mandating, there was something seriously wrong and I have spent enough time behind the curtain I know politicians earn a couple hundred grand a year but manage to retire as multi-millionaires. Once the government gets involved, never trust anything. They do not prosecute themselves.
As far as the surveillance is concerned, they have no doubt assembled lists of those of us who resist the tyrannical decrees of the government. Those who resist being mindless drones are a threat to the survivability of the government. Hence, the lockdowns were a perfect way to sort out those who have a brain, and others who are just gullible and think the government is the adult version of Santa Claus. We are all on some secret list, that much we can count on. It has never been a Government of the People, but a Government Against the People as history has always shown for 6,000 years. It’s just all part of 2032.
Posted originally on the CTH on January 30, 2023 | Sundance
This is a topic we have covered extensively, and it is great to see Tucker Carlson questioning the sudden alignment of various elements that are creating a very real food insecurity problem.
The #1 factor in the shortage of food production is the newly emboldened ‘western energy policy‘ and the impact energy has on everything from field (fertilizer) to fork (distribution). Other factors include government policy that blocks food development (Dutch, Irish and Sri Lanka Farmers), a sudden uptick in food facilities having major fires and damage, and a series of issues with the feed that goes into the production of proteins.
This is all happening as the advancement of insects as a more “sustainable” protein replacement is being advanced by the same western governments. However, if you happen to notice that all of the issues travel in the same direction, you are a conspiracy theorist, or something. WATCH:
We have been watching the predictable outcomes surrounding the western government shift to change energy policy for almost two years. Approximately a year ago we first said, “the absence of food will change things.”
As energy resources like natural gas were curtailed the resulting price increase and subsequent shortage of fertilizer was discussed in great detail well in advance.
Now, we are starting to see exactly what those warning voices were talking about.
An interesting article in ZeroHedge Saturday [SEE HERE] draws attention to how the media can no longer try to ignore the created global food crisis.
ZeroHedge – People on the other side of the planet are dropping dead from starvation right now, but most people don’t even realize that this is happening. Unfortunately, most people just assume that everything is fine and dandy. If you are one of those people that believe that everything is just wonderful, I would encourage you to pay close attention to the details that I am about to share with you. Global hunger is rapidly spreading, and that is because global food supplies have been getting tighter and tighter.
If current trends continue, we could potentially be facing a nightmare scenario before this calendar year is over. (read more)
The article then goes on to detail the issues and food shortages in Pakistan, India and the entire African continent. Factually, according to media reports on the region, the worst food crisis in history is happening – yet most U.S. and European Union media are avoiding it. The famine is happening in almost complete western silence.
Keep in mind, none of this is unexpected. In fact, the G7 countries discussed the pending problem in mid 2022, yet no one took any steps to avoid it.
Vladimir Putin’s military action against eastern Ukraine had nothing to do with the severe food shortages and inflation in Sri Lanka {link}. Nor did Russia have any influence over the Dutch government trying to stop food production {link}. Additionally, Putin had no control over Justin Trudeau’s decision to limit harvest yields by blocking the use of nitrogen-based fertilizer {link}. More importantly, it was not Vladimir Putin who forced all the western politicians to sign up for a new ‘climate friendly’ energy program that is destroying the ability of western farms to generate higher yield crops.
You do not need to be a farmer to understand that nitrogen/phosphorus-based industrial fertilizer has been the reason why farm yields have generated massive amounts of food on a global basis. The United States, Canada, the U.K. and places like the Netherlands have massively increased their ability to generate food for export, in large part due to the success of improved fertilizer and crop saving modern pesticides. Take those farming advancements away under the guise of climate change and you get Sri Lanka, Pakistan and now the African Continent.
Those western climate and energy policies create downstream consequences. The decision to chase a new global energy policy under the name “Build Back Better,” in combination with short-sighted EU sanctions against Russia, and you get food shortages.
It was not Vladimir Putin who told British Prime Minister Boris Johnson and German Chancellor Olaf Scholz their proactive recommendation to switch from crop-based biofuels to human food would be blocked. That G7 decision was made by Justin Trudeau and Joe Biden. {link} Even more significantly, it was not Russia who threatened the multinational energy companies about investing in Africa for expanded natural gas supplies for their fertilizer needs. That threat came from the same western government alliance, per their instructions from the World Economic Forum group {link}.
It was predictable {JUNE 21st} {June 30th} and {July 6th} that western government leaders would seek to avoid responsibility for the food crisis they created, and throughout the latter part of 2022 we saw western media trying, desperately, to frame Russia for global food shortages in order to protect western politicians.
I said this in July of last year and as the consequences now surface it is even more critical to understand.
Joe Biden, NATO, the G7, the European Union, the World Bank, USAID, and every western leader in the United States and Europe stated in early and mid 2022 there will be food shortages in 2023.
They did not say there might be shortages; their statements were emphatic, there will be shortages.
Accept this basic cornerstone. Then ask why not a single proactive step has been taken by any of the aforementioned institutions or governments to alleviate what they declare is a certainty. Why?
Simple question, “why?”
If all of the western nations, non-govt organizations and heads of state, are aware of a coming food crisis, why is there no proactive response?
It is a question that even the most hardcore leftists will not answer, because there is only one answer. No action is being taken because they do not want to take action. No effort to avoid the crisis is being done, because they do not want the crisis avoided.
Peel all the layers of obfuscation and causation away, and what we find is the epicenter of the food shortage is directly the result of the Build Back Better agenda. A post-pandemic western government deliberate decision to radically change global energy development. In succinct terms, the climate change agenda.
However, regardless of how you feel about the validity of “climate change,” the cause of diminished food supplies is purposeful. It is not climate change causing food shortages. It is the purposeful action taken under the guise of mitigating climate change that is causing the shortage of food.
The collective Build Back Better energy policy of western governments’ is the reason for massive increases in energy costs, massive oil price jumps, gasoline price increases, significant increases in chemical costs, increases in diesel fuel costs, shortages of fertilizer created using natural gas, and the end result is lower crop yields, higher farming costs and eventually, food shortages. They knew this.
All of the organizations and government who have been decrying the future shortage of food, know it is the radical shift in energy resource development that is creating the crisis. This acceptance of reality begins the framework to understand just how entrenched and committed these western leaders are toward their beloved climate change agenda.
We are only just now beginning to see the first aspects of the food shortage. However, once the issue becomes unavoidable the western leaders will not and cannot accept the blame for what they have done. They will blame-cast, excuse and justify what is surfacing.
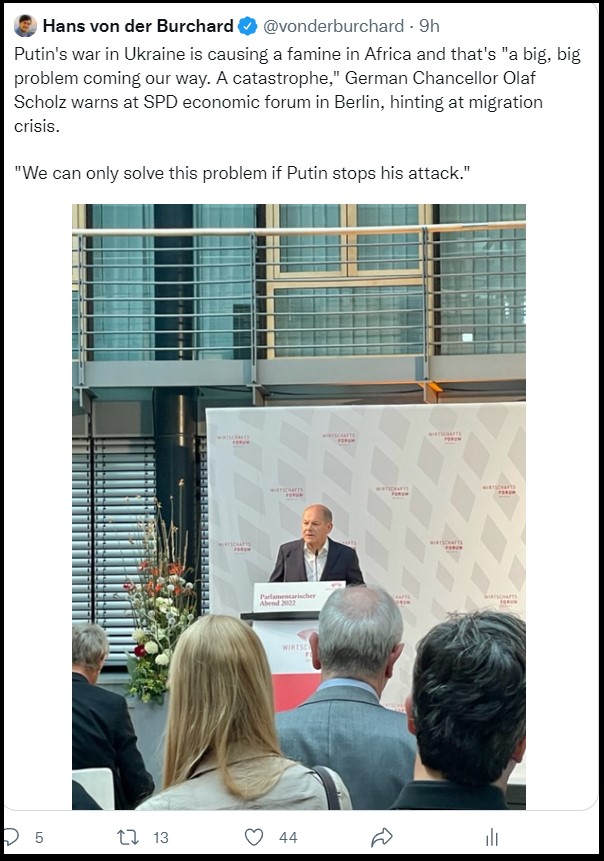
Food shortages will be blamed on the Ukraine conflict, Russian aggression, climate change and any various iteration of justification that does not identify the true cause, their energy ideology.
I’m not so sure that people fully understand what the entire system of western government would be willing to do to avoid being blamed for avoidable death on a potential scale that is quite alarming. All of the western leaders, institutions and governments are on the same boat. They are all in this together.
(June 22, 2022) – (Reuters) – The European Union is divided on how to help poorer nations fight a growing food crisis and address shortages of fertilizers caused by the war in Ukraine, with some fearing a plan to invest in plants in Africa would clash with EU green goals.
The need for food “clashes with EU green goals.”… Let that sink in.
Most of these people like Al Gore, Kerry, the mainstream media, Rhinos, democrats, and Bill Gates seem to actually believe in climate change for they are displaying the most stupid form of analysis invented by the lowest possible intelligence level of society. Hey, it’s warmer today than when I was a kid so we must be causing it. There has been ZERO research into climate on any of their parts to even test their theory. They all project that we are headed toward an environmental Armageddon if mankind does not immediately end fossil fuels. Not a single one has bothered to even consider that switching to electricity curiously makes society extremely vulnerable. If I were China looking to take down the West, I would be pushing this agenda at light speed. The first thing you do is take down the power grid and society will crumble in less than 72 hours. Using digital currency would mean you could not buy anything. Without an electric car you would be forced to walk to a store that then could not sell you anything without electricity and no new supply of anything would be able to move so there goes the supply chain – again.
The GOOD NEWS is you can then just nuke your opponent and actually save the planet all at the same time. Without electricity, your opponent could not even make a phone call to launch a response. But if we look at Chornobyl, the nuclear disaster restored the region which became a sanctuary for animals void of humans.
Bikini Atoll70 years after nuclear tests is thriving. On July 24, 1946, Baker Test shrouded its formidable height over the U.S. Navy’s test fleet. The United States dropped 23 nuclear bombs on the island, including a device in 1954 that was 1,100 times larger than the Hiroshima atom bomb. Now a team of scientists from Stanford University has been stunned. They discovered an abundance of marine life apparently thriving in the crater of Bikini Atoll, which was declared a nuclear wasteland after the bombings.
Strangely enough, the same has been found at Chernobyl in Ukraine. It is starting to emerge that even setting off every nuclear bomb will not destroy the planet or turn Earth into space rocks. We can alter our environment by doing so and ridding the planet of humanity as the dominant species, but Earth will heal itself and life will adapt exactly as scientists have discovered in Ukraine at the site of Chernobyl. Wildlife has thrived because it sent humans running.
This new evidence emerging from Chernobyl and Bikini Atoll is demonstrating that we just may not be as smart as we think we are no less all-powerful. Obviously, the WEF and world leaders who are all pushing for World War III, are obvious far smarter than we are. They are really trying to save the planet from us. Exterminate humanity and we can save the bugs and crickets from becoming our next food source.
Do you feel helpless when trying to assess the veracity of “climate doom is looming” claims we are constantly bombarded with?
For ordinary citizens not having acquired at least a Ph.d. degree in atmospheric physics or comparable climate-relevant sciences, it seems nearly impossible to tell right from wrong when it comes to assess such claims. Do so-called greenhouse gases really reflect infrared energy back to earth in such quantities that this affects earth’s temperature?
Don’t give up trying to understand the relevant basics: there are rather simple ways to get an idea about what this is all about. Even without a scientific background, most people have at least a good common sense. And that’s all it takes to get a grasp of how vigorously and chaotically enormous energy fluxes slosh up and down, back and forth between earth’s surface and the skies.
Fig. 1. The setting sun illuminating a fairly thin veil of clouds from below – thus injecting energy into the space between the earths’s surface and cloud cover.
Part 1 – some basics
Let’s first clarify where the heat that allows us to live rather comfortably in our habitats is coming from and where it goes to. Despite the enormous energy content of the molten core of our planet, the bulk of our energy comes from the sun, which sends us energy mainly using three forms of electromagnetic radiation: visible, ultraviolet and infrared light.
At the top of the atmosphere, every square meter oriented towards the sun thus receives a fairly constant power influx of 1361 to 1362 W/m2. Although not being a real constant, this value is often referred to as the solar constant.
The alleged greenhouse effect
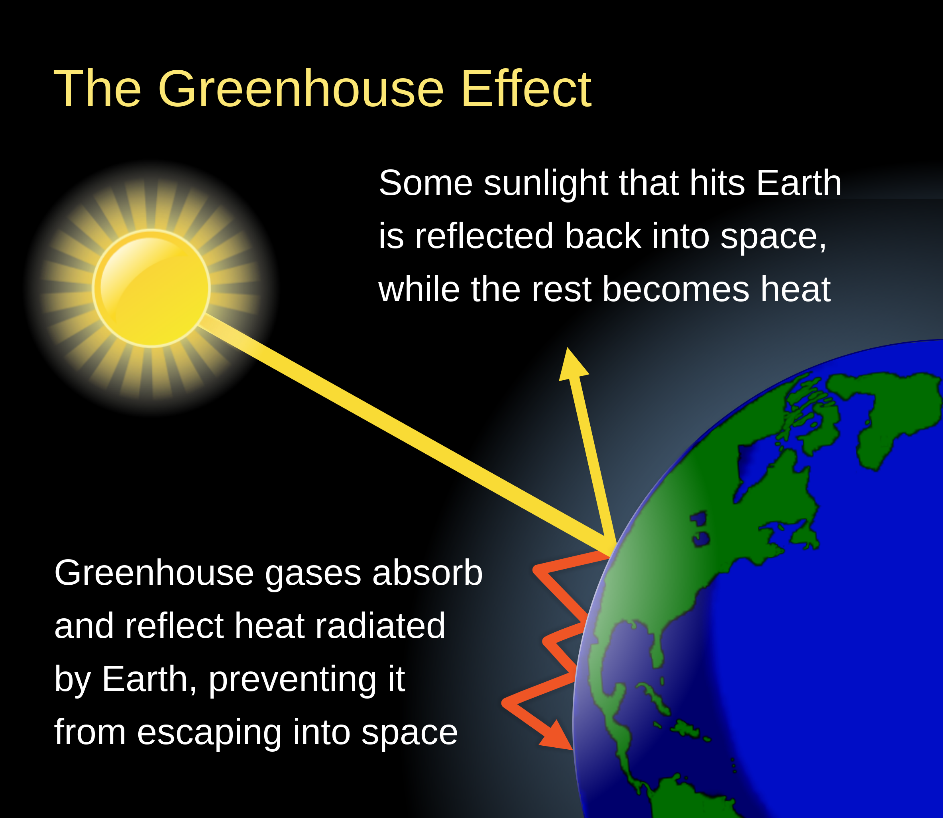
The notion of a “greenhouse effect” in our atmosphere has been used and misused incredibly often, resulting in an incredible mess of erroneous perceptions not only among the public, but even in the scientific world. A striking example for an obvious misrepresentation can be seen in the lead-in picture of the Wikipedia chapter on the topic, Fig. 2.
Fig. 2. The lead-in picture of the Wikipedia chapter about the “greenhouse effect” (Author: Efbrazil2), CC 4.0)
This graphic highlights the extent to which Wikipedia gives the impression of having fallen prey to climate activism. The complex reality of transfers and transformations of energy on our planet involving soils, waters, gases, clouds, aerosols, heat storage, conduction and convection, chemical reactions and phase transformations, as well as a host of additional factors are simply swept under the carpet, attributing all their combined effects solely to the odious “greenhouse gases”.
This Wikipedia chapter is a saddening example for the downfall of an allegedly scientific encyclopedia actually spreading rather crude ideology under the guise of educating the public. The related chapter comprises more than 7,000 words and tries to underscore its claim of being “scientific” by a list of 80 citations including papers about the atmospheric conditions on far-away cosmic bodies such as Titan and Venus. But this cannot excuse the use of such a grossly misleading graphic as the lead-in picture for the abstract. Such tricks commonly used in tabloids or yellow journals. Wikipedia touts itself to be an encyclopedia addressing not only scientists but also laymen and the general public and should therefore care all the more not to disseminate content that may be misunderstood by people lacking a scientific background.
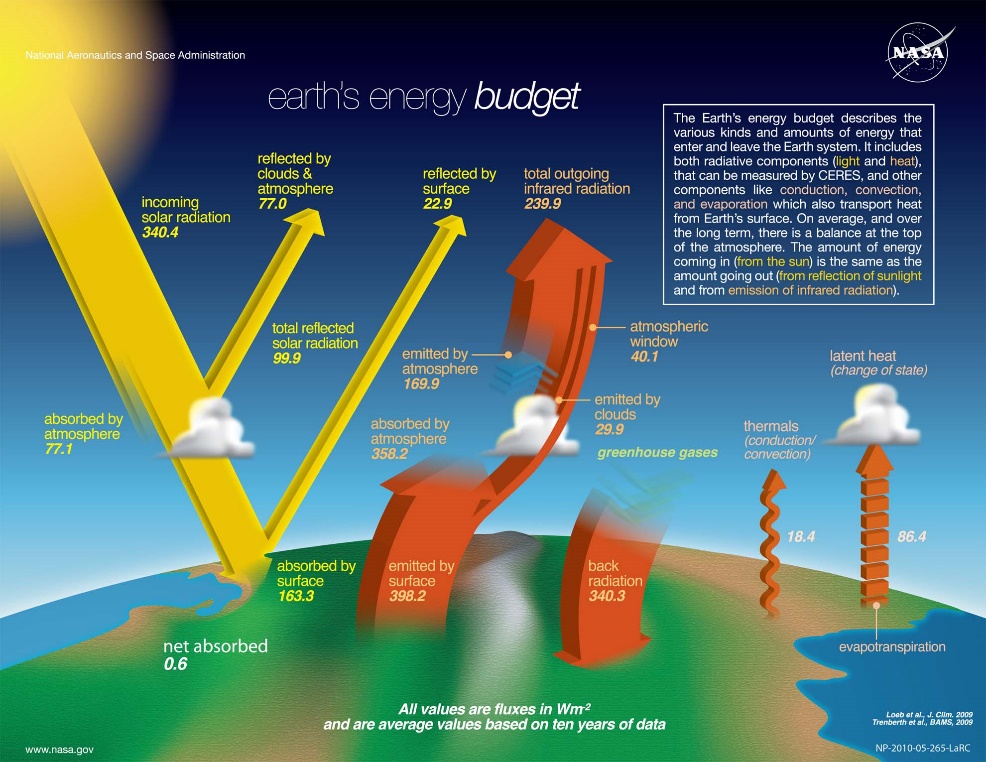
Fig. 3. This more detailed representation of the energy fluxes on earth elaborated by NASA is still misleading with respect to some decisive facts (Picture by NASA3), public domain) Note: This graphic and the corresponding link have been withdrawn after completion of the article. In a subsequent part, the replacement graphic and its amendments will be treated in detail. Nevertheless, this graphic and its errors have been displayed for a prolonged time, thus warranting a suited discussion.
Although the more detailed Fig. 3 elaborated by NASA gives a better impression of the many different factors influencing energy transfer fluxes between earth’s surface and space, it still misleads in a subtle way that makes it unfit to convey a correct understanding of the vital facts. Let’s look at the main inconsistencies.
Mean values intended to mask natural variations
One of the favourite tricks of climate prophets of doom is to suggest that all major factors influencing our climate are more or less constant, with the sole exception of “greenhouse gases”. They intend to exploit the fact that the CO2-level of the atmosphere is rising while at least for the past some 150 years, meteorologists have also seen a moderate rise of the temperature levels they monitor on their stations. Though both trends are far from being in lockstep, this coincidence of trends has been declared to be the proof for a causality, although no clear mechanism or quantitative deduction could hitherto be established. Despite many striking discrepancies e.g. with respect to the natural cycles of CO2 or the absorption and sequestration of CO2 in our oceans, the perceived rise in temperatures has been almost exclusively attributed to CO2.
Misusing water vapor
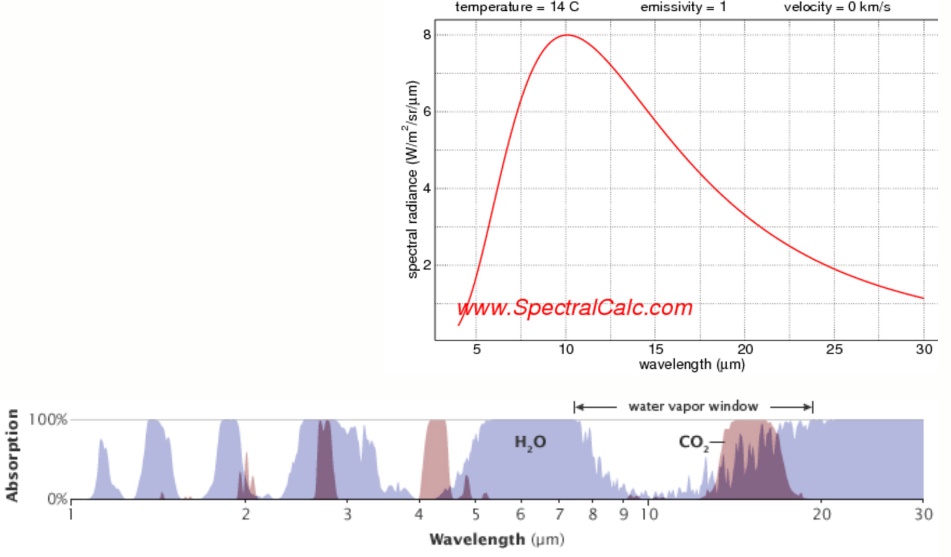
Another diversion has been to declare that water vapor is simply reinforcing the leading role of CO2. This might be viewed as a real masterpiece of twisting reality since water vapor has not only a much higher efficiency with respect to absorbing (and re-emitting) infrared radiation (see Fig.4.), but is also exceeds the content of CO2 in the atmosphere by factors between 25 (= median concentration value at sea level) and up to 100!
Fig. 4. Comparing the spectral IR radiance of a surface with 14 °C with the overlapped absorption bands of CO2 (brownish) and water vapor (bluish) shows the highly superior absorption capacity of water vapor for the IR emission of soil or water at 14 °C – (which is the “mean” temperature on earth’s surface). Please mind the different scales of the x axes: linear for the spectral radiance, logarithmic for the absorption. (Graphics: SpectralCalc4) (above), NASA, Robert Rohde5) Public domain (below)).
Notwithstanding these inconsistencies, the climate science community has in its vast majority adopted this approach. This might be attributable to the fact that the quantity of water vapor in the atmosphere is subjected to wild temporal and local variations between nearly zero – e.g. at high altitudes and very low temperatures – and sometimes up to 4% at sea level.
Cutting corners
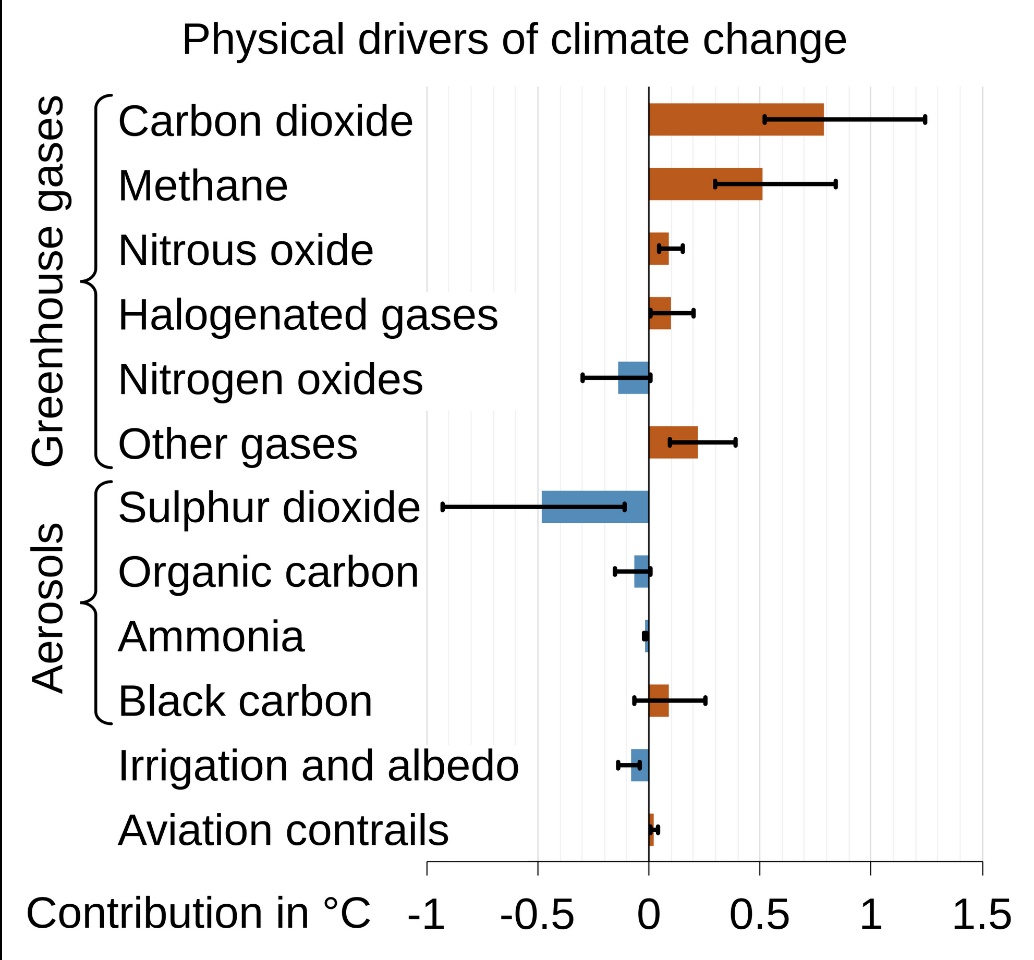
Additionally, especially when transforming to clouds, water vapor tends to condense or freeze out of the atmosphere in ways that have up to now resisted any realistic attempt to describe them mathematically. Trying to establish realistic three-dimensional models of water vapor distribution over a certain location at a given moment and to calculate the resulting effects on absorption and re-emission of IR radiation thus remain a much more arduous task than using a single value for all and every condition, as can conveniently be done when attributing the whole “greenhouse effect” solely to CO2. And voilà, truckloads of complicated research work may simply be skipped. This approach also greatly reduces the scale of expenditures in data acquisition, manpower, computer time – and in waiting time before reaping academic awards. After all, the beacon for all climate science, the IPCC, is doing it too, e.g. by simply omitting water vapor from its account of “greenhouse gases”, see Fig. 5.
Pic.5. Contribution to observed climate change from 12 different drivers, as taken from the Summary for Policymakers of the sixth IPCC assessment report, adapted from figure SPM.2c (Graphic: Erik Fisk, CC 4.06))
The numerous advantages of such a cutting of (scientific) corners might be one of the main driving forces for the deplorable tendency towards the “single number fallacy” explained by Kip Hansen7) as being “the belief that complex, complicated and even chaotic subjects and their data can be reduced to a significant and truthful single number.”
Unfortunately for us, that’s exactly what the official climate science is doing. Under the headline “One number to track human impact on climate”, NOAA scientists released the first AGGI8) (aggregated greenhouse gas index) in 2006 as “a way to help policymakers, educators, and the public understand the cumulative impact of greenhouse gases on climate over time”.
The minuscule driving forces of “greenhouse gases”
When trying to assess the real impact of “greenhouse gases” on earths energy balance, the first step should be to assess the driving force they are alleged to exert on the input and output of energy fluxes. Corresponding parameters can be found in a table within the Wikipedia chapter about Greenhouse gases 9). They reveal that in the view of the leading climate scientists, just four gases have a relevant influence on the budget of energy exchange between incoming and outgoing radiation energy since the alleged start of “human- induced climate change” in 1750. These are:
Carbon dioxide with + 2.05 W/m2 Methane with + 0.49 W/m2 Nitrous oxide with + 0.17 W/m2 Tropospheric ozone + 0.4 W/m2 =========== Total GHG contribution +3.11 W/m2
This figure is extraordinarily small when comparing it with the enormous temporal and local variability of energy fluxes within our planet’s ocean/atmosphere/soil system within short time periods, and amounts to just a low single digit percentage of the daily variations. This will be treated in more detail in the following chapter.
Peculiarly enormous greenhouse effect range
On a side note, it is interesting to see that the IPCC gives an enormous range for the greenhouse effect (TCR, Transient Climate Response or “climate sensitivity” 10)) of CO2, which is estimated to range “likely” between 1.5 and 4.5°C. The figure represents the alleged rise of earth’s mean temperature in °C for every doubling of the CO2 level of the atmosphere. Given this extraordinarily broad range of ± 50%, one might be surprised that IPCC, NOAA and Wikipedia authors advance temperature rise values for greenhouse gases calculated with up to three “significant” digits. This too might be attributable to the feeling of certainty about climate relevant figures instilled into the public by the “one number fits it all” mentality prevalent in our current climate science community.
In electricity generation, capacity factor, utilization, and load factor are not the same.
A lot of confusion exists in the press and certainly in politics, and even amongst “energy experts”, about using the term “capacity factor”. It may be excused, since the distinction made in this article became only relevant with the penetration of variable “renewable” energy, such as wind and solar, in our energy systems.
Worldwide average solar natural capacity factor (CF) reaches about ~11-13%. Best locations in California, Australia, South Africa, Sahara may have above 25%, but are rare. (see www.globalsolaratlas.info, setting direct normal solar irradiance)
Worldwide average wind natural capacity factors (CF) reach about ~21-24%. Best off-shore locations in Northern Europe may reach above 40%. Most of Asia and Africa have hardly any usable wind and the average CF would be below 15%, except for small areas on parts of the coasts of South Africa and Vietnam. (see www.globalwindatlas.info, setting mean power density)
Natural capacity factors in Europe tend to be higher for wind than for solar. Wind installations in Northern Europe may reach an average of over 30% (higher for more expensive offshore, lower onshore), but less than 15% in India and less than 8% in Indonesia.
Average, and the emphasis is on average, annual solar PV capacity factors reach around ~10-11% in Germany, ~17% in Spain, ~25% in California, and may reach 14-19% in India, but they reach less than 15% in Indonesia’s populated areas. Carbajales-Dale et al. 2014 confirm higher capacity factors for wind than for solar; they estimate global average wind capacity factors to be around 21-24% and solar around 11-13% (see figure above).
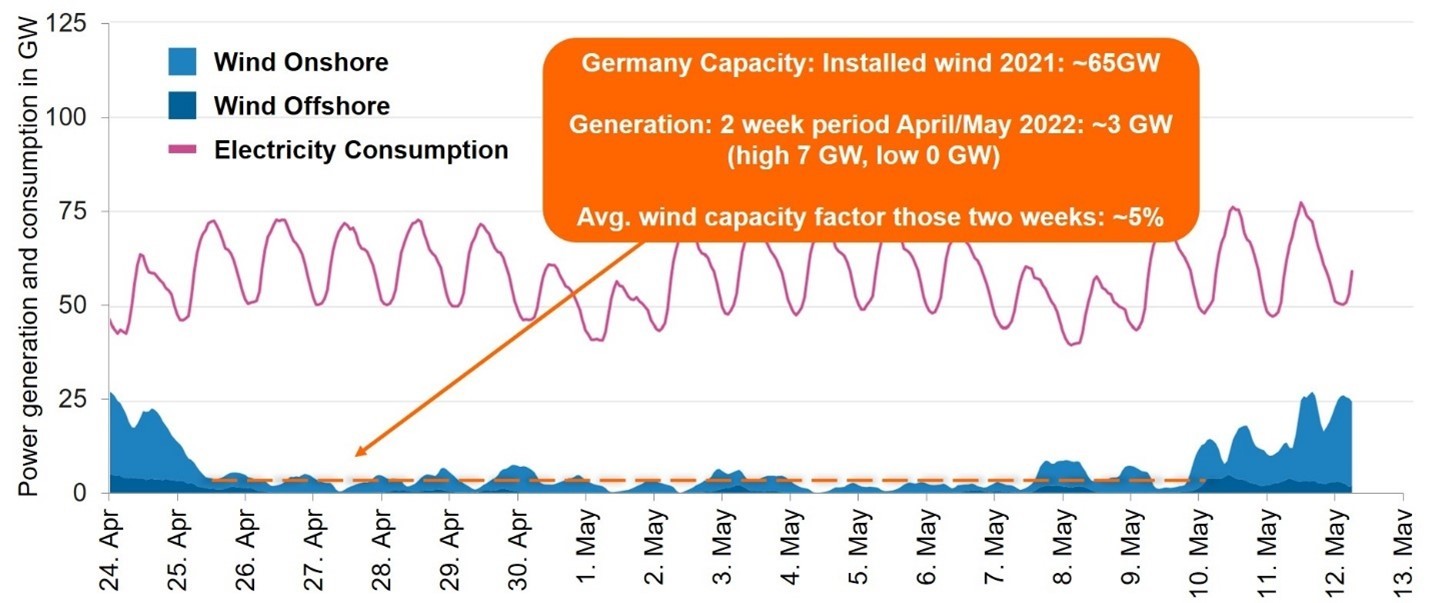
The figure further below illustrates a two week period in May 2022 (when I wrote this chapter of our book on capacity factors), where the average wind capacity factor reached only ~5% for ALL German wind installations (on- and offshore).
To avoid confusion, I try to use “natural capacity factor” in my writing wherever possible
The “natural capacity factor (CF)” is the % of the maximum possible output of the “power plant” (coal, gas, nuclear, solar, wind, hydro, etc), achieved under the natural conditions of the site, assuming no operational or technological failures or outages.
I define “utilization” is the % of the power plant’s workable capacity used on average over the year, which is only reduced because of technological, operational, economical outages or curtailments… completely independent of the CF
The “net load factor” – in my definition – is then the product of natural capacity factor x utilization
Thus, when we speak of the natural capacity factor, we are only referring to the nature-derived capacity factor, not the technological oroperationally driven “utilization” (often referred to as uptime, plant load factor, or PLF). In other words, when technology fails, or a power plant is turned off on purpose, this will reduce the utilization but not the natural capacity factor.
As mentioned, the natural capacity factor is due to the site, not the solar PV installation. Thus, even a perfect PV material still needs to deal with natural capacity factors with an annual average of 10-25%, not counting for other losses from conditioning, transmission, balancing, or storing highly intermittent sources of electricity (Schernikau and Smith 2021).
The press has mentioned several times that coal or gas have capacity factors of 60% or less on average. This is at best misleading, more likely knowingly wrong for political reasons. However, such a number is not the nature-derived capacity factor; it is the utilization which declines with higher penetration of wind and solar, and contributes to electricity system cost increases.
Utilization never should and cannot be compared to natural capacity factors, they are very distinct. Conventional power plants have near 100% natural capacity factors, but their operational and technological utilization often falls significantly below 90%, also but not only because of the priority given to wind and solar in the system. Because of their high CF, the net-load factor is only slightly lower than utilization for a convention power plant.
Because utilization of wind and solar is often near 100%, their net-load factor is often only slightly lower than their natural capacity factor.
Figure: Germany’s wind generation 25 April to 10 May 2022 during a 2-week wind lull Source: Agora 2022, Figure 10 in Book “The Unpopular Truth… about Electricity and the Future of Energy”, http://www.unpopular-truth.com
Needless to say, the natural capacity factor of wind and solar (even for hydro, because of natural river flows) cannot be predicted or guaranteed for any given time frame. The natural capacity factor can be estimated on an annual basis but still varies widely even annually (see Europe in 2021) and is very erratic, sometimes for days and weeks reaching near 0% for wind and solar, even in top locations.
Thus, natural capacity factors worldwide are a direct result of the location of the wind or solar installation; they do not in any way depend on and cannot be influenced by the technology employed.
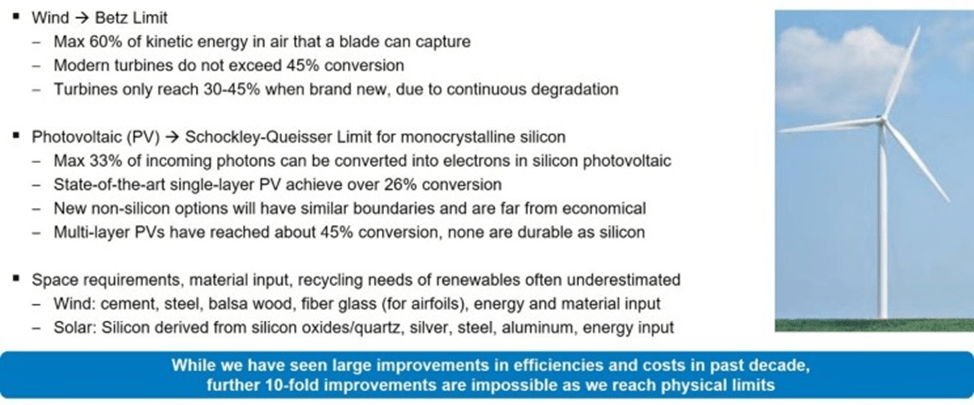
The last point is important… no technological advances can change the natural availability of wind, solar, or river flows and therefore influence the natural capacity factor for a given installation. Technology CAN and WILL improve how much usable electricity you get out of the natural input product (wind, solar, river flow, gas, coal, uranium, etc)… this is called conversion efficiency and their limits are discussed further below.
Since the easy locations have already been “used up”, one can expect average natural capacity factors to decline over time… contrary to what Net-Zero plans assume (see International Energy Agency (IEA), McKinsey & Company, or International Renewable Energy Agency (IRENA)).
For a photovoltaic (PV) park, the natural capacity factor CF depends entirely on the intensity and duration of the sunlight, which is affected by seasonality and cloudiness, day and night, and the ability to maintain the PV panel surface’s transparency, e.g., dust in the Sahara or snow in winters.
Wind farms’ natural capacity factors depend on the site’s wind speed distribution and the saturation speed of the wind turbine. The CF of a wind turbine is determined by the number of hours per year in which the wind farm operates at or above the saturation wind speed (Smith and Schernikau 2022). If the design wind saturation speed is set low, e.g., 4-5 m/s, the wind farm produces little energy, even for high capacity factors. Typically, wind saturation speeds are 12-15 m/s.
It now becomes obvious why the installed capacity needs to be much larger for wind and solar than for dispatchable power such as nuclear, coal, gas, or hydro. This significant relative increase in energy generation capacity to produce the same available, but unpredictable, energy output is coupled with a significantly higher raw material input and energy input factor for variable “renewable” energy which must be offset from any fuel savings.
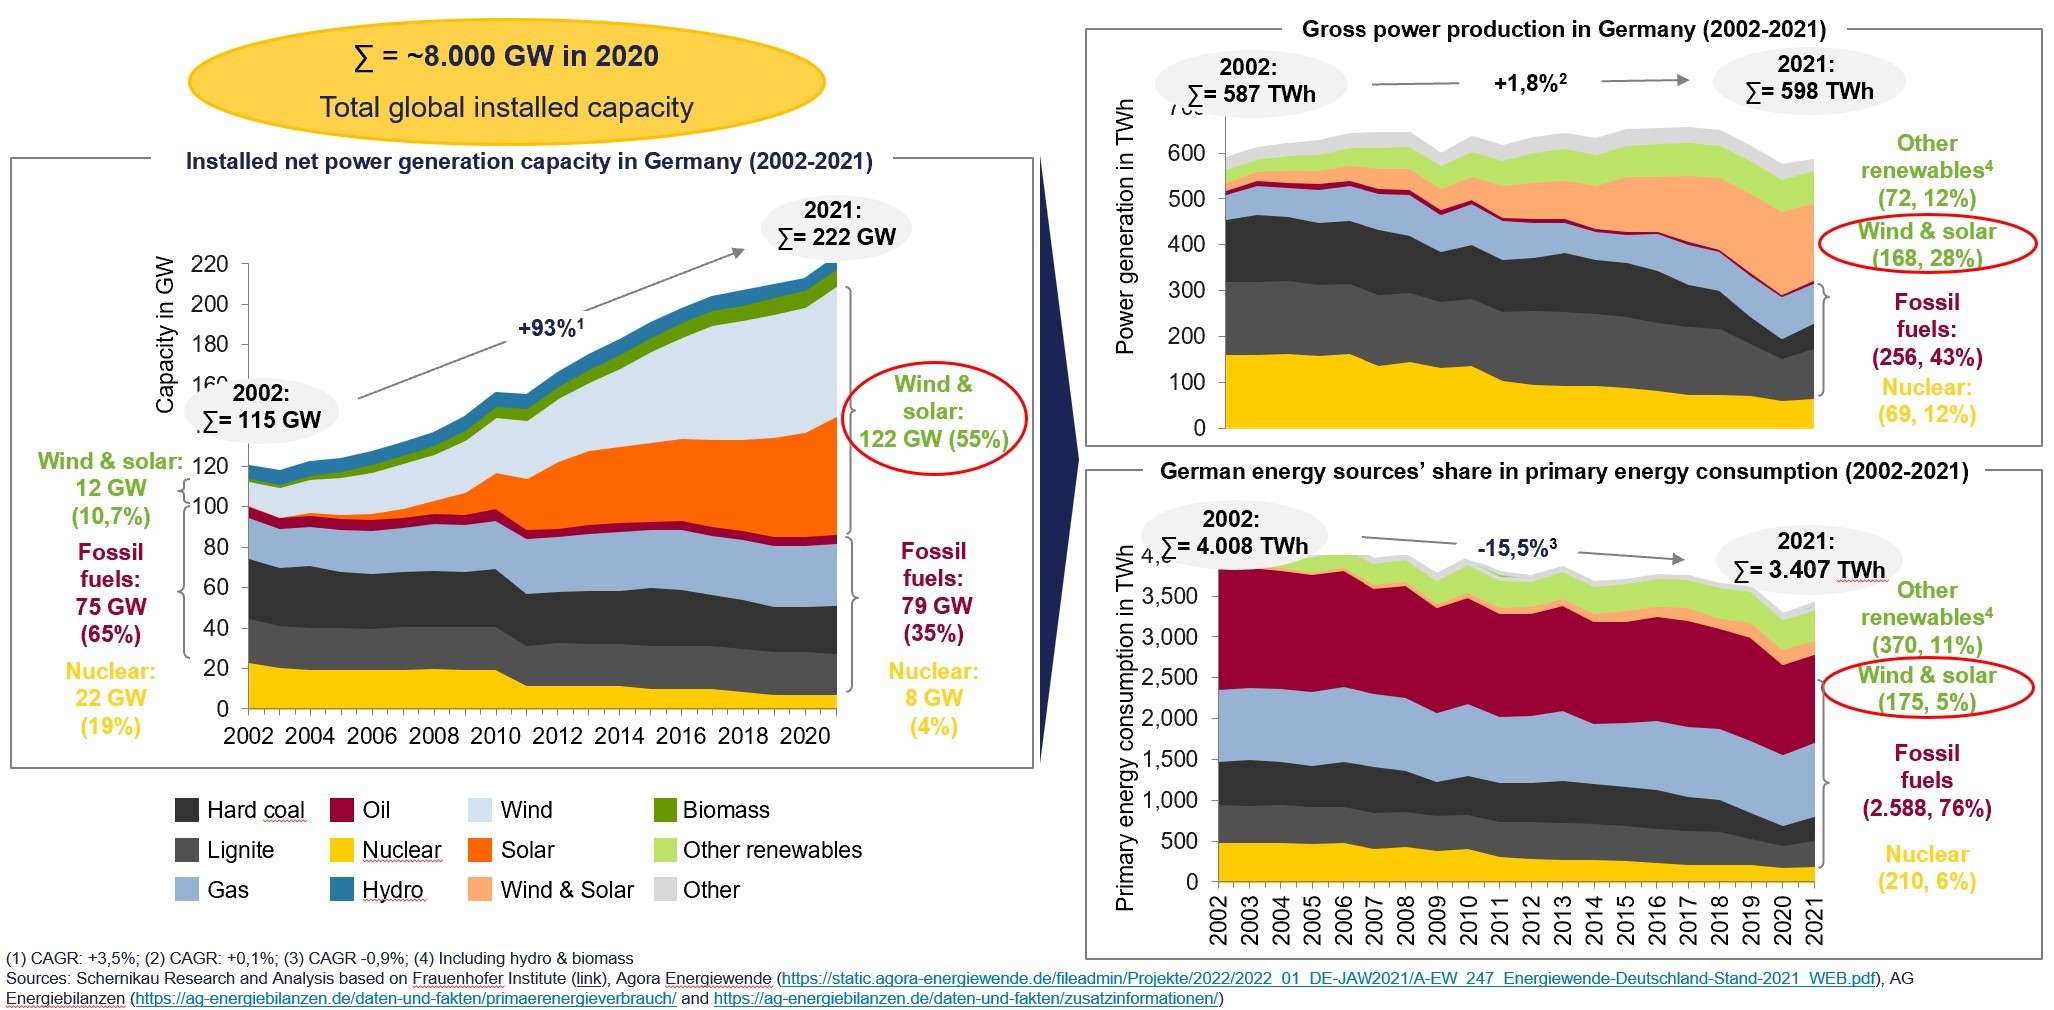
#Germany is a good example: Total installed power capacity more than doubled in the past 20 years, essentially all consisting of wind and solar (see figure below)
Wind and solar installed capacity is now above 125GW, more than 150% higher than peak power demand in Germany of around 80GW
Germany’ conventional installed power capacity consisting of coal, gas, and nuclear still barely matches peak power demand
With all this capacity addition in Germany, wind and solar made up less than 30% of total electricity generation in 2021 and about 5% of total energy consumption
Figure: German installed power capacity, electricity production, and primary energy
Source: Schernikau Research and Analysis based on Fraunhofer 2022, AGE 2021, Agora 2022 Figure 7 in Book “The Unpopular Truth…about Electricity and the Future of Energy”, http://www.unpopular-truth.com
The low natural capacity factor of wind and solar installations – without any doubt – is one of the key reasons for their low net-energy efficiency (https://dx.doi.org/10.2139/ssrn.4000800).
On Conversion Efficiency
Below figure summarizes energy conversion efficiencies for wind and solar and the laws they follow. Conversion efficiency measures the ratio between the useful output of an energy conversion machine and the input, in energy terms, thus after accounting for capacity factor.
COMMENT: Could an individual state finish the wall started by the previous administration? It’s painfully obvious Washington has its own agenda. And at this time, I see no point in even lobbying our federal government to do anything in our border towns/states. Is it legal to have our individual states finish what was started? I know I’m not alone in my concerns and would gladly contribute to a “wall fund”, or something of the sort. Maybe things are so corrupted it would be pointless?
REPLY: Yes, it is the state’s border. Knowing the atmosphere on Capitol Hill, it has simply become war and it has nothing to do with the benefit of the nation. I was impressed by the words of Arizona Sen. Kyrsten Sinema who courageously announced that she was leaving the Democratic Party to register as an independent. It was her words that rang true. She stated that she was abandoning the Democratic Party and turning her back on the “broken partisan system in Washington” that prioritizes denying the opposition party a win rather than “delivering for all Americans.”
This is the very reason why the United States will collapse. There is no longer any sense of guiding the nation for the benefit of all the people. This has turned into a hate game. Neither side will dare to agree that ANYTHING the other side did was just, fair, or in the best interest of the whole. It is just partisan war and in the process, they are destroying the core of the United States and our once culture of freedom that was admired and inspired by the world.
I can confirm that when the US invaded Iraq on the nonsense of weapons of mass destruction, the pro-Americans in Russia lost ground. They were indeed pushing to join NATO and enter the world economy for the benefit of all the Russian people. But that invasion armed the Neocons and they pointed to that invasion that America was imperialistic and was seeking to control the entire world. It also lowered the esteem of America in the eyes of many in China. Ukraine has merely reconfirmed that view.
Politics has degenerated into a very dark era. If history repeats itself, there will be no other choice but to move toward separatism. We will no longer be able to live in peace together because that is not acceptable anymore. All this nonsense of what is your pronoun and men can have babies with a sex change is dividing the country into groups. Once you do that, you do not benefit the right of those people, you cast them as the new enemy of the state just as Hitler did with the Jews. The end is near for the United States. A house as divided as we have become CANNOT stand. That was the view of Lincoln to justify the Civil War.
Gamazda Piano Published originally on Rumble on December 4, 2022
The Sound of Silence is what we will have at the end of World War III as we will all be gone if we can’t find a way to stop the Great Reset and the Build Back Better insanity of Klaus Schwab
Klaus Schwab has shown his true colors of authoritarianism. He is against democracy, freedom, and basic God-given human rights. With his Davos group next month, the World Economic Forum (WEF), Schwab who is a control freak by nature, has endorsed the cancel culture banning Twitter, and listing the various Chinese state-controlled social media apps to “follow along” with Davos Man. Schwab follows Marx and believes that he can create the perfect world and that he is far superior to anyone else and this can shape and design how society should function.
That was the very same attitude of Marx and Lenin. Those ideas resulted in over 200 million people dying. That’s OK. We are just collateral damage on his yellow-brick road to perfection. Schwab looks down upon society as the dirt beneath his feat. He fails to understand why communism even failed because it suppressed human nature and in so doing, it eliminated curiosity and imagination. Children under communism could not imagine their future. They were told by the state what they will be according to the needs of the state.
We are far too stupid to know what is best for us. Only the elite understand how to shape the future. We are to surrender all say in our own lives. This is Schwab’s dream to control society 150%. We are to surrender our very beliefs and our aspirations to the state. These ideas have been tried throughout history so many times. They have always ended in stagnation and total collapse.
Everything he says I have confirmed from other sources. French soldiers who volunteered said the same thing, Ukrainians kill Russian prisoners sometimes ruthlessly. It is a total disgrace that we are supporting these Neonazis – the very people still practicing ethnic cleansing.
I have created this site to help people have fun in the kitchen. I write about enjoying life both in and out of my kitchen. Life is short! Make the most of it and enjoy!
This is a library of News Events not reported by the Main Stream Media documenting & connecting the dots on How the Obama Marxist Liberal agenda is destroying America


