October 24, 2018
President Trump and First Lady Melania Trump both deliver remarks at a White House event to highlight the continued efforts to combat Opioid abuse [Background Here]


President Trump and First Lady Melania Trump both deliver remarks at a White House event to highlight the continued efforts to combat Opioid abuse [Background Here]
Well, there it is. Quietly within the deliberate words from Vice-President Mike Pence a revelation that explains the origination of the Central American invasion force. For those who are not deep in the geopolitical weeds, the subtlety can pass unnoticed; for those who travel within the deepest international conflicts, Pence’s words here are as subtle as a brick through a window:
[…] “Financed by Venezuela; and sent North to challenge our sovereignty and our border”…
https://videopress.com/embed/tXWLlFMs?hd=0&autoPlay=0&permalink=0&loop=0Announcing the migrant caravan is “financed by Venezuela” is a direct notification the Central American invasion force is being funded by Russia and China. Venezuela doesn’t have any money to sustain its own operational government – let alone a 10,000 person convoy. Venezuela is entirely reliant upon massive investment from Russia and China.
In fact China owns 49% of Venezuela’s state run PDVSA energy production. A collateral system where Beijing takes oil as payment for prior loans the Maduro regime cannot pay back. With the crippling treasury department sanctions President Trump put on Venezuela last year, Trump has punched Maduro and Xi-Jinping hard.

With Mike Pence pointing a finger at Venezuela the politics behind the invasion force begin to make much more sense. The invasion objective takes on a geopolitical angle directly targeting a series of U.S. policies that are against the interests of Russia and China.
It helps here to remember the strategic moves taken by President Trump that have put the geopolitical/economic squeeze on both China and Russia:
♦Squeeze #1. President Trump and Treasury Secretary Mnuchin sanctioned Venezuela and cut off their access to expanded state owned oil revenue. Venezuela needs more money. China and Russia are already leveraged to the gills in Venezuela and hold 49% of Citgo as collateral for loans outstanding. China and Russia now need to loan more, directly.
However, China cannot engage in economic commerce with Venezuela or they risk losing access to the U.S. banking system. Therefore all current Chinese aid to Maduro comes in the form of IOUs. These ongoing loans are likely impossible to be repaid.
♦Squeeze #2. China’s geopolitical ally, Russia, is already squeezed with losses in energy revenue because of President Trump’s approach toward oil, LNG and coal. Trump, through allies including Saudi Arabia, EU, France (North Africa energy), and domestic production has influenced global energy prices. Additionally, President Trump is demanding NATO countries, specifically Germany, stop supporting financial dependence on Russia.
Meanwhile, and directly connected, Russia is bleeding out financially in Syria. Iran is the financial reserve, but they too are energy price dependent and President Trump is now putting pressure on Iran vis-a-vis new sanctions and new demands on allies.
♦Squeeze #3. In 2017 Trump and Secretary Tillerson, now Secretary Pompeo, put Pakistan on notice they need to get involved in bringing their enabled tribal “extremists” (Taliban) to the table in Afghanistan. Pakistan’s primary investor and economic partner is China. The U.S. removed $900 million in financial support to pressure Pakistan toward a political solution in Afghanistan, China has to fill void. [NOTE: Last month the World Bank began discussions about a financial bailout for Pakistan.] Again, more one-way bleed for China.
♦Squeeze #4. China’s primary economic threat (competition) is next door in India. President Trump has embraced India as leverage over China in trade and pledged ongoing favorable trade deals. The key play is MFN (Most Favored Nation) trade status might flip from China to India. That’s a big play. It would have massive ramifications.
♦Squeeze #5. President Trump launched a USTR Section 301 Trade Investigation into China’s theft of intellectual property. This encompasses every U.S. entity that does manufacturing business with China, particularly aeronautics and technology, and also reaches into the financial services sector.
In March of 2018 U.S. Trade Representative Robert Lighthizer completed a section 301 review of China’s trade practices. [SEE HERE] Section 301 of the U.S. Trade Act of 1974 authorizes the President to take all appropriate action, including retaliation, to obtain the removal of any act, policy, or practice of a foreign government that violates an international trade agreement or is unjustified, unreasonable, or discriminatory, and that burdens or restricts U.S. commerce. However, as talks with China progressed, President Trump shelved the 301 action to see where negotiations would end-up. The May and June, 2018, negotiations between the U.S. and China provided no progress. The 301 review of China was pulled back off the shelf, and President Trump assembles his trade-war strategy. The 301 tariffs/sanctions are currently being worked out with U.S.T.R Robert Lighthizer.
♦Squeeze #6. President Trump, Secretary Ross, Secretary Mnuchin and USTR Robert Lighthizer dissolved NAFTA in favor of the USMCA. One of the primary objectives of team U.S.A. was to close the 3rd party loopholes, including dumping and origination, that China uses to gain backdoor access to the U.S. market and avoid trade/tariff restrictions. [China is a Non-Market Country without a Free Trade Agreement (FTA) and sends parts to Mexico and Canada for assembly and then back-door entry into the U.S. via NAFTA.]
As we see in the details within the U.S-MCA trade agreement, China’s ability to use Mexico and Canada as a backdoor into the United States is now gone.
♦Squeeze #7. President Trump has been open, visible and vocal about his intention to shift to bilateral trade renegotiation with China and Southeast Asia immediately after Team U.S.A. concluded with NAFTA. [Current discussions with Japan are ongoing]
♦Squeeze #8. President Trump positioned the U.S. relationship with the E.U. as a massive potential loss for Europe (via Steel, Aluminum, and Auto tariffs) if they did not: (A) shift their trade relationship toward greater reciprocity; and (B) reconsider the size of their trade relationship with China. After initially trying to push-back, Europe acquiesced.
♦Squeeze #9. President Trump has positioned ASEAN (Association of Southeast Asian Nations) as trade benefactors for assistance with North Korea. Last year the KORUS (South Korea and U.S.) trade deal was renegotiated, and announced in March. The relationship between ASEAN nations and the Trump administration is very strong, and getting stronger. Which leads to…
♦Squeeze #10. President Trump has formed an economic and national security alliance with Shinzo Abe of Japan. It is not accidental that North Korea’s Kim Jong-un fired his last missile over the Northern part of Japan. Quite simply, Beijing told him to. However…
♦Squeeze #11. President Trump cut-off the duplicitous Beijing influence over North Korea by engaging directly with Kim Jong-un. The open exchange and ongoing dialogue has removed much of the ability of Beijing to leverage the DPRK nuclear threat for their own economic benefit. This dialogue was as much, if not more, about dismantling the Beijing geopolitical influence as it was about denuclearizing the Korean peninsula; however, no-one caught on to that part of the strategy.
SUMMARY: It makes sense from the perspective of China, Russia and Venezuela to use their alliance to create a border crisis between the United States and Mexico, especially since the interests of President-elect Lopez Obrador and President Trump are now aligned within the U.S-MCA trade agreement; which is structured to the detriment of pre-existing Chinese investment in Mexico under their prior -and corrupt- Mexican leadership.
Remember, President Trump out manuevered Chairman Xi Jinping in North Korea. Xi lost most of his control position over DPRK Chairman Kim Jong-un; and while President Trump stood guard on the watchtower North Korea (Kim) and South Korea (Moon) are now happily joined in mutual fellowship. In the grand trade-conflict between the Red Dragon and the United States, Xi needed a new form of leverage.
In the geopolitical realm this invasion force makes much more sense now…


QUESTION: Martin,
I know things are dark, but you are becoming down right gloomy. If the world is falling apart in Austrialia, Europe, Japan and ultimately the USA, there must be somewhere, or somewheres, the computer says things will be great in, or get better in. Where to go now? China right now, no thank you. Maybe with a Polar shift and a physical revolution of the poles and new economic policy, then maybe. But not as it is. You could lose your everything as it is. So where? Singapore? Africa? India? Or do we just dig a hole and hide? I’ll take a cave in the Alps, or the Rookies with Solar Panels and hydroponic gardens.
I am (just) slightly older than you are and I still am ready for another 60+ years. What do we all do, us and the younger folks between now and 2080? Let’s kick it up and get going.
Joe
ANSWER: We do not necessarily have to run and hide in a cave. I will let you know if it really is that bad. What we are looking at is the collapse of governmental systems. That does mean you have to run and hide someplace. Yes, that is possible in certain areas. But politically, things change and we get to restructure.
As far as pole shifts, the climate changes yes. Where to run and hide? Who knows. The pole can just be a temporary excursion rather than a 180-degree flip. The only point of this is to ensure you have some food stored for there can be shortages with cold weather. Perhaps you will not even need it. Better safe than sorry. Nobody really knows what happens in a pole shift. One of the girls in the office fled last year because of the monster hurricane CNN said would kill everyone with a 16-foot wall of water, which maybe reach 1 foot at my house. She fled to Orlando and the joke in the office was it was following her. So it is not always wise to flee – you might be running smack into the event. Let’s just be patient and see. Places that are normally cold are warm and vice versa. This is strange so far but perhaps a leading indicator.
The worse thing would be flying at that moment in time. Airplanes are guided by where magnetic north and the North Pole has been moving more rapidly since 2010 than at any time in recent history. This has even forced changes in calibrating airports because planes would miss them and land in the water if not adjusted to where the North Pole is presently.
So, no need to run and hide. We are looking at an economic implosion. Yes, that will result in civil unrest and that will most likely be focused in the big cities. So the risk would be greater for someone living in LA or NYC rather than in the suburbs. But we are not looking at a Mad Max type event at this time. If that would occur, we are looking off into 2032-2037 period.
Besides, just perhaps if we have enough people who really UNDERSTAND the problem, then when it comes to rebuilding, we can all yell and be heard at that point – just not before the Crash & Burn. Nobody will listen and hand over any power until there is no other choice.
Categories: Economics, Understanding Cycles
COMMENT: Mr. Armstrong; You are striking a cord out there. A lot more people are paying attention. Someone put this out on YouTube.
PJ
REPLY: The best thing is for people to understand the trend in motion. There is nothing we can do to PREVENT this crisis. The only thing we can do is prepare for it to survive for ourselves and our family. Even a family member may disagree with you right now. That will change. People as a whole are passive-aggressive. That means they are indeed like sheep and those in power know that. They keep pushing until we reach the breaking point. At that moment, your family members who thought you were wearing tinfoil hats at night will suddenly see the light. Unfortunately, this is simply why this erupt politically at the end. We take it and take it until we cannot any longer. Politicians are befuddled because they have been robbing the treasury for so long they cannot grasp that now you are suddenly angry at that practice. To them, you never complained before

To the shock of everyone in politics and economics who can’t get enough socialism and want to bash that the disparity of income is so evil, these Marxists are beside themselves when the World Economic Forum released a study that shows the United States is the most competitive nation on earth. They have, however, concluded that their international economic index which finds America at the “pinnacle of global success” cannot be attributed to the actions of any one leader or administration. Indeed, people fled Europe to American to get away from bureaucracy. This remains reflected in attitudes.
A majority of Europeans (58%) would prefer to work as an employee rather than risk starting their own business. The promises of pensions and the social state have created a vast economic different picture between Europe and America and in Asia, we see a trend that is beginning to surpass the United States. This contrasts starkly with attitudes in the United States, where a majority (51%) say they would prefer to strike out alone. The United States allowed the property to be owned whereas in Europe the title to the property remains fixed in most of London and is leased out for 100 years where people pay the value as if they had purchased the property, to begin with. Property in London that was “freehold” was rather rare. Many fled to America which was the land of opportunity to actually own property, build wealth, and leave it to your family.
Then rushes in the Marxists. They hate people inheriting wealth and call it unfair. Every generation should start at zero in their mind. Then we have the economists who argue that it is the disparity in income that suppresses the economy in Europe. So what is their solution? Regulate everything excessively and take the wealth away from those who have it and pretend you are handing it to the people if anything is left once they government gets its hands on it for their own lavish pension schemes.

The United States is the venture-capital capital of the world. That will soon be displaced by China. Nevertheless, how to actually measure entrepreneurship is a very distorted view of the economy. One popular approach among economists which overlooks the depth of a nation’s economy is to count how many new businesses with paid employees start up each year, then divide them by the number of companies that are already up and running. The Organization for Economic Cooperation and Development (OECD), calls this percentage the “employer enterprise birth rate.” Others just call it the “start-up rate”.
From this distorted perspective, the United States scores fairly low on that definition coming in second to last when looking at the years 2007 through 2009 during the crash. The glaring flaw in this view is the fact that in the economies which are least developed come out on top, which was Slovakia and Mexico. The United States was predominantly small business also before the Industrial Revolution. Creating criteria of this nature are extremely misleading. Also, the period in question saw many young individuals start out on their own unable to find jobs with their costly degrees. They entered the self-employment segment but were not hiring people. They were breaking out and doing work in various services.
The greatest economic growth follows the LOWEST taxes, developed economies, and lower regulation. When the government attacks all three areas, our computer simply shows that economic growth declines.
I am a former Special Forces Green Beret from back in the Vietnam War era and since we were trained in many military skills including making improvised explosive devices my opinion on the current situation is relevant.

What happened today does not smell right and given the current domestic situation I suspect that this was a plot my progressive operators to pull off a stunt where no one was actually hurt but it was made to look like the Republicans or the alt right, as they like to say, tried to kill a number of high level Democrats. I make this statement for the following reasons.
One, If it was a real attempt I would find it almost impossible to believe that none of these devices detonated.
Two, As I write this 5 or 6 devices have been found which indicated a lot of hard work to both know where to send them and how to make them. Since the planning and implementation was at a high level and nothing happened its very difficult to believe that they were ever intended to explode.
Three, This was not done by someone making a bomb for the first time this was a well planned simulated attack design to advance the progressive movement since nothing else they have tried as been working.
Four, I seriously doubt they will ever find who did this as it was done by experts who also know how to cover their tracks.
Five, The Blue wave has collapsed and it now looks like the Republicans will hold the House and gain seats in the Senate. This is going to be a major blow to the progressive movement that they can not tolerate. If they can’t gain the House of Representatives at minimum they would be totally embarrassed and they can not tolerate that. There are elements in the progressive wing that have experience in these kinds of political tricks and i would not doubt they those elements would be used in this situation. After all look at what they have already done with the Russian collusion narrative, the Kavanaugh hearings and the caravans headed to the US southern border.
We have been schooled over the past 40 years that Carbon Dioxide (CO2) is rising to levels never seen before on this planet and as a result the world’s average temperature is rising to levels that will, if nothing else, destroy large areas of the planet. The latest UN predictions indicate a major Catastrophe will happen by 2040 unless we do something drastic right now. This destruction will be from two factors; one, ocean levels raising and flooding all worlds coastal areas forcing the world population to higher ground; and two, even if those moves are accomplished the increased temperatures will bring massive storms that will ravage the areas not flooded. The only solution to prevent this from happening is, stop using carbon based fuels; petroleum, natural gas, and coal which, all, generate large amount of water and carbon dioxide and replacing them with wind or solar energy.
These dire projections are based on the belief that CO2 is the “primary” driver of global temperature changes; i.e. more CO2 in the atmosphere is very bad. This view is severally distorted and more likely entirely false. One can argue the reasons for these lies but it really doesn’t matter whether they are innocent or malicious in their construct; either way promoting something that is tearing up the worlds civilizations by misallocation of resources is very misguided.
Basic facts:
The first thing that needs to be done when developing a theory is to identify and define the issue or problem. The issue was that after WW II there was a large buildup of industry required to rebuild the devastated planet and that rapid uncontrolled growth created real environmental problems. Much good resulted from the original environmental emphasis such as the creation of the Environmental Protection Agency, EPA, however, others in the 90’s saw a way to gain power and wealth by exaggerating aspects of the movement. During the 80’s and the 90’s global temperatures were going up so these people saw a way to increase the size and scope of government to their advantage with a carbon tax. They picked increased levels of CO2 in the atmosphere as the strawman argument and funneled large amounts of research money into universities to study how bad the increases were.
Unfortunately, federal grant money is “directed” money so it was given to find out how bad the issue was, not to find out if it was even bad or even real. Therein was the problem as this is a very complex math and physics study in a subject that had not been previously studied in detail such that 30 years later the key variables and relationship are still not known with specify. The mistake that was made in the attempt to quantify the apparent increase in global temperatures was that increased CO2 in the planet’s atmosphere was that CO2 was the ONLY REASON the global temperatures were increasing. Unfortunately this assumption was not true as there had been several warm and cold periods in history going back thousands of years. The previous little ice age in the seventeenth century was one of these and the warming we now have, about 10 Celsius, is partly from the northern hemisphere still coming out from that cold period.
Next we’ll review some important information on temperatures and how it’s measured. We need to understand the details before we can draw conclusions. The problem, intentional or not, goes back to physics and how we show information. It’s critical that when we talk to nonscientists that information is properly displayed. And nowhere is this more important than when we are discussing global temperature in relationship to anthropogenic climate change.
When we talk about climate (long term changes; centuries) or weather (short term changes; decades) local temperatures are going be in Celsius (C) in the EU and science, or degrees Fahrenheit (F) in America. The base temperature for the earth that NASA established is 14.00 C or 57.20 F; but these are both relative measures and do not tell us how much heat (thermal energy) is there. To know that we must use Kelvin (K) or Rankin (R) and that would be 287.150 K and 516.870 R all four of those numbers 14.00 C, 287.150 K 57.20 F, and 516.870 R are exactly the same temperature, just using a different base. But if the current temperature went from 14.00 C, to 14.860 C that is a 6.14% increase in C, an increase of 2.71% in F and an increase of .30% in K and R; so which one is real? The answer is .30% because Kelvin and Rankin are the only ones that measure the total increase in energy! Table One shows these relationships that we just discussed.
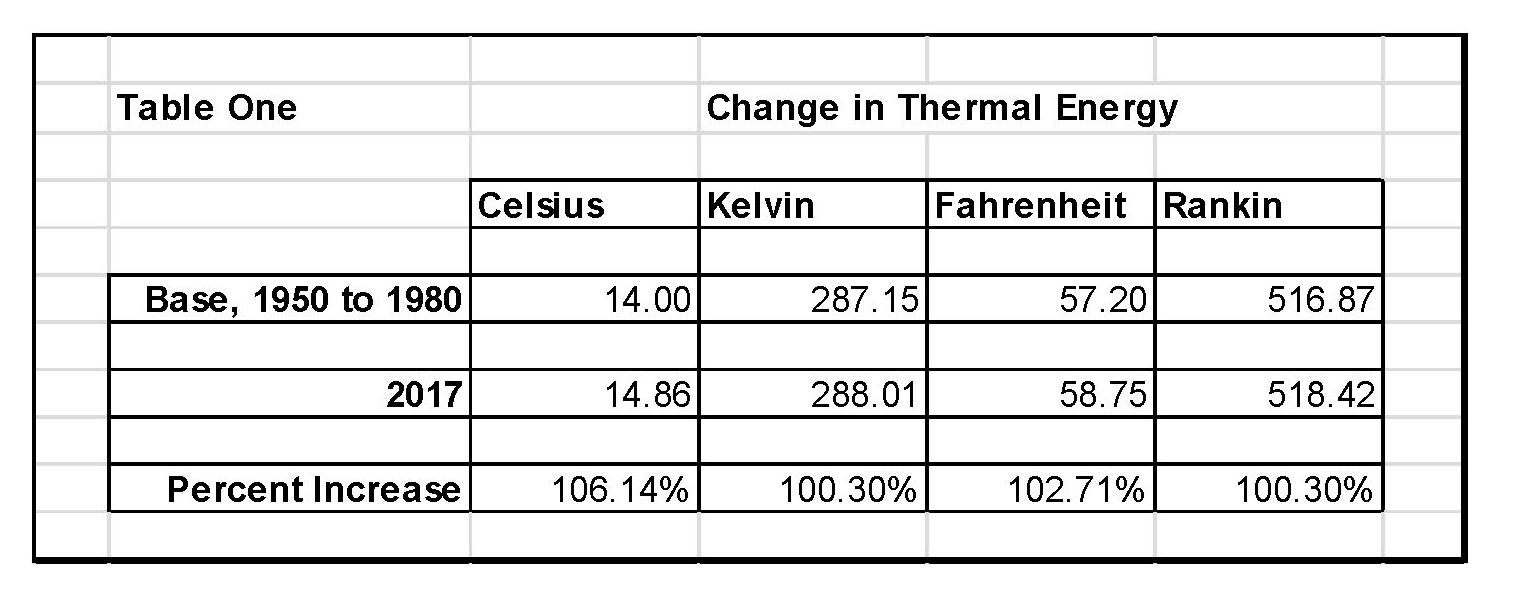
The next step is to plot Carbon Diode (CO2) from NOAA-ESRL and the estimated global temperature as published by NASS-GISS each month. As can be seen in Table One It doesn’t really matter whether we would use Kelvin and Rankin since the increase in thermal energy is exactly the same either way; but we’ll use Kelvin as that is the accepted norm in the scientific community for determining the amount thermal energy in any object especially when looking at changes in temperature or measuring the thermal energy in any object. There are other less known temperature scales that have specific purposes but they don’t really apply here in this subject.
The important thing is how much has the temperature actually gone up since we started to measure CO2 in the atmosphere? To show this graphically Chart 8 was constructed by plotting CO2 as a percent increase from when it was first measured in 1958, the Black plot, the scale is on the left and it shows CO2 going up about 30.0% from 1958 to May of 2018. That is a very large change as anyone would have to agree. Now how about temperature, well when we look at the percentage change in temperature from 1958, using Kelvin, we find that the changes in global temperature are almost un-measurable. The scale on the right side had to be expanded 5 times (the range is 20 % on the left and 4% on the right) to be able to see the plot in the same chart in any detail. The red plot, starting in 1958, shows that the thermal energy in the earth’s atmosphere increased by .30%; while CO2 has increased by 30.0% which is 100 times that of the increase in temperature. So is there really a meaningful link between them that would give as a major problem?

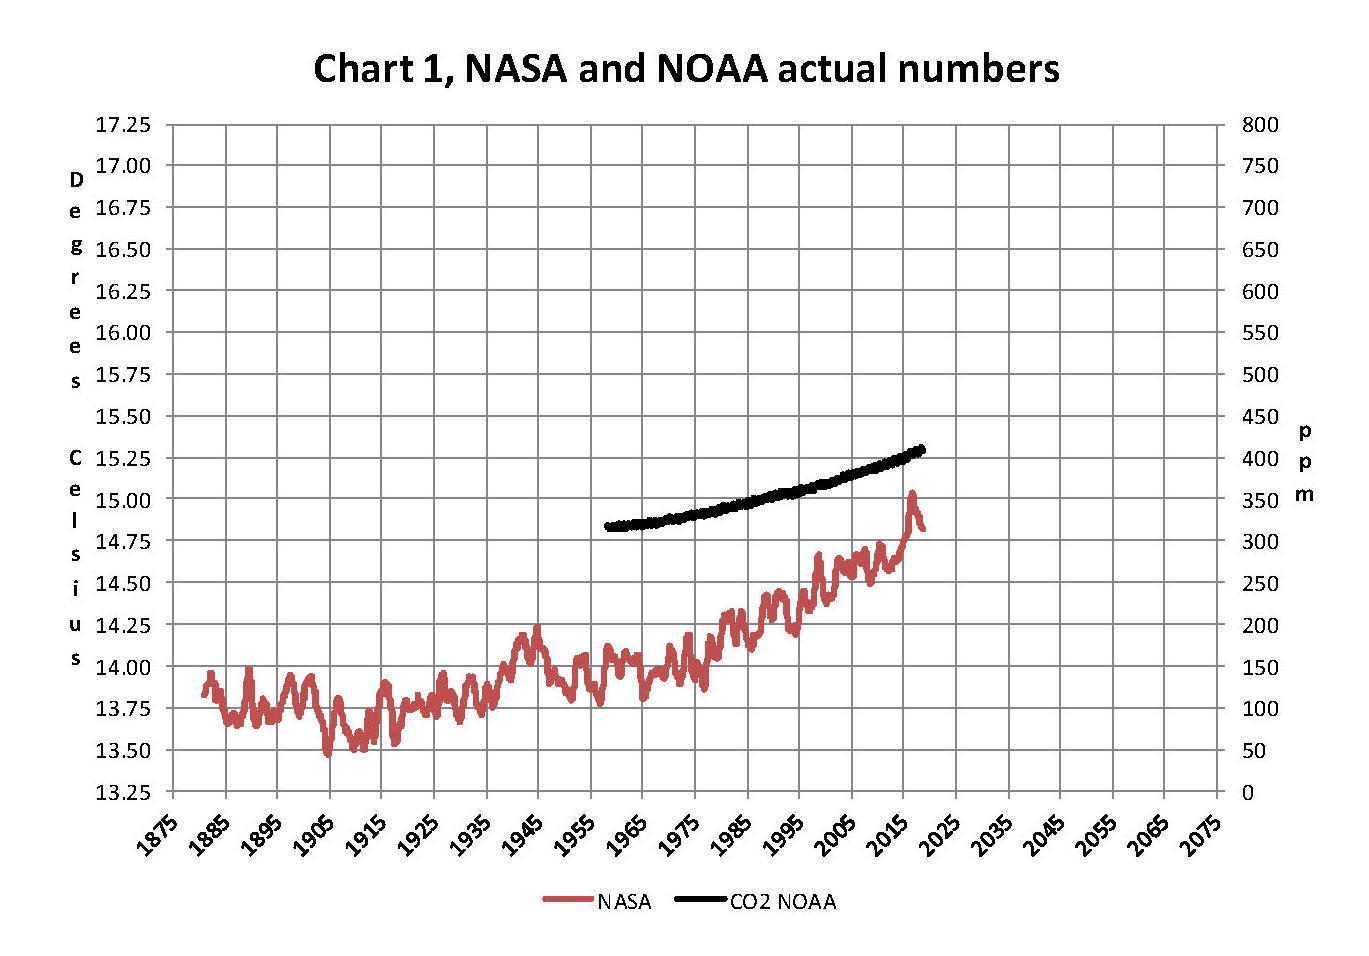
Chart 8 and all the rest of what is shown here in this paper are based on the following two data series. First NASA-GISS estimates of a global temperature shown as an anomaly (converted to degrees Celsius) as shown in their table Land Ocean Temperature Index (LOTI) and shown in Chart 1 as the red plot labeled NASA the scale for the temperatures is on the left. The NASA LOTI temperatures are shown as a 12 month moving average because of the very large monthly variations. Second NOAA-ESRL CO2 values in Parts per Million (PPM) which are shown in Chart 1 as a black plot labeled NOAA the scale for CO2 is shown on the right no change is required to the NOAA data set it is ready to use as is.
NASA published data is shown as an anomaly, but what is a temperature anomaly? An anomaly is a deviation from some base value normally an average that is fixed. There were two problems with the system that NASA picked which were number one there is no “actual” global temperature and two since climate is a variable and always has been so there cannot be a real base to measure from. NASA known for its science and engineering expertise back in the day thought it could get around these issues and created a system to do so. First they developed a computer model which took the readings from all over the planet and made adjustments to them in software which they called homogenization and came up with the estimated global temperature. Second they picked the period 1950 to 1980 (30 years) and averaged the values found in that period and came up with 14.00 degrees Celsius and make that their base. Lastly they took the calculated monthly temperature and subtracted the base from it which gave them the anomaly and multiplied the result by 100.
The problem is that both are arbitrary. Why pick 1950 to 1980 as the base period? Is there something special about that time frame? And as to a global temperature there is no such thing for many reasons like the earth faces the sun so one side is cool and onside it warm. Higher latitudes are cooler than the equator and higher elevations are cooler than lower. And finally there are many areas where there are no measurements taken. Therefore there is no one temperature only an artificial artifact solely dependent on the soundness of the software used to create that one temperature!
Chart 1 below is 100% accurate and based only on NASA and NOAA data as published.
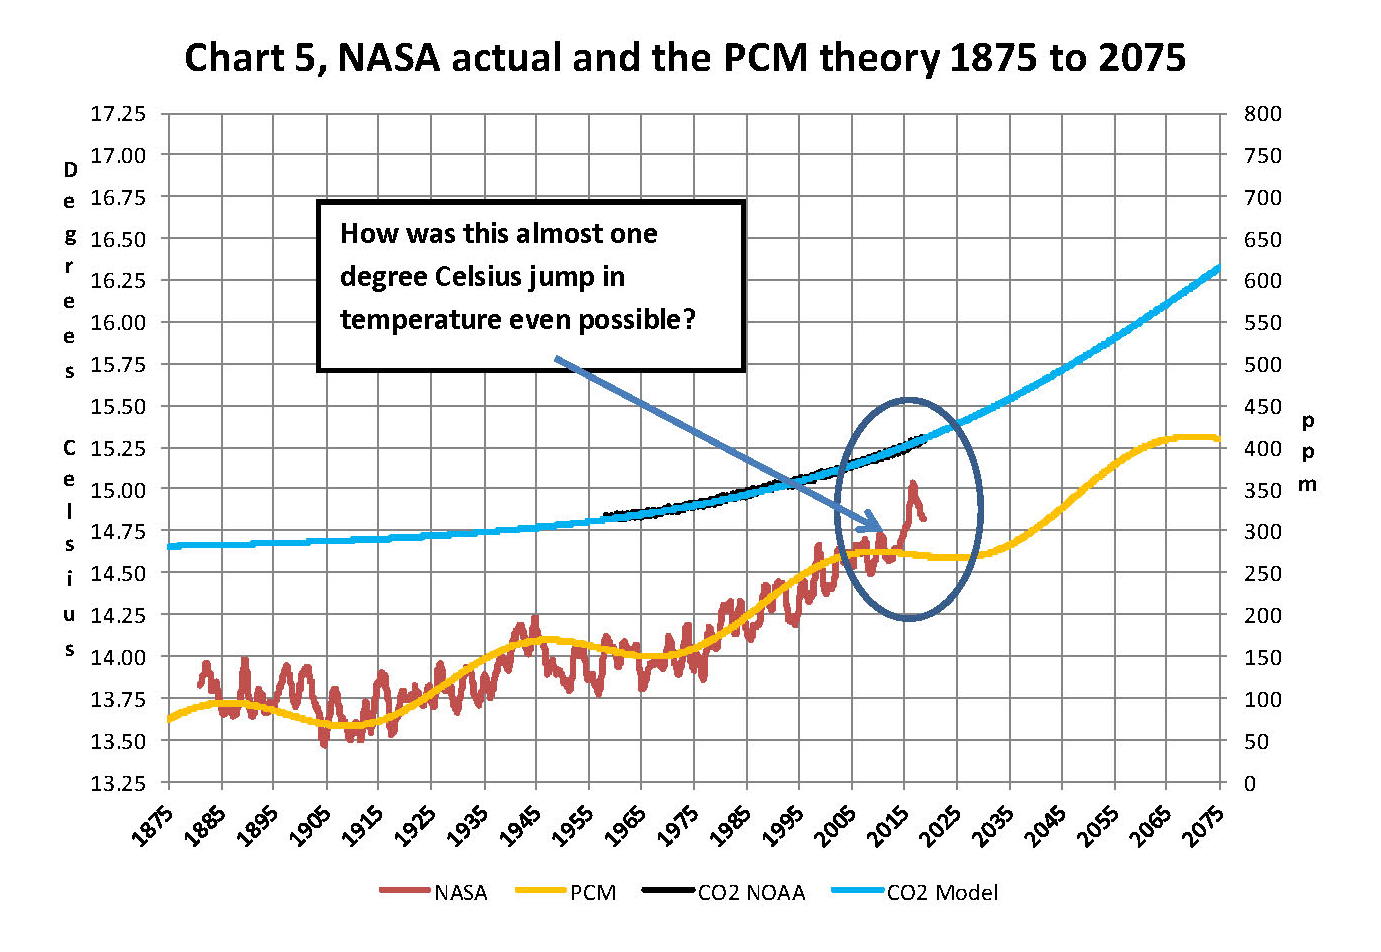
Now that we have a base to work with we are going to add to Chart 1 three things. The first is a trend line of the growth in CO2 since that is according to the government through NASA and NOAA the entire basis for climate change. That plot is superimposed over the black plot of the actual NOAA CO2 values as the cyan line labeled as the CO2 model and one can see there is a very good fit to the actual NOAA values so there should be no dispute about its validity, and it’s historically accurate. This plot allows us to make projections to future global temperatures according to the projected level of CO2The second added item is James E. Hansen’s 1988 Scenario B data, which is the very core of the IPCC Global Climate models (GCM’s) and which was based on a CO2 sensitivity value of 3.0O Celsius per doubling of CO2. This plot is shown here in lavender and is from a presentation that Hansen showed congress in 1988 to help support the UN in setting up the International Panel on Climate Change (IPCC). This plot is labeled as Hansen Scenario B which Hansen stated was the most likely to happen based on his 1979 climate theories’. The third item is the current plot of the most likely temperature of the planet based on the growth of CO2 published by the IPCC. This plot is shown in Red and is labeled as IPCC AR5 A2 as that is the table where the data was found. This plot is a GCM computer projection of the planets temperature based on the complex relationships developed by the IPCC primarily though NASA and NOAA.

It can be seen in Chart 2 that the lavender plot and the Hansen plot are very close from 1965 to around 2000. However there isn’t a good correlation between the growth in CO2 and the increase in the planets temperature, as shown in Chart 8. The CO2 is going up in a log function and the temperature was going up until 2000 then it plateaued from 2000 until 2014 where there was a mysterious spike up of .5 degrees Celsius just in time for COP21 in Paris. Then after CP21 was over the unexplained change in temperature started to come back down. The climate doesn’t make changes like what the NSA/NOAA data shows that would be weather if it even was real.
Chart 7 looks at the period from 2010 to 2020 so we can see where a change in CO2 of only a few ppm has caused a major change in the global temperature way beyond anything previously shown in any published NASA data. There are three ovals on Chart 7 one at the top of Chart 7 which is a black oval around the CO2 levels from 2010 to 2018 and it’s very obvious that there has been very little change, maybe 3 ppm a year Then at the bottom of Chart 7 is dark red oval around the NASA global temperature levels from 2013 to 2018 and its very obvious that there has been a sudden large change, almost .50 degrees Celsius in 3 years. There has never been such a large increase in temperature from such a small increase in CO2. By contrast the previous comparable period of the last part of 2010 through 2013 Blue oval shows about the same increase per year for CO2 but global temperature decreased.
An explanation is needed here as the NASA temperature plot in Chart 7 seems to show the jump in temperature in 2016 not 2015; this is a result of the very large jump in temperature shown by NASA. Since we are using a 12 month moving average and the increase occurred in only a few months it actually shifted the curve into 2016. The raw data for December 2012 was at a low of 14.44 degrees Celsius but by February 2016 the temperature was at a record high of 15.35 degrees Celsius a .91 degree Celsius increase, Red arrow. With the global temperature over 15.0 Celsius at COP21 in December 2015 at the Paris COP21 conference the climate accord was approved and the manipulation was a success. After COP21 the Fake Warming was no longer needed so we are now seeing a downward trend developing. The current temperature for June 2018 is 14.88 degrees Celsius.

In summary, the IPCC models were designed before a true picture of the world’s climate was understood. During the 1980’s and 1990’s CO2 levels were going up and the world temperature was also going up so there appeared to be correlation and causation. The mistake that was made was looking at only a ~20 year period when the real variations in climate move in much longer cycles of centuries which can be observed in the NASA data but they were ignored for some reason. By ignoring those actual geological trends and focusing only on CO2 the Global Climate Models will be unable to correctly plot global temperatures until they are fixed. Also the temperature data from 1850 to 1880 was dropped for some reason as it showed a lower temperature than would be expected. The lower temperatures’ in that period would have shown a shorter cycle they didn’t want shown.
A decade ago when I started looking at “climate” change the first thing I did was look at geological temperature changes since it is well known that the climate is not a constant; I learned that 53 years ago in my undergrad geology and climatology courses in 1964. The next paragraph explains currently observed patterns in climate related to this subject and is historical accurate.
Ignoring the last Ice Age which ended some 11,000 years ago when a good portion of the Northern hemisphere was under miles of ice the following observations give a starting point to any serious study on the subject of climate. First, there is a clear movement up and down in global temperatures with a 1,000 some year cycle going back at least 3,000 to 4,000 years; probably because of the apsidal precession of the earth’s orbit of about 20,000 years for a complete cycle. About every 10,000 years the seasons are reversed making the winter colder and the summer warmer in the northern hemisphere. 10,000 years from now the seasons will be reversed again. Secondly, there are also 60 to 70 year cycles in the Pacific and the Atlantic oceans that are well documented. These are known as the Atlantic Multi Decadal Oscillations (AMO) in the Atlantic and as La Nina and El Nino in the Pacific. Thirdly, we also know that there are greenhouse gases such as carbon dioxide that can affect global temperatures. Lastly the National Academy of Sciences (NAS) estimated that carbon dioxide had a doubling rate of 3.0O Celsius plus or minus 1.5O Celsius in 1979 when there were only two studies available and one for sure and maybe both were not peer reviewed.
The result of looking objectively at the three possible sources of global temperature changes was a series of equations based on these observations that when added together produced a sinusoidal curve that seemed to follow NASA published temperatures very closely when first developed in 2007, and modified a few years later when it was found the short and long cycles were related to multiples of Pi. Since this curve was based on observed temperature patterns it was called a Pattern Climate Model (PCM) which has been described in previous papers and posts on my blog and since it is generated by “equations” many assume it is some form of least squares curve fitting, which it is not. It does seem to be related to ocean currents where the bulk of the planet’s surface heat is stored and cloud formation.
Chart 5 shows the PCM a composite of two cycles and CO2. There is a long trend, 1036.7 years with an up and down of 1.65O Celsius (.00396O C per year) we in the up portion of that trend. Then there is a 69.1 year cycle that moves the trend line up and then down a total of 0.29O Celsius and we are now in the downward portion of that trend (-.01491O C per year), which will continue until around ~2035. Lastly, there is CO2 currently adding about .0079O Celsius per year so together they all basically wash out at -.0039O C per year, which matches the current holding pattern we were experiencing until 2014. After about 2035 the short cycle will have bottomed and turn up and all three will be on the upswing again duplicating what was observed in the 1980’s. Note: the values shown here are only representative from what is in the model.
When using a 12 month running average for global temperatures up until 2014 the PCM model was within +/- .01 degrees of what NASA was publishing in their LOTI table since the early 1960’s as shown in Chart 5. Further the back projection of the PCM plot matched historical records and global temperatures going back past the time of Christ. It should also be considered that geologically CO2 levels have reached levels many times that of the current 400 ppm without destroying the planet so the current hysteria over the current very small numbers can only be explained by political science not real science.
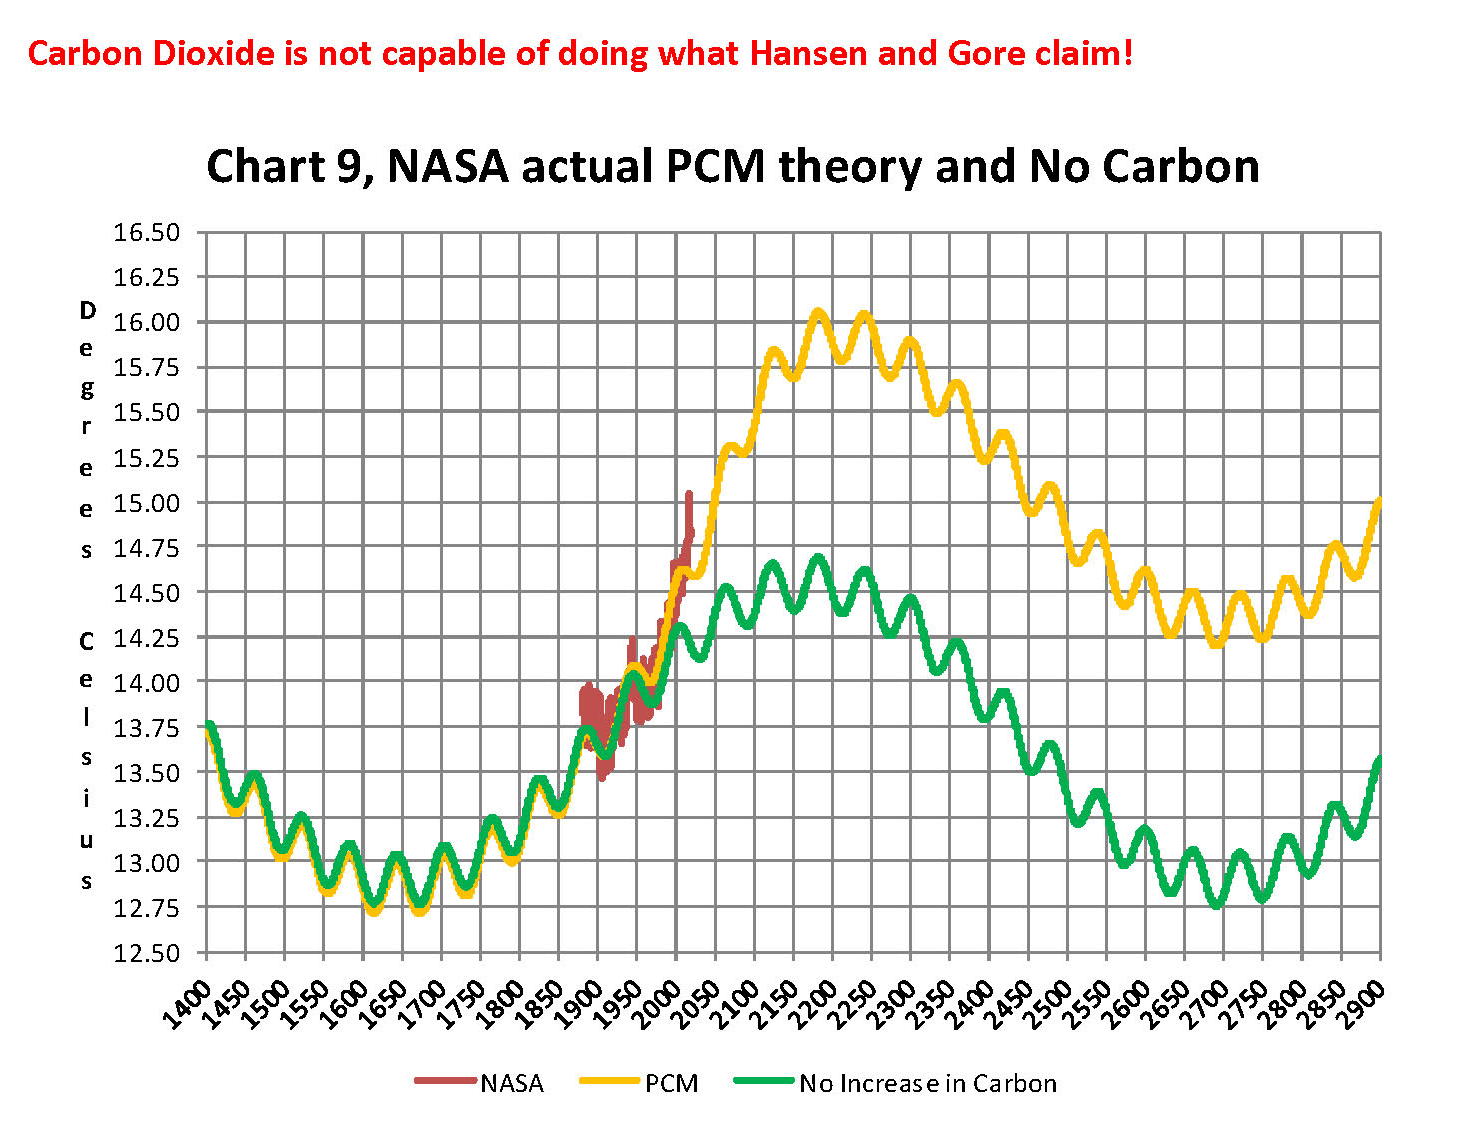
Lastly, Chart 9 shows what a plot of the PCM model, in yellow, would look like from the year 1400 to the year 2900. This plot matches reasonably well with recorded history and fits the current NASA-GISS table LOTI data, in red, very closely, despite homogenization. I do understand that this PCM model is not based on physics but it is also not some statistical curve fitting. It’s based on two observed reoccurring patterns in the climate and a factor for CO2. These patterns can be modeled and when they are, you get a plot that works better than any of the IPCC’s GCM’s. If the real conditions that create these patterns do not change and CO2 continues to increase to 800 ppm or even 1000 ppm then this model will work well into the foreseeable future. 150 years from now global temperatures will peak at around 15.750 to 16.000 C and then they will be on the downside of the long cycle for the next ~500 years.
The overall effect of CO2 reaching levels of 1000 ppm or even higher will be about 1.50 C which is about the same as that of the long cycle. The Green plot on Chart 9 shows the observed pattern with no change in CO2 from the pre-industrial era of ~280 ppm. CO2 cannot affect global temperatures more than 1.500 C +/- no matter what the ppm level of CO2 is. The reason being that the CO2 sensitivity value is not 3.00 per doubling of CO2 but less than 1.00 C per doubling of CO2 as shown in more current scientific work and it’s a logistics curve not a log curve.
The purpose of this post is to make people aware of the errors inherent in the IPCC models so that they can be corrected.
The Obama administration’s “need” for a binding UN climate treaty with mandated CO2 reductions in Europe and America was achieved as predicted at the COP12 conference in Paris in December 2015. To support this endeavor NASA was forced to show ever increasing global temperatures that will make less and less sense based on observations and satellite data which will all be dismissed or ignored. Within a few years the manipulation will be obvious even to those without knowledge in the subject, but by then it will be to late the damage to the reputation of science will have been done. Fortunately President Trump pulled us out of the bad agreement.
In closing keep this in mind. The current panic generated by the government using political science is that the current global temperature of around 15.0O Celsius is an increase of 7.14% from the 1960’s when the global temperature was 14.0O Celsius; and that does seem like a lot. However those views would be in error as the actual increase in thermal energy, as measured by temperature, would be only .35% because we must use Kelvin not Celsius when working with heat energy. When we use kelvin the temperature goes from 287.15O K to 288.15O K which is only .35% not 7.14% about 1/20 of what is implied by the IPCC. What the IPCC shows is not technically wrong as much as it is extremely misleading to anyone without a science background.
Sir Karl Raimund Popper (28 July 1902 – 17 September 1994) was an Austrian and British philosopher and a professor at the London School of Economics. He is considered one of the most influential philosophers for science of the 20th century, and he also wrote extensively on social and political philosophy. The following quotes of his apply to this subject.
If we are uncritical we shall always find what we want: we shall look for, and find, confirmations, and we shall look away from, and not see, whatever might be dangerous to our pet theories.
Whenever a theory appears to you as the only possible one, take this as a sign that you have neither understood the theory nor the problem which it was intended to solve.
… (S)cience is one of the very few human activities — perhaps the only one — in which errors are systematically criticized and fairly often, in time, corrected.
Tonight President Trump dined with military leaders in the Cabinet Room. The president answered a few questions from the media at the beginning of the briefing.
Defense Secretary James Mattis is seated to President Trump’s right, and Joint Chiefs of Staff Chairman Joseph Dunford seated to his left. President Trump delivers remarks then answers more questions about: Jamal Khashoggi; the Central American migrant caravan; and Space Force. WATCH:
Attendees include:

Lieutenant General Joseph Kellogg, Assistant to the President and National Security Advisor to the Vice President;
The Honorable Mira Ricardel, Assistant to the President and Deputy National Security Advisor;
The Honorable James Mattis, Secretary of Defense;
The Honorable Patrick Shanahan, Deputy Secretary of Defense;
General Joseph Dunford, USMC, Chairman of the Joint Chiefs of Staff;
General Paul Selva, USAF, Vice Chairman of the Joint Chiefs of Staff;
General Mark Milley, USA, Chief of Staff of the Army;
Admiral John Richardson, USN, Chief of Naval Operations;
General Robert Neller, USMC, Commandant of the Marine Corps;
General David Goldfein, USAF, Chief of Staff of the Air Force;
General Joseph Lengyel, USAF, Chief, National Guard Bureau;
Admiral Karl Schultz, USCG, Commandant of the U.S. Coast Guard;
General Joseph Votel, USA, Commander, U.S. Central Command;
Admiral Kurt Tidd, USN,”Commander, U.S. Southern Command;
General Curtis Scaparrotti, USA, Commander, U.S. European Command and Supreme Allied Commander Europe;
General Thomas Waldhauser, USMC, Commander, U.S. Africa Command;
General John Hyten, USAF, Commander, U.S. Strategic Command;
General Paul M. Nakasone, USA, Commander, NSA, CSS, Cyber Command;
General Terrence OShaughnessy, USAF, Commander, U.S. Northern Command;
Admiral Phillip Davidson, USN, Commander U.S. Indo-Pacific Command;
General Stephen R. Lyons, USA, U.S. Transportation Command;
General Vincent K. Brooks, USA, Commander UNC/CFC/USFK;
Vice Admiral Craig Faller, USN,Senior Military Assistant to the Secretary of Defense;
Brigadier General Andrew J. Gebara, USAF, Director of Strategic Capabilities and Plans, National Security Council;
Colonel Adam K. Ake, USA, Director for Defense Policy and Strategy, National Security Council;
Lieutenant Colonel Ryan D. Skaggs, USAF, Director for Defense Policy and Strategy, National Security Council.

“The Committees are unable to ask all questions of Deputy Attorney General Rod Rosenstein within the time allotted for tomorrow’s transcribed interview, therefore, the interview will be postponed. Mr. Rosenstein has indicated his willingness to testify before the Judiciary and Oversight Committees in the coming weeks in either a transcribed interview or a public setting. We appreciate his willingness to appear and will announce further details once it has been rescheduled.” (link)
Suspicious cat’s suspicions of Rosenstein seemingly validated. Here’s what an objective review of events seems to show.
There are voices sympathetic to a premise, a theory of sorts, that Deputy Attorney General Rod Rosenstein appointed Robert Mueller in an effort to remove the corrupt influence of Deputy FBI Director Andrew McCabe in 2017. According to the theory – Rosenstein’s modus operandi was to facilitate a genuine review of the Russian collusion/conspiracy questions through the appointment of Mueller.
However, in order for that theory to be correct – once Rosenstein discovered the fraudulent basis for the origination of the Mueller probe; meaning once he realized there was an actual FBI and DOJ scheme to construct a soft-coup; he would necessarily have needed to stop defending the false premise which built the foundation for the inquiry.
He didn’t.
He advanced it.
He defends it, even today.
Despite mountains of evidence showcasing the politicized and weaponized use of the FBI and DOJ to attack the office of the President, evidence that came out after the Mueller probe was launched, Rosenstein took no action to highlight the fraud and fold-up the inquiry.
Not only did Rosenstein take no action to confront the fraud; he has gone to extreme lengths to continue validating the Mueller probe a full year after clear evidence surfaced. Even as late as last Friday, Rosenstein filed a ridiculous indictment against an innocuous Russian person claiming she used Facebook and Twitter in a “conspiracy to defraud the United States.”
An honest review of conduct outlines that all of Rosenstein’s actions are self-serving. He is attempting to protect his own interests, and if that means protecting a false Mueller investigation – then so be it. That is exactly what he has been doing.
That behavior, highlighted by several instances – including his request to President Trump to continue hiding the information behind the declassification of documents requested by congress, highlights that DAG Rod Rosenstein is attempting damage control regardless of downstream consequences.
Deputy Attorney General Rod Rosenstein controlled the James Wolfe indictment (and eventual plea). DAG Rosenstein controlled the Natalie Mayflower Sours-Edwards Treasury leak indictment. DAG Rosenstein wrote the recent Op-Ed defending the Mueller investigation. DAG Rosenstein, together with Mueller, framed the indictment against the Concord group. DAG Rosenstein controls the indictment against Ms. Elena Alekseevna Khusyaynova. These are all Rosenstein constructs. These are all Rosenstein behaviors.
These are not the behaviors of a man who is trying to rid the DOJ of internal corruption.
These are the behaviors of a man intent on protecting the swamp, and by extension his own participation in corrupt swamp activity.
Yes, Suspicious Cat remains suspicious; and rightly so.

President Trump and President Trump’s supporters have two slightly different sets of priorities when it comes to the DOJ and FBI. From President Trump’s perspective the thorn in his administration has been Special Counsel Robert Mueller. The declassification agreement between Rosenstein and Trump negates any concern about Mueller.
Deputy Attorney General Rod Rosenstein created the special counsel under fraudulent pretense. That origination material (Ohr 302’s, FISA pages, origination EC, and Page/Strzok messages) is now a risk to the Deputy AG.
DAG Rosenstein does not want his involvement in the fraud to be exposed; hence his request to block/stall/delay the declassification directive. However, at any time President Trump can declassify all the documents and outline the fraudulent basis that originated the special counsel. This is essentially President Trump’s leverage.
 The Robert Mueller investigation is the priority for removal for President Trump in order to continue the MAGA agenda. For well over a year Mueller has been the cloud over the administration and has been the primary focus of most media antagonism therein.
For the Office of the President, the Mueller probe is the immediate thorn. Ergo leverage over the DAG toward the removal of that thorn is a priority. Exposing the previous and current DOJ and FBI corruption is of less importance to President Trump.
However, from the perspective of President Trump supporters, especially those who have done deep research into the former and ongoing abuse, the aggregate DOJ and FBI corruption is the priority; and exposing the soft-coup is the ultimate goal.
See the difference? (continue reading)
Following a signing ceremony for the ‘America Water Infrastructure Act‘ President Trump held a lengthy press conference in the Oval Office to cover a variety of topics.
During the Q&A the President said he may meet with Putin when he is in Paris in November. He also spoke about Saudi Arabia and Jamal Khashoggi, saying he wants all the facts before he makes a decision. Noting his conversations with foreign leaders, the President said: “Nobody likes what happened.”
Speaking about the Central American ‘migrant caravan’, he said he thinks 10,000 people are coming which spells out something needs to be done. “We’ll have to call up our military if we need to we cannot allow our country to be violated like this”, Trump said.

I have created this site to help people have fun in the kitchen. I write about enjoying life both in and out of my kitchen. Life is short! Make the most of it and enjoy!
De Oppresso Liber
A group of Americans united by our commitment to Freedom, Constitutional Governance, and Civic Duty.
Share the truth at whatever cost.
De Oppresso Liber
Uncensored updates on world events, economics, the environment and medicine
De Oppresso Liber
This is a library of News Events not reported by the Main Stream Media documenting & connecting the dots on How the Obama Marxist Liberal agenda is destroying America
Australia's Front Line | Since 2011
See what War is like and how it affects our Warriors
Nwo News, End Time, Deep State, World News, No Fake News
De Oppresso Liber
Politics | Talk | Opinion - Contact Info: stellasplace@wowway.com
Exposition and Encouragement
The Physician Wellness Movement and Illegitimate Authority: The Need for Revolt and Reconstruction
Real Estate Lending

