Posted originally on the CTH on April 20, 2023 | Sundance
As higher interest rates continue to put pressure on borrowers, the ability of the average person to afford a mortgage diminishes. Higher mortgage rates lead to downward pressure on residential home values as fewer borrowers can afford higher payments. Simultaneously, commercial real estate is dropping in value as vacancies continue increasing.
Put both of these issues together and already tenuous banks holding mortgage bonds as assets can become more unstable.
This dynamic creates the continual tremors in the background of an economy already suffering from high inflation and low consumer purchasing of durable goods.
A perfect storm starts to realize.
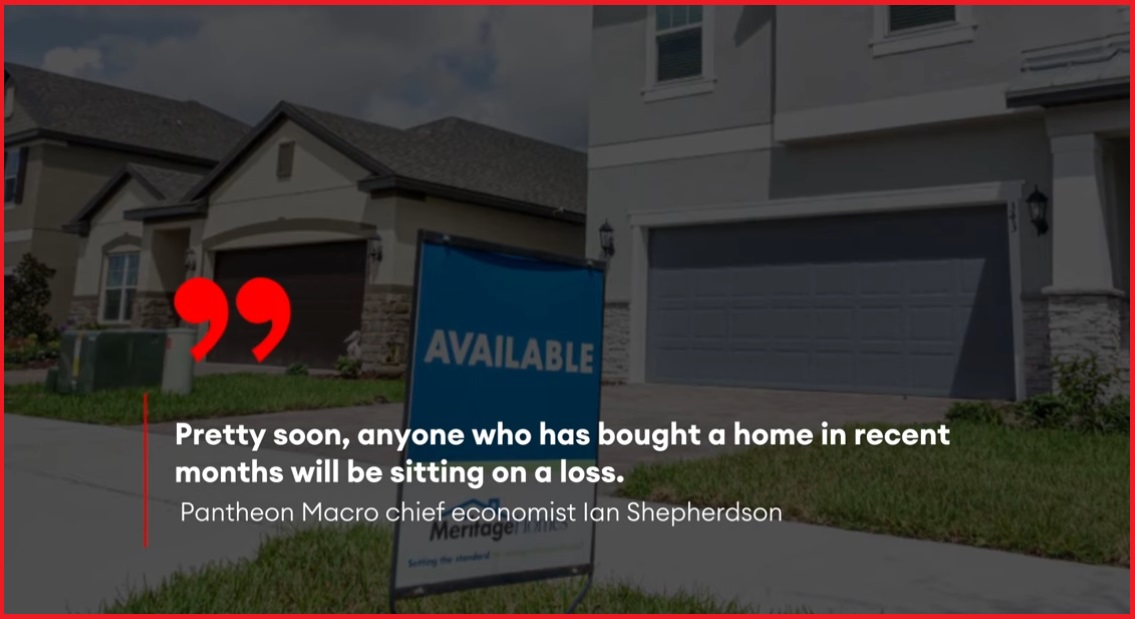
(Wall Street Journal) U.S. existing-home sales decreased 2.4% in March from the prior month to a seasonally adjusted annual rate of 4.44 million, the National Association of Realtors said Thursday. March sales fell 22% from a year earlier.
March marked the 13th time in the previous 14 months that sales have slowed. The housing market had a surprisingly strong February, when sales rose a revised 13.75% from the previous month. But after mortgage rates ticked higher, March sales resumed the extended period of declines.
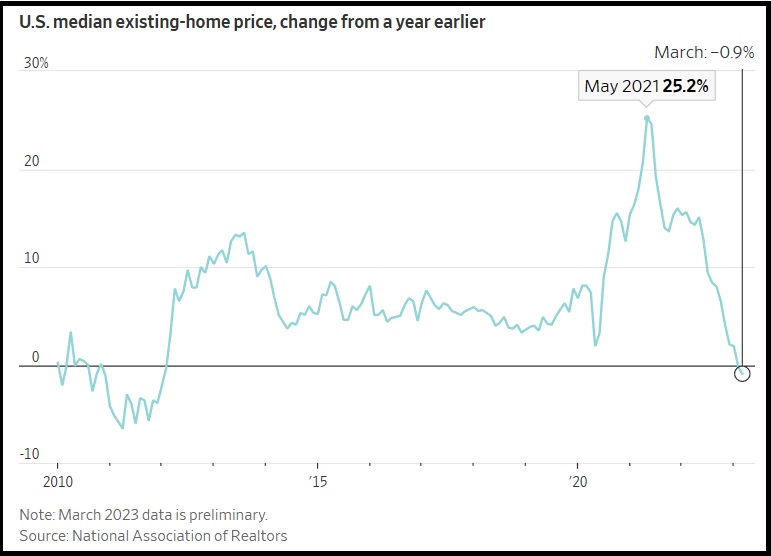
The housing market’s slowdown is now starting to weigh on prices, which have fallen on an annual basis for two consecutive months for the first time in 11 years. The national median existing-home price decline of 0.9% in March from a year earlier to $375,700 was the biggest year-over-year price drop since January 2012, NAR said.
Median prices, which aren’t seasonally adjusted, were down 9.2% from a record $413,800 in June. Home prices in the western half of the U.S. experienced some of the biggest gains for many years but are now falling the fastest.
[…] Housing starts, a measure of U.S. home-building, fell 0.8% in March from February, the Commerce Department said this week. Residential permits, which can be a bellwether for future home construction, dropped 8.8%.
The housing market slowdown shows one of the main ways that the Fed’s aggressive interest-rate increases are rippling through the economy. Housing is one of the most rate-sensitive economic sectors, and high housing costs have been a big contributor to inflation. (read more)
Before looking at today’s graph showing median existing home values, remember me saying this in 2021?:
“I said in June, at a macro level home prices had reached their peak (last two weeks of May, first two weeks of June was apex). Obviously, there are some geographic home value increases still happening as COVID related regional issues and work opportunities are shifting populations. There is also a lag and ripple effect that takes time to work through the economy. The macro-apex will not be visible until next year.”
When I said that in 2021, people said I was wrong. Well, with hindsight now visible within the data as it is reflected, look at the result:
May and June 2021 was the peak of year-over-year percent of change in median home value increases.
So, what was going on?
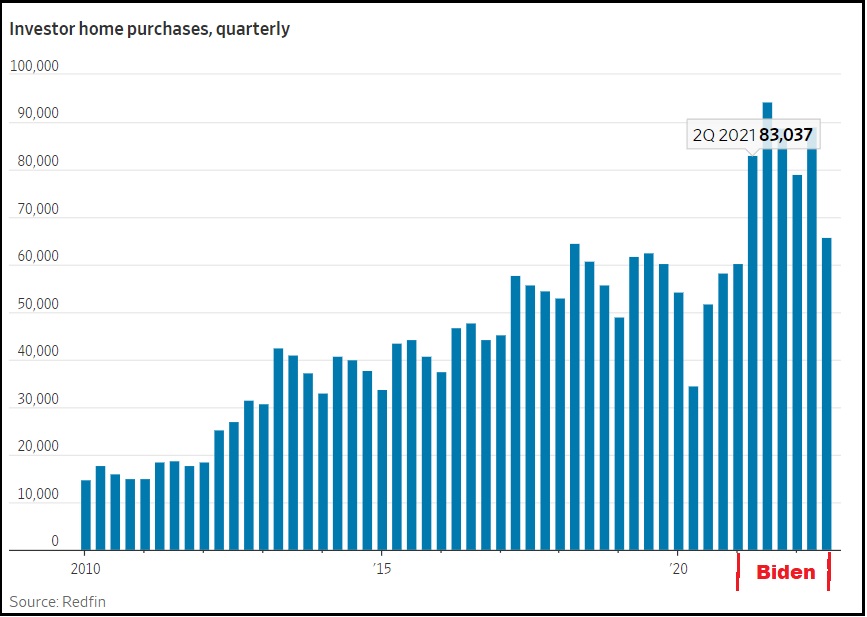
As CTH outlined in 2022: If you look closely at the timing (keep in mind the data reporting lag) what you will notice is that financial institutions began a big surge in purchasing hard assets, specifically real estate, as soon as Joe Biden took office (Jan ’21), and the economic policy became evident. Intangible financial instruments became an immediate risk as the professional financial control groups recognized energy policy would drive inflation (supply side) and devalued money would fuel it (demand side).
As an offset to predictable inflationary policy (the insiders’ game), institutional money (Blackrock, Vanguard etc) was moved into hard assets with tangible value.
This shift in asset allocation, institutional sales, helped fuel a false surge in home prices and their valuations. CTH was writing about this in 2021, and sounding alarms as it took place. 25% of all real estate purchases were being made by institutional investors.
We The People got screwed.
The dynamic was predictable. The Biden administration economic policy, energy policy and monetary policy, was going to cause massive inflation. CTH was shouting about it in early 2021 and warning everyone to prepare for waves of price increases that would naturally surface first on high-turn consumable goods, and then embed into longer-term durable goods.
Despite claims to the contrary, this 2021 inflationary explosion had nothing to do with the pandemic or supply chain shortages. It is entirely self-created by western governmental policy; the collective ‘Build Back Better’ agenda. You can see now from the background moves within the financial sectors, they too knew the reality and their money shifts reflected that despite their ‘transitory’ pretending they were mitigating their own exposure.
We the People were yet again going to be victims of specifically intended monetary, regulatory, energy and economic policy.
The investment class rulers of the WEF assembly shifted assets to avoid the pain that we would feel. We “would own nothing and be happy,” and their shifts would position them to own everything and be in control.
Overall govt spending and regulatory controls drove inflation for these past two years. The ‘demand side’ was blamed, despite the lack of demand. I will be proven right when history is concluded with this. Interest rates were raised by central banks in an effort to support the policies that are driving ‘supply side’ inflation, not demand side.
Energy policy was/is crushing the consumer by driving up the cost of all goods and services. To support the overall goal of changing global energy resource and development (a false and controlled global operation), central banks raised interest rates. Various western economies, including our own, have been pushed deeper into a state of contraction by central banks crushing consumer demand, and eliminating investment via increased borrowing costs.
In short, the goal was/is to lower energy consumption by shrinking the economic activity. This, according to the BBB plan, was needed at the same time as energy development was reduced. These economic outcomes are not organic, they are all being controlled by collective western government agreement.
Within this control dynamic, there was always going to be a point where the reaction of the people to their economic reality means the financial control elements need to shift direction. They will always maximize profit and minimized risk, while knowing what the larger objective remains.
Just like every other durable good, housing demand contracts as prices and costs become unaffordable. The loss of equity within your home is damaging to your own value or ability to borrow against it.
From the perspective of an institutional asset, that same equity drop is an investment loss. However, the investment loss is not materialized until the sale of the lower valued asset is completed. Retaining declining real estate on investment books, creates an artificially high appearance of the investment result; unless and until the real estate is sold at a diminished value.
As mortgage rates rise, just as a consumer would pull back from the housing market, so too will institutional investment groups now control the slow dumping of the asset to remove the equity they pumped into it. Much of the investment housing will be retained as rental housing, with the monthly rents being part of the returns on the investments. However, as this dynamic unfolds further investment purchases of houses stop, because the asset overall is declining in value. This halt of investment activity also worsens a steeper drop in home values.
Notice this line within today’s WSJ article: “The housing market had a surprisingly strong February, when sales rose a revised 13.75% from the previous month.”
What happened in February? The BIG CLUB [Blackrock, Vanguard, Citadel, etc.] moved liquid assets out of banks into hard assets (real estate), to avoid a predictable banking issue which surfaced a month later in March. They knew what was going to happen in banking, they moved their own assets to avoid it.