Posted originally on the conservative three house on August 14, 2021 | Sundance | 142 Comments
Dr. Douglas G. Frank explains information he discovered as he reviewed election outcomes. Dr. Frank found the baseline for the 2020 vote was created by applying an algorithm that used the 2010 census to fabricate the illusion of registered voters at a state level (predetermined), and then results are controlled at a county level.
Transcript courtesy of Stillwater:
0:01 – So here’s how our elections are being stolen. In a nutshell, this is how our elections are being stolen.
— Someone before the election decides what they want the outcome to be. It’s a decision ahead of time.
— And then they make projections and they say “Well, we think this is what’s going to happen…”
— So they want to regulate that at a county level to make sure they get the outcome they want. So what they do is they inflate the registration databases.
0:30 – Now this is before the election, and during the election, and after the election they’re manipulating the database. But beforehand they make an estimate of what they think is going to happen and they inflate the registration databases.
— So the beginning big hack… most of the hack of the election… takes place at this point beforehand. They inflate the registration databases.
0:51 – The reason they do that is because it gives them a credit line of phantom voters. In a nutshell this is how our elections are being stolen.
1:00 – Think about it. It would be a really stupid cheat to have an election happen and then afterwards you count the ballots and they don’t match the machine… That’s too easy. A recount is too easy of a thing to catch.
— So what they do instead is they bring a bunch of ballots and put them in. That way when the machines count the ballots they don’t have to cheat the machine.
— The machine’s job then is not to flip votes… even though we do have cases with that… The machine’s job is just simply to report progress.
— How are things going? Is it going as we predicted. If not, adjust it.
1:34 – And when you write a computer algorithm it does that kind of adjustment… It’s comparing to some target value. There’s a target value and then the computer is constantly checking saying “How is it going? Is it matching what we planned?” and then it’s constantly making adjustments.
— That’s why the machines are so important… And yes, absolutely the machines are connected to the internet.
— And then before the elections they also have to program the machines.
2:01 – And just to tease it again, I’ve been going around the country talking to people in different states and every once in a while I will come across a county clerk who says “Oh no Dr. Frank, we follow all the guidelines. Our elections are totally secure.”
— So I bring out the data. I show them the evidence. And they’re like “Oh, we were hacked huh?” Yup, you were. And then they’re not happy.
2:28 – And in several states now across the country people like that have said “Hey Dr. Frank, why don’t you bring your team in and let’s do a complete forensic audit of our machines.
— So you think that Maricopa is an audit? How would you like to do an audit where you have access to everything and nobody knows.
— We go in we take complete images of all the machines, of all the digital software that are in them, of all the routers, of everything.
— Before, during, and after the election. We record the activity during the election.
— All of that at the request of the county people. We have those.
3:13 – And so it’s always kind of comical to me when people say “Oh yea, but our machines are not connected to the internet. We have an air gap between our machines…” It’s like… your phone has an air gap between your phone and the internet. Yea, right, okay.
— It’s not real. Especially since we’re able to record the entire election through the internet during the election. Okay, we know they’re connected.
— So anyway. Get ready tonight.
3:45 – By the way, if someone knew that we had a complete recording of their election and it was going to expose a bunch of officials… What do you think might happen? Maybe we might have a few people that might want to come forward.
— Anyway so before the elections they program the machines. Yes?
4:09 – Then, during the election the databases continue to be hacked and tracked.
— We’ve got several situations where, during the actual election, we were downloading the registration databases from the county levels and keeping track…
— And it’s amazing. You can see them adding voters… removing voters. Adding voters who request ballots and received ballots even though nothing has happened.
— We’ve got records of all that happening in real time during the election.
— So that’s what’s happening during the election.
4:38 – And then after the election… You saw Patrick Colbeck sitting here. He’s been working in the state of MI for months and months on this.
— He has a term for this. He calls it The “eharmony dot com” phase…
— Because what happens is during the election they create all these voters… and then afterwards you have to put names onto them so that that way they can survive a subsequent audit.
— So he calls that the eharmony dot com.
5:02 – So you’ll notice that the whole point here is that throughout the entire election their computer algorithm is operating. Every county in our country is essentially hacked.
— Now the PCAPs (packet captures) and the electronic recordings we have show that they’re 3,009 so far.
— We haven’t even been been through all 37 terabytes. It’s just too huge of a job. It’s one of the reasons we’re having the symposium so we can bring in a bunch of cyber experts and they can help us.
— But we’ve got 3,009 of our counties already hacked. We’ve got evidence that they were hacked during the election.
5:35 – So there’s just no way that people are going to do that. It’s a computer algorithm that’s always operating that’s doing all that work.
5:45 – Don’t be afraid of that word algorithm. Algorithm is a word that we like to use in science because it’s just like a recipe. It’s a set of steps you do in order. But we like the word algorithm because that usually means there’s some equations mixed in… and some numbers mixed in.
6:11 – Now, how would you know if an algorithm was operating?
— So here’s a simple way to know if an algorithm is operating.
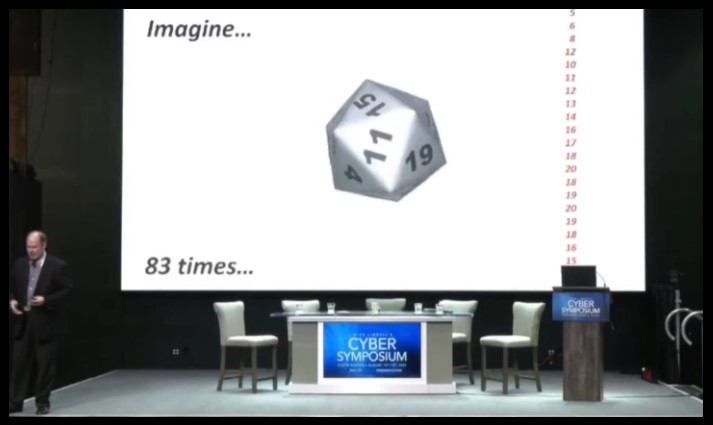
— Pretend you have a 20 sided die and you roll it 83 times. And you get a series of numbers… and you write them down.
— And so then you go over to the next county over in your state and you roll it 83 times again. And you get the exact same 83 numbers in the same order.
— Is that normal? No. That ain’t natural buddy.
6:45 – And what happens is then you go to another county in your state and you get the same 83 numbers in the same order. You know that’s not real. You know there’s some kind of algorithm operating. Something is controlling what’s happening. That’s not natural.
— What if you go to every county in your state and they’re all the same? Then you know that’s not real. That’s how you can know. Now you don’t have to be a math genius, you just know… 83 times in a row? That’s just not right.
— There’s a reason for “83”. I’ll tell you later. (See 22:58.)
7:20 – Let’s say we’re here in the state of South Dakota. What if I step over the border into Nebraska?
— Let’s say we go into Nebraska and we start rolling the die… and as soon as we step over the border, instead of it being the same 83 numbers, it’s a new set of 83 numbers.
— But every county in Nebraska has the same set of 83 numbers.
7:50 – And then let’s say we step over the border and go into Iowa and we have a whole new set of 83 numbers, but it’s the same in every county.
— What you would know at that point is that the numbers are being decided for each state and that they’re being controlled in each county.
— That’s what’s happening in our election. The elections are being decided ahead of time by state and they’re controlled at the county.
8:23 – Okay so this is how I figured this out.
— So because I teach at this special school for really bright kids… genius kids… it’s pretty fun… I call it recess. I go there a couple hours in the mornings during the week.
8:39 – I like to teach my differential calculus class… I like to pick a real example from real life… Because I can teach them all the calculus they’re supposed to learn in that year… probably isn’t a semester.. So I stretch it out and I put in real life examples. And we actually apply the calculus as they’re learning it.
8:55 – Number of People of Each Age in USA, 2010 – 2017 (Chart)
— So this year in September I picked the United States Census. Why did I pick that? Well because all the talk is about the 2020 census.
— So how do you analyze data like this? So I was teaching them how to use calculus… planning to teach them on the 2020 census when it came out. But all I had was the 2010 census.
9:18 – So I was studying the 2010 census and I prepared this graph in September before the election. And it’s a good thing because I think if I hadn’t been doing that I wouldn’t have figured this out.
— And I think it’s a Divine appointment.
9:36 – So you’ll notice in the census what they do is that bat curve, the blue curve, that’s from 2010. That’s the 2010 census. And that’s the last detailed census of the whole country before the election.
— And then you’ll notice that what they do is each year the United States Census just shifts it one year. Only they don’t just only shift it, they attenuate it for mortality. Because 90 year olds don’t just become 100 year olds. Some of them die off.
— So that’s what the census does. These are data from them. This is not me doing anything. I’m just showing you what they provide.
10:10 – And I’d been studying this. So all this was fresh in my mind when Kathy Barnette asked me to go to PA and study her data because her election had been stolen.
— So this was all fresh in my mind.
10:23 – Pennsylvania, District 04 (chart)
— Okay, so let’s just talk about her district. Pennsylvania, District 04. One of the most corrupt in the country. Another Divine appointment.
— Notice what I’ve got across here is a graph. This is 0 to 100 years old. And then here is 0 to 12,000.
— How many people of each age are there? And you can notice, you can kind of see there’s some wiggles and bumps. Here are the Baby Boomers and then people pass away.
— But you notice, not everybody gets to vote. Right?
— Because you have to take out the 0 to 17 year olds and not everybody above 18 gets to vote. There’s about 4% of people you have to take out.
11:01 – So this is who’s registered… I mean this is who… an eligible voter in PA District 04. About 550,000 people.
— Well here’s who’s registered to vote in PA District 04. (Chart shows 97.9% registered.)
— And when I showed this to the board of elections people and the legislature in PA they all said “What? No, no, no, no, no that can’t be right. It should only be 60 or 70% of the people registered.”
— Yea. The election people themselves don’t know this has happened.
11:40 – So in other words, nearly everybody is registered and they didn’t even know it.
— And so that’s a warning flag… that they don’t even know.
— This is supposedly who voted in PA District 04.
— And whenever I show this to people they say “Dr. Frank, from about 50 years up those curves look really a lot alike. The red curve just looks a little smaller than the black curve. What’s up with that?” Yea. I agree. Something’s wrong with that.
12:11 – In fact if I multiply the black curve by 86%… You notice it superimposes right on the red curve pretty well. It’s surprisingly well so of course as a scientist I know something called the correlation coefficient, this “R” number. I’ll tell you about that in a little bit. And definitely that’s a warning flag that it’s so high.
12:38 – Let me tell you about correlation coefficient.
— So if a correlation coefficient is “1”, then that means it’s a perfect correlation. It means one set of data predicts another set of data perfectly.
— If the “R” is “0”, that means it’s completely random versus each other.
— If it’s “-1” it means one goes up, one goes down.
12:57 – So anytime you have a correlation coefficient near “1”, which this is, that’s not natural. It’s something that’s going on that’s making the two agree with each other.
— In medicine, in anything to deal with people… If you get correlation coefficients in the .7, .8 range, you’re doing amazingly well. Because anything to do with sociology or medicine, anything to do with people is usually really low.
— In physics, if you’re between .8 and .9, you’re doing amazingly.
— To get .99, that ain’t natural buddy.
13:31 – Alright so… this is PA District 04… except I’m showing you now the 2010 census. I’m about to compare it to PA District 04.
— But this is actually the 2010 census. What I did is I shrunk it though, so that it’s the same size as PA, District 04. It’s not millions of people. It’s thousands of people.
13:55 – Now notice when I shift it 10 years to the right… because it’s not 2010 anymore, it’s 2020… and I include the mortality just like the census does…
— Let me just go back so you can see me do that. I’m just going to shift it to the right and include a little mortality.
14:14 – See what I did? Because why would I want to do that? Well because it isn’t 2010 anymore. It’s 2020.
14:23 – So now when we add who’s registered in PA District 04…
— This was my first clue that they were using the census to inflate the registration rolls.
— Now if you think about that it totally makes sense.
— Let’s say you want to add a bunch of people to a county. You want to add a bunch of phony voters. Are you just going to add a million 60 year olds? No that would stick out like a sore thumb.
14:53 – You have to add a certain number of each age. Well how many do you add? What do you compare it to? The census. And you use the best census available, the 2010 census.
— You shift it 10 years. You attenuate it to the size of the county and you fill up to there.
15:11 – And if you do that, if you fill up to there… you’ll notice it’s going to take on the shape of the census.
— And a couple of the distinguishing features are these 2 peaks on the side and this peak here.
— You’ll see those in every county in the country in the registration database… Because they’re filling up to the census.
— So it’s like a fingerprint in every county. And I’ve done thousands of counties now across the country and it’s in every county. And you’ll notice that ain’t natural buddy.
15:45 – So now I’m just going to teach you a little math. I’m going to make up a pretend county and then I’m going to show you some real data.
— So this is the census. Back to the real census again. And you’ll notice that it basically is about 4 million people of every age and then people naturally remove themselves from the voter rolls. That’s a joke.
— I’ll try that again.
16:10 – So you’ll notice there are about 4 million of every age and then people naturally remove themselves from the voter rolls.
16:20 – So here’s my pretend county. And you’ll notice I’ve given 15 people of every age until they’re about 60 and then they naturally remove themselves from the voter rolls.
— That’s a pretend county and it has 1,275 people in it. And the reason I picked that number is because if you take out the kids (17 and below), you end up with exactly a 1,000 people in my imaginary county. Eligible voters (18+, 1000)
— And my supermoms are always saying “Dr. Frank, you’ve got to make the math easy.”
16:50 – We have 1,000 people in our imaginary county. And you’ll notice about 15 people of every age and then they die.
— Now a certain percentage of those are going to be registered to vote. And I just picked this number, 13/15ths, or 87% because it fits with some other data.
17:11 – But I’ll tell you the story. When I first was developing these slides I have a dear friend who was my roommate in college who worked for Newt Gingrich for 30 years.
— I was practicing on him and showing him these slides. And he said “Oh Dr. Frank, that’s a really bad example.” “Why is that Mark?” He says “Well, there’s no way a county has 87% registration.”
— I’ve already shown you much more than that huh? So in other words, a guy who’s a political expert and he’s been doing it for 30 years thinks this is ridiculous. But boy did he have something to learn didn’t he?
17:44 – Okay. And then a certain percentage of those that are registered will vote.
— If I assume that’s 70%… Then you’ll notice you’ve got your population here; and then you have who is registered to vote; and then who actually voted. Make sense?
18:01 – By the way, if you know the blue curve (population) and you know the percentage (% registered to vote), you can get the black curve (# registered to vote).
— If you know the black curve (# registered to vote) and you know the percentage (% registered to vote), you can get the red curve (# ballots / actual votes).
— If you know any of the curves and you know the percentages (% registered to vote), you can get any of the other curves.
18:22 – That’s how I was able to leave PA with a set of algorithms in my hand, not knowing anyone who was registered in the state of OH… and I predicted every county in the state of OH before I even knew.
— And Mike was talking about that because I was bragging how great OH was right? “Oh, yea we got to figure it out in OH… we have secure elections.” Nope. I was able to predict them all. Then I realized, nope, this is everywhere.
18:50 – And I have to admit, you know, as a scientist you’re supposed to be skeptical of yourself. And I was. I could predict all these counties in PA.
— And so the state legislators, they said to me “Well, Dr. Frank have you tried any other states?” And I said “Well, no. I’ve been assuming all the corruption is here in PA.”
— And they said “Why don’t you try another state where you think there isn’t any corruption?”
— “Okay, I’ll do OH.” And then I was able to predict all of them.
— I tried FL. Nope. 14 counties then in FL. Oops.
— NC. Oops.
— CO. Oops. Everywhere I was going.
— And so I was starting to doubt myself a little bit. Like wait a minute. Is there something else going on here that I’m not thinking about because how can I go around predicting this everywhere, especially in states that I think Trump won? … You would think there is no manipulation here.
19:47 – Then I meet Mike Lindell and he talks about his electronic evidence and the fact that at the time he had 2,800 counties worth of incursion data.
— Oh. Now I understand. There are computer algorithms operating in every county in the country. No wonder I can predict it everywhere.
20:06 – Alright. Now here’s a real county. This is Hamilton County, OH. This is right near me. This is Cincinnati. It’s a big county. So these are real data now. Not makeup data.
— You’ll notice we have age across bottom again… And how many thousands of people of each age. You can see the Millennials and the Baby Boomers nice and clearly.
— This is OH now not PA.
20:28 – Here’s who’s registered to vote in Hamilton County, OH.
— Oops. When I showed this to the board of elections director in Cincinnati she was shocked.
— She’s like “How did that happen?” Exactly.
— Do you know why these people don’t know this has happened to them? Because these are big data sets. These are hard to work with.
20:53 – And what’s happened is the election companies give them software that allow them to work with their databases. The software that they’re given doesn’t do this. The software that they’re given just gives them totals and lists.
— And so they’re not used to even being able to do this.
— It takes a data geek. It takes a scientist. It takes someone that likes graphing and exploring data to begin to do this. So just showing them this is a shock.
21:17 – By the way, just while we’re here… You see these 2 peaks on the side… that’s the census isn’t it. It’s the breadcrumbs of the census peaking its way in.
21:27 – Alright, so that’s supposedly who’s registered. That’s a warning flag (#1).
21:32 – By the way, I’m not the only person to figure this out.
— In October, Judicial Watch published an article before the election showing that 353 of our counties in the United States, in 29 states, had voter registration more than the population.
— Why did we let this happen? We were being told that our election was being hacked. We all didn’t listen. We didn’t understand.
22:07 – So back to Cincinnati..
— Here’s who supposedly voted in Cincinnati. Do you notice a pattern? Just like in PA from about 50 years off. It’s about a perfect match.
— Let’s just compare that to make that easy for you to see.
22:22 – And if we give that number… I just chose the same number there that I did in PA, 86%… If we call that number the Registration Key…
— Think of it like a code. You’ve got one set of data and you have a key to break that code that allows you to convert this set of data to this set of data.
— And so that number would be 86%. That’s like a key. How do you convert this to this. You use that key.
22:48 – And the fact that that repeats… the same thing that happened… in a different state. This is OH now. The first thing I showed you was PA. (Warning flag #2.)
22:58 – But we wouldn’t have to have only one number. We wouldn’t have to have just 86%.
— We could have a percent for every 18 year old, a percent for every 19 year old, a percent for every 20 year old. We could have a different percent for every age. That would be 83 numbers.
— You’ve heard 83 before. 83 numbers… 18, 19, 20, 21, 22, all the way up to 100. You’ve got 83 numbers.
23:22 – So let’s say we had 83 numbers… And we could call that the key instead of just one number. It’s a collection of 83 numbers. (You need a different proportion for every age. Together they define the “Registration Key”.)
— And if we do that this is what you get.
— The black curve (predicted ballots) is what I would predict you would get.
— The red curve (ballots) is what we actually observed.
23:40 – And when I show this to people, they wisely noticed “Well, hey Dr. Frank, if you can just get 83 numbers you should be able to make it fit perfectly. How come it doesn’t quite fit perfectly?”
— Well the answer is because I didn’t use Hamilton County to get my percentages. I used Franklin County. And I used those percentages for every county in the state of OH. And it’s the same in every county.
24:07 – And this is what those 83 numbers look like. From 18 up to 100… 83 numbers. 83 percentages.
— And when I show this to people they’re like “Wait a minute. That’s a smooth curve. You mean the percentages from 18 to 100 vary smoothly?”
— Yes. In fact that’s called a 6th order polynomial.
24:30 – We scientists like polynomials to describe things. And what’s so fun about that is if I had put these data into Excel, which I did… I made this graph in Excel… And I right click on it and I say “Add a trend line.” Then it will say “Well what kind of line would you like to put in? Would you like it to be a 2nd order polynomial, or a 3rd order polynomial?”
— And you start adding. This little scroll button… You click on it… 4th order, 5th order, 6th order.
24:59 – When you hit 6th order it won’t go any higher. It’s stuck there. Because 6th order is as high as Excel goes.
— And guess what… Every state in our country I can predict this way with a 6th order polynomial.
25:10 – In other words … America was stolen by an Excel spreadsheet.
25:20 – Okay. So lets go back to this again.
— So you notice, once I know the percentages … If I know one thing I can get all the others. Yea?
— So all I have to do is go into any state, look at one county, and I can predict all the others… Because every state has its own key.
25:40 – Just like in the state with rolling the die 83 times. It works in every county in that state. But when you go into a new state it’s a new set of 83 numbers. So every state has its own key. Make sense?
25:54 – Okay. So, I had to pick a state so I just picked OH. Just to kind of let you see.
— Now, what I’m going to do in this set of 88 slides… They’re going to go by really fast. It takes 1 minute to play.
— What you want to look at is you can look at the “R” factors… How good it’s correlating…
— Or you can look at these bottom two graphs (predicted ballots & ballots)
— Or you can look at the black curve. (registrations)
25:16 – Let’s just review what they are:
— The blue curve is the population of a county.
— The black curve is who’s registered in that county.
— The red curve is who’s supposedly voted in that county.
— And the blue curve underneath is my prediction.
26:31 – Now what’s fun about these set of data is I’m going to make the prediction two different ways:
— I’m going to make the prediction based upon the population. Pretend I don’t even know who’s registered. I’m just going to make a prediction based upon the population.
— And then I’m going to make a second prediction if I did know who was registered.
26:49 – So I’m going to show you two graphs for every county. And they’re going to play… boom, boom, boom, boom… It takes about a minute to play or something like that.
— And what you’re going to be looking for is these bottom two graphs.
— And you’re going to notice that the population prediction isn’t quite as good as the registration prediction.
— But it makes sense. Because if I have to start from here to get to here I have to go through two numbers. So it’s harder to predict.
— I can go straight from there to there. That’s one way of predicting. Or I can go from the black to the red.
— So I’m going to predict them both ways for you.
27:22 – Prediction video. (88 slides)
— So this is all of them. And I know it’s a lot. But I just want you to see that every county is predictable two ways.
— Now I have been doing this across the country. And what I like to do is I like to get the data for a particular state; and do all the analyses; and then we release it in the state and people get all freaked out. And they say “Hey, we got a problem.” Yea, you got a problem.
27:55 – And then I’ll come out there and I’ll meet the supermoms and we have a few events. I meet with a few key legislators. We plan our event.
— A couple weeks later there’s a big event. The public is all worked up about it and we have a movement going.
28:11 – Right now I’ve done that in 13 states in person and I’m working with 30 total states. Our supermoms are kicking butt I tell ya.
28:33 – (Colored map of the U.S.)
— Alright, so here’s the thing. I’ve explained this to you. Now this is really just a top level analysis. I’ve got all kinds of other analyses that go down… In fact, I’ve got analyses that will take you right down to the precinct level and you can knock on doors and find phantom voters.
-But this just gives you the overall view so you kind of know what’s happened.
29:09 – (Responds to a question.) That isn’t what these predictions are. Keep in mind, to predict them I have to be able to get in the minds of the people who decided ahead of time what they wanted the outcomes.
— It’s not as easy as you think because sometimes the people getting elected are… you wonder, why would they elect that… you know… That’s a whole other discussion. Which we need to have that discussion.
29:35 – Okay, so I’ve just explained to you how our elections are being stolen. Now how do you explain this to your friends.
— It’s hard without the graphs.
— So I told you about rolling a die 83 times.
— Here’s another way to explain it to your friends and I developed this metaphor with my supermoms.
29:50 – Blonde Hair Analogy
— Let’s say you’re in the state of OH. Imagine you’re in the state of OH. Easy to do for the ladies in my state.
— And let’s say the 2020 census just came out. And you look at it and it says that 10.0% of the people in your county have blonde hair.
— And then you go to the next county over and you look at the 2020 census and it says 10.0% of the people there have blonde hair.
30:33 – And that’s a little puzzling because you’re Amish and they’re Mexican. You know as a county it’s kind of strange that they would be exactly the same percentages.
— But you keep looking around the state and every single county has 10.0% blonde hair.
— That just doesn’t make sense does it. You would think something is wrong with that.
30:52 – So you look at the next state over. You look at PA. And 13.4% of the people there in the very first county have blonde hair.
— Now wait a minute. Everybody in OH was 10.0%, but now suddenly it’s different?
— And every county in PA is 13.4%?
31:10 – So you go to FL and now every county there is the same but different than the previous. You know something is wrong with this don’t you.
— You go over to CO and it’s a new percentage, but every county has the exact same percentage of blonde hair.
31:23 – You know that can’t be right. You know that it’s being decided at a state level and controlled at the county level. So that’s a way to explain that.
31:33 – But it’s worse than that really. Because you remember that 10.0%?
— Imagine if that was just for 18 year olds. What if you have a different percentage for 19 year olds; and a different percentage for 20 year olds; and a different percentage for each age all the way up to 100.
31:51 – And they were all the same in every county and state.
— And it didn’t matter whether you were in a large county, small county, urban county, rural county, black county, white county, green county, doesn’t matter…
— The same percentages in every one. You know that isn’t real. That’s not natural.
— So that’s a simple way for you to explain to your friends. Just use the blonde hair analogy.
32:14 – Now the reason I’m going around the country is cause I’m a firm believer in the people. If they’re given the truth, they can be depended upon to meet any national crisis.
— Is this a national crisis? Yea, I think we just lost our country.
— Mr. Lindell in the movie Scientific Proof… We did that together… About 15 minutes in he said “It’s a good thing that we lost the election or we wouldn’t know we lost our country.”
— I wouldn’t have even have looked at this. That’s another Divine appointment.
32:42 – The great point is to bring them the real facts. And bringing them the real facts is what I’m trying to do and what Mr. Lindell is doing.
— Now the problem is I learned the bitter lesson that legislatures aren’t going to save us.
— I learned the bitter lesson that our legal system isn’t going to save us.
— No one is coming to save us. We are the people we are waiting for.
33:10 – And if I’ve learned anything from last year, politicians don’t start parades they join them. So you have to be the parade.
— And it’s not that the politicians are evil, its they need you. They’re good politicians who need you to start the parade and need you to be in the parade… need to build the parade so that they can accomplish their legislative agenda.
33:36 – I’ve seen several politicians here this week and they’re going to be heroes, but we need to equip them and we need to start the parade for them.
-So that’s what I’m doing. I’m going around starting parades.
33:47 – So I’m a physicist, so I like to use metaphors. So let’s pretend that this piece of aluminum… just a piece of aluminum. This is United States… this piece of aluminum.
— And here is me spreading the truth. That’s not the microphone working, that’s really annoying like that. And I can make that really loud and really annoying. It’s kind of annoying. And it’s all pervasive.
34:21 – So this is America. This is the truth resonating in America. We just have to make it really annoying. We just have to make it unbearable. We just have to keep getting louder and not let them silence us.
— So that’s it.