
Armstrong Economics Blog/Economics
Re-Posted Sep 13, 2020 by Martin Armstrong
Paris Erupts into Protests Against Macron & Lockdowns
Armstrong Economics Blog/Civil Unrest
Re-Posted Sep 12, 2020 by Martin Armstrong

Today in Paris, many thousands of “yellow vests” took to the streets to demonstrate against French President Emmanuel Macron and the French government over its draconian lockdowns and CORONA restrictions. This was a massive riot where police not only used tear gas and batons, they were firing both rubber bullets and live ammunition. These lockdowns are by no means about taking care of people. This is raw tyranny and we will see if they even stand for election in 2021/2022.
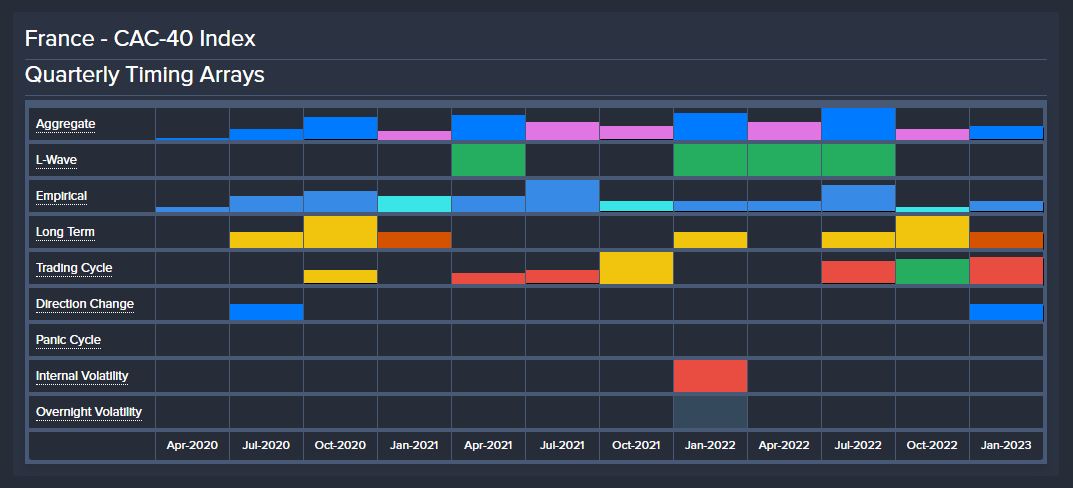
The next French Presidential election will begin Friday, April 8, 2022. What is interesting is when we look at the Quarterly Array on the French CAC-40, it is clearly showing the first quarter will be very volatile. This is clearly the impact of the French elections and there is a deep concern that Macron will even suspend the elections under the pretense of a national emergency as we saw in New Zealand. The protests of the “yellow vests” against Macron began back in November 2018. They were initially triggered by rising fuel prices and a pension reform plan. We are looking at sheer political chaos in France as the elections will come 43 months from the beginning of these protests (50% of 86).
Gold – Repo Crisis – New Green World Order
Armstrong Economics Blog/Cryptocurrency
Re-Posted Sep 11, 2020 by Martin Armstrong

QUESTION: Marty, they do not call you the legend for nothing. You nailed the crash earlier in the year and the very day of the low on March 23. Now your call for the September 3 target was again to the day. In the middle of this chaos, gold has not performed well. Given this is 21 years up, that does not give a lot of confidence for a continued rally just yet. Will you be doing the gold report soon?
HD
ANSWER: This year was a Directional Change for gold and the next turning point in 2022. Most of the volatility on gold appears to be the first six months in 2021. You must understand that this is far more than just a war against Trump to conquer Capitalism and impose drastically higher taxes and this New Green World Order that Bill Gates wants to eliminate meat production along with fossil fuels. The number of active oil wells in Texas has fallen from the 400 level to about 100. This is creating a massive shortage in everything from food to energy.
The first sports arena to open in Las Vegas is making it very clear – NO CASH accepted. They are actively making money scarce and telling everyone cash is dirty and spreads this life-threatening virus. This hoax is being carried out to usher in the cashless society so they can collect their 70% tax rates by force.
In Thailand, there were 58 deaths from this virus, yet 2,551 suicides because of losing everything. This virus has impacted absolutely everybody. No politician in their right mind would do this unless they are being bribed.
There remains a serious risk to the gold market that they will once again make it illegal. You must realize if they are trying to eliminate cash to force everybody back into banks so they can tax you, why would they allow gold or private cryptocurrencies to compete? Pay attention! California is trying to create RETROACTIVELY a wealth tax proposed by Elizabeth Warren on the advice of the French Marxist economist – Thomas Piketty. A wealth tax FORCES you to tell them ALL your assets EVERYWHERE even if in storage offshore. These are policies that the Democrats are championing and it will drive gold underground.
So, the answer is YES! I am preparing a very important report on precious metals.

 Anyone who thinks that this has not been orchestrated is delusional. I warned that our computer picked up this plot beginning in late August 2019. European politicians have gone along with Gates for one reason. The Repo Crisis began because Merkel publicly made it clear that there would be no bank bailouts in the Eurozone. That was because of the Italian banking system. But then Deutsche Bank was in trouble and she has to maintain that same policy.
Therein began the Repo Crisis. US banks would not lend in the REPO market to any European bank for fear if a collapse took place, they would be stuck with losses the Eurozone would not cover unlike the aftermath of the Lehman Brothers Crisis. Hence, the Fed had to step in and provide lending in the REPO for European central banks.

Consequently, creating this FAKE Pandemic has been the life-preserver for Europe. This has masked the banking crisis and justified now buying banking stocks, which is the indirect bailout, and the elimination of cash in Europe will force everyone to return to the banks. They need this HOAX to cover the banking crisis, but in the process, they have created a huge nightmare they did not foresee.
Suspending rents and preventing evictions while they imprison the population in lockdowns with no real pandemic which German Health Minister just had to admit, has undermined the banking system even further, Now they are talking behind closed doors about forgiving past rents for tenants. That does not address the collapse in commercial property. That is raising the Marxist issue of perhaps they should just confiscate those rental properties by nationalizing them.
The ideas being bounced off my ears are too absurd to think about. None of them propose a return to a gold standard – sorry!
ECB Thinking of Buying Bank Stocks
Armstrong Economics Blog/Central Banks
Re-Posted Sep 9, 2020 by Martin Armstrong

QUESTION: Buongiorno signor martin anche se mi piacerebbe chiamarla professore, è la Bce sta comprando azioni delle banche europee grz
AP
ANSWER: The ECB is looking into buying bank stocks because nobody else will. It is the only way to pretend they are meeting their capitalization. They are floating the idea of buying stocks, but they are not expressly saying bank stocks. It is another attempt to desperately try to hold on to this fiction. It will not succeed. They are buying stocks rather than doing bailouts. It amounts to the same thing, but they can claim it is not a bailout politically.
COVID Tax Increases – Forcing People to Pay For the Political Plandemic
Armstrong Economics Blog/Economics
Re-Posted Sep 7, 2020 by Martin Armstrong

These Democratic state governors have been so draconian in suppressing their economies for political purposes. Then they have the audacity to turn around and raise taxes to cover the losses in revenue. New Jersey raised gasoline taxes. California is trying to install the first wealth tax, thanks to the French economist Piketty. But California is looking to raise its income tax to 54% on the richest people. Their state income taxes, already the highest in the nation at 13.3%, is proposed to be raised to 16.8% RETROACTIVELY to pay for this plandemic.
In Tennesse, Davidson County’s property tax rate has been raised sharply from $3.155 to $4.221 per $100 of assessed value in the city’s more urban areas. For a home appraised at $250,000, that would mean an increase of about $666.25 per year. They are chasing people out of cities, and like the fall of Rome, they will keep raising taxes rather than reduce their own expenditures, which are driven by pensions. That is a 34% increase in property taxes.
The Center for Budget & and Policy Priorities is telling states to raise income taxes on the rich. They recommend: “High-income tax increases can generate substantial revenues for investments in people and communities that provide economic and social benefits over the long term.” New York City and Chicago are experiencing a flight of the rich. They get no safety and cannot leave their homes at night, and these people recommend raising income taxes on them sharply. The Wall Street Journal has reported, “Even Joe Biden would raise the top marginal rate on work to over 50%.” Our sources are saying they want to return the income tax before the Regan tax cuts to 70%.
Just who are these “rich” people the Democrats hate so much? About 9% of the households in America have income greater than $200,000. That is the husband and wife combined. They get almost 45% of all pre-tax income, according to the Tax Policy Center. Then there are the really rich, which include most politicians. They account for the top 0.4% of households, which works out to about 700,000 in total. These are households that have incomes greater than $1 million a year. They tend to earn 13% of all pre-tax income.
With the Reagan era, since the 1980s, those at the very top have experienced faster-growing incomes than the rest of America BECAUSE they are investors. This statistic is never explained, but the stock market and inflation have accounted for the bulk of these gains. The government prevents the average person from participating in investments because Social Security is just a slush fund for politicians — government bonds only.
The Congressional Budget Office estimates that the best-off 1% of American households that have an average annual income of $1.8 million (base on 2016 statistics) saw their inflation-adjust incomes before taxes nearly triple between 1979 and 2016. This is clearly the rise in the stock market and real estate values. Then, 9% of households benefited from investments by 75% while everyone else saw their pre-tax incomes rise by 33%. They will not address that the lower the income, the more government prevents them from investing for their retirement by seizing money for Social Security. If you are late on paying, they charge you interest far above any bank, but will never pay you interest on the money refunded. Taxes are always a one-way street.
The rich generally pay far more of their incomes in taxes than the average person thanks to the progressive nature of taxation. The top fifth of households got 54% of all income and paid 69% of federal taxes; the top 1% got 16% of the income and paid 25% of all federal taxes, according to the CBO. These statistics are skewed because the government benefits such as Social Security, food stamps, and welfare are never part of the analysis. The Marxists try to focus only on the remaining income for taxes and behind closed doors think it all belongs to them. It’s only a question of what they allow the great unwashed to retain.
Democrat Senator Sherrod Brown Proposing Digital Dollar
Armstrong Economics Blog/Cryptocurrency
Posted Sep 4, 2020 by Martin Armstrong

The Democrats putting forth legislation to create the Digital Dollar. This is all part of 5G so there can be instant payments that are required when it comes to eliminating paper money. This is the goal to ensure people pay taxes and to eliminate the underground economy. Interestingly, the illegal aliens they defend so much work for cash under the table. Anyone without a Social Security number will be prohibited from working. But what the heck. They will get 110% of the taxes they think people do not pay.
Australian Tyranny – Is Revolution Coming?
Armstrong Economics Blog/Australia & Oceania
Posted Sep 2, 2020 by Martin Armstrong
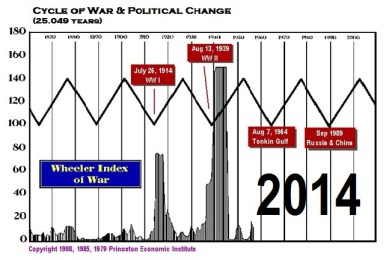
This video shows the tyranny in Australia as they arrested a pregnant woman for posting about a protest against the lockdowns. We have warned that the War Cycle, which includes Civil Unrest, turned up in 2014 and will build into intensity by 2022. This is not a forecast that has ever given me any pleasure. The two components are international war and civil unrest which leads to revolution. The worst seems to be on schedule for the Pi Target after 2024 and the peak of this 8.6-year business cycle wave of the Economic Confidence Model.
On January 1, 1901, the six colonies joined together forming the Commonwealth of Australia. The Revolutionary Cycle in Australia turned up in 2013, just slightly before the global War Cycle which turned up in 2014. The actions of the Australian government have completely turned toward an absolute authoritarian reign. Here you see that they are indeed monitoring all social media arresting a pregnant woman for merely posting on Facebook that a protest would take place. Even the German high court ruled that the government could not stop the protest on August 29th, 2020. Here in Australia, you see that the government has rejected every principle of a free society. Typically, the West would impose sanctions against Australia blocking all trade for they are treating their people no different than Russia invading Crimea as the West alleges, Syria, or Iran. Don’t forget the allegations against Iraq that it was a dictatorship.
The Australian Civil Unrest Cycle should begin to pop next year in 2021 and build into intensity by 2026. These politicians will be voted out of office so there will most likely be claims that in the middle of such a crisis, elections will be suspended. These politicians cannot now allow a free election for anyone who would then side with the people would be moved to arrest these politicians and prosecute them. Therefore, as long as Australian police act like the ones in this video, there will eventually be blood in the streets.
After the previous turning point of August 7th, 1964 which picked the Gulf of Tonkin Resolution incident to the day, there were massive protests against the Vietnam War. This is also the era when the Beatles wrote the song Revolution. Today, they would probably be thrown in prison for daring to even sing it. In Britain, the BBC is banning a song Rule Britania because it says they will never be slaves.
Never in my wildest imagination did I ever expect such a wholesale coup against our freedoms. This is what the rest of us face from 2021 on. Politicians no longer represent the people. They have simply gone mad. There are elections coming in 2021 around many places globally. I would expect them to be rigged, or even suspended for those in power doing this sort of oppression will surely not be re-elected. This is a global coup because the socialistic systems are failures which include the pensions for government workers.
Fundamentals & Confidence – Which is More Important in Markets?
Armstrong Economics Blog/Basic Concepts
Re-Posted Aug 30, 2020 by Martin Armstrong
QUESTION: Mr. Armstrong, You have said that fundamentals really mean nothing because the market runs on confidence. What about the fundamentals during the 2008 crash? Didn’t the bankruptcy of Lehman Brothers send the market down and then it was supported by TARP and the central banks?
Thank you;
GD
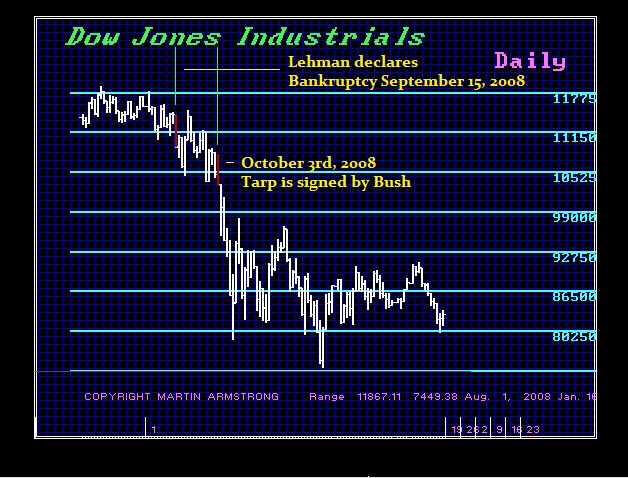
ANSWER: The entire economy is built upon CONFIDENCE and then that moves in ANTICIPATION of events which often may never even take place. Here is a chart of the Crash of 2008. You can easily see that the bankruptcy of Lehman was not really that devastating. Then you look at when the government passed TARP on October 3rd, 2008. The Dow fell from over 10,000 to mid 7000 levels in 5 days after TARP. It consolidated briefly but continued lower into the week 0of March 2nd, 2009. Obviously, the market continued to collapse as CONFIDENCE declined and there was NO INDICATION that the government intervention ever worked including the monetization by the Fed.
I have made it very clear that LOWERING interest rates has NEVER saved the day. The $700 billion they handed banks saved the banks, but they NEVER lent the money out. They lacked the CONFIDENCE that the crisis would end soon so they would not lend money and simultaneously people are NOT going to borrow to “stimulate” the economy when they too fear the future is just unknown. These theories are made up by academics who have NEVER traded in their lives. It is impossible to understand these concepts without hands-on experience.
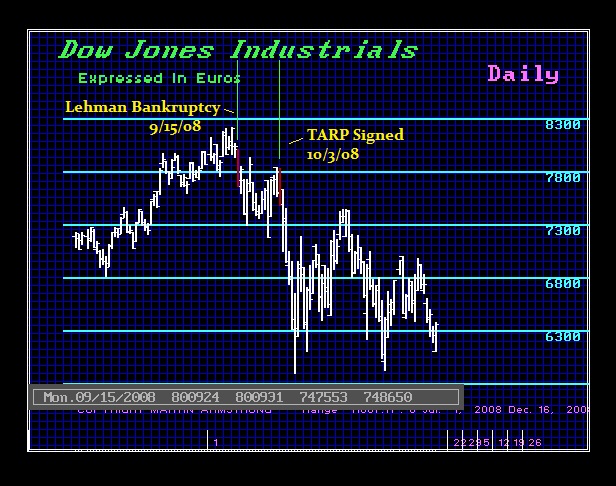
This is what Socrates writes for each day during the crash. You have to approach this objectively. There are more than 70 independent models correlating together to produce these results. Then everything must be looked at also from an international perspective. Internationally, Lehman had more of a bearish impact whereas TARP was seen as more positive internationally. What a difference currency makes.
Friday October 3, 2008
The Dow Jones Industrials made a new low penetrating the previous session’s low and then closed below that level plunging significantly again by 4.75% which strongly suggests we are entering a potential crash mode position. A break of today’s low of 1031025 during the next trading session will warn of a potentially serious decline ahead especially if it closes below today’s low again. The last important high was formed on Monday August 11th at trading days ago. Our projected support for tomorrow lies at 1018098 and a break of that level can set in motion a panic to the downside. Hence, pay close attention at this time.
We did close above the previous session’s Intraday Crash Mode technical support indicator which was 997310 settling at 1048285. The current crash mode support for this session was 999652 which we still closed above implying the market is holding for now. The Intraday Crash indicator for the next session will be 1002412. Now we have been holding above this indicator in the current trading session, and it resides lower for the next session. If the market opens above this number and holds above it intraday, then we are consolidating. Prevailing above this session’s low will be important to indicate the market is in fact holding. The Secondary Intraday Crash Mode technical support lies at 943412 which we are trading above at this time. A breach of this level with a closing below will signal a sharp decline is possible.
Intraday Projected Crash Mode Points
Today…… 999652
Previous… 997310
Tomorrow… 1002412
This market has declined for 2 trading days which has been a sharp decline of 5.25%. However, we have not elected any bearish Reversals to date from the high of Wed. 1st.
The Uptrend Line from the last low created at 1036545 tied to the secondary low made on 10/02 remains as resistance standing at 1046421. Only getting above this level on a sustained closing basis will signal a rally to the upside.
Currently, the market remains quite bearish below all our system support indicators with resistance starting at 1037142. The broader cyclical system indicators are also in a bearish position while the long-term trend and cyclical strength are bearish. This market has technically been trading beneath our projected envelope of support at 1050088 warning this decline has been rather reasonable down 10% from the high made 09/19. We have elected all four Bearish Reversals from that high showing weakness.
Monday October 6, 2008
The Dow Jones Industrials made a new low penetrating the previous session’s low and then closed below that level collapsing substantially again by 11% warning this market is entering a Panic Sell-Off. Penetrating today’s low 952532 and closing beneath it will tend to confirm that warning. The projected support for the next session lies at 907292. Penetrating this level intraday would warn of a panic to the downside becomes possible which strongly suggests we are entering a potential crash mode position. A break of today’s low of 952532 during the next trading session will warn of a potentially serious decline ahead especially if it closes below today’s low again. The last important high was formed on Monday August 11th at trading days ago.
Our projected support for tomorrow lies at 935730 and a break of that level can set in motion a panic to the downside. Hence, pay close attention at this time.
We did close above the previous session’s Intraday Crash Mode technical support indicator which was 999652 settling at 1032538. The current crash mode support for this session was 1002412 which we penetrated intraday and closed below warning this market is in a panic type sell-off. The Intraday Crash indicator for the next session will be 907292. Normally, when you open back above this pivot number or closed back above it then the sell-off is subsiding. So, watch this number which is dynamic for it changes with each session.
Intraday Projected Crash Mode Points
Today…… 1002412
Previous… 999652
Tomorrow… 907292
This market has declined for 3 trading days which has been a sharp decline of 12%. However, the overall decline has been more pronounced falling for 11 trading days. In the process, we have elected all four Daily Bearish Reversals from the high of 09/19.
Our projected pivot point remains as resistance standing at 1029645. Only getting above this level on a sustained closing basis will signal a rally to the upside.
As of now, the market remains quite bearish below all our system support indicators with resistance starting at 1036545. The broader cyclical system indicators are also in a bearish position while the long-term trend and cyclical strength are bearish. This market has technically been trading beneath our projected envelope of support at 1045207 warning this decline has been rather a spectacular crash down where emotions run high 17% from the high made 09/19. We have elected all four Bearish Reversals from that high showing weakness.
Tuesday October 7, 2008
The Dow Jones Industrials made a new low penetrating the previous session’s low and then closed below that level plunging significantly again by 8.58% which strongly suggests we are entering a potential crash mode position. A break of today’s low of 943667 during the next trading session will warn of a potentially serious decline ahead especially if it closes below today’s low again. The last important high was formed on Monday August 11th at 1186711 which was 41 trading days ago. Our projected support for tomorrow lies at 928188 and a break of that level can set in motion a continued panic to the downside where extreme support lies at 907521. Hence, pay close attention at this time.
We did close below the previous session’s Intraday Crash Mode technical support indicator at 1002412 settling at 995550 which alerted us to a further decline was likely going into the instant session. The immediate crash mode support for this current session was 907292 which we have now closed back above suggesting the crash is subsiding. The Intraday Crash indicator for the next session will be 907521. Now since we closed back above this indicator in the current trading session, then holding above this indicator for the next session will imply the decline is subsiding. The Secondary Intraday Crash Mode technical support lies at 906159 which we are trading above at this time. A breach of this level with a closing below will signal a sharp decline is possible.
Intraday Projected Crash Mode Points
Today…… 907292
Previous… 1002412
Tomorrow… 907521
This market has declined for 4 trading days since the last high established at 1088252 from which we have witnessed a decline of 13%. However, the overall decline has been more pronounced falling for 12 trading days which has been a decline of 17%.
Granted, this decline has penetrated the previous key cycle low established at 1045944 and it is sharply lower by 18% from the last high made 09/19. Most importantly, this market entered Crash Mode 3 days ago. This type of pattern warns we are in the throes of a near-term correction which is rather serious at this moment.
Interestingly, this market has fallen down for 5 days from highest close closed below the previous low warning that the market is still vulnerable. The next projected target support lies at 990658 and we have already broken below two extreme projected technical support levels. Naturally, any short position should include a protective intraday stop above the previous high for now.
Wednesday October 8, 2008
The Dow Jones Industrials made a new low penetrating the previous session’s low and then closed below that level plunging significantly in panic mode for the fifth consecutive time by 9.17%. This does warn that this market is in crash mode position right now. A break of today’s low of 919478 during the next trading session will warn of a potentially serious decline ahead especially if it closes below today’s low again. The last important high was formed on Monday August 11th at 1186711 which was 42 trading days ago. Our projected support for tomorrow lies at 902755 and a break of that level can set in motion a continued panic to the downside where extreme support lies at 885724. Hence, pay close attention at this time.
We did close above the previous session’s Intraday Crash Mode technical support indicator which was 907292 settling at 944711. The current Crash Mode support for this session was 907521 which we closed above at this time. The Intraday Crash indicator for the next session will be 885724. Up to now, the market has been holding above this Crash Mode indicator in the current trading session, but it is still declining sharply. Granted, it is also moving lower for the next session. A consolidation would only be suggested by opening above this target, and holding this session’s low of 919478 intraday. However, a break of this session’s low followed by a closing below this level as well will warn that a continued sharp decline is still in motion.
Intraday Projected Crash Mode Points
Today…… 907521
Previous… 907292
Tomorrow… 885724
This market has declined for 5 trading days since the last high established at 1088252 from which we have witnessed a decline of 15% qualifying this as a correction. However, the overall decline has been more pronounced falling for 13 trading days which has been a decline of 19%.
Granted, this decline has penetrated the previous key cycle low established at 1045944 and it is sharply lower by 20% from the last high made 09/19. Most importantly, this market entered Crash Mode 4 days ago. This type of pattern warns we are in the throes of a near-term correction which is rather serious at this moment.
Interestingly, this market has fallen down for 6 days from highest close closed below the previous low warning that the market is still vulnerable. The next projected target support lies at 966672 and we have already broken below one extreme projected technical support level. Naturally, any short position should include a protective intraday stop above the previous high for now.
Factually, the market remains quite bearish below all our system support indicators with resistance starting at 1031025. The broader cyclical system indicators are also in a bearish position while the long-term trend and cyclical strength are bearish. This market is also trading mostly below the bank of eight moving average indicators suggesting it remains in a mixed posture for now.
This market has technically been trading beneath our projected envelope of support at 1017578 warning this decline has been rather a spectacular crash down where emotions run high 19% from the high made 09/19. We have elected all four Bearish Reversals from that high showing weakness.
Thursday October 9, 2008
The Dow Jones Industrials made a new low penetrating the previous session’s low and then closed below that level collapsing substantially for the sixth consecutive time by 10% warning this market remains in a Panic Sell-Off. Penetrating today’s low 857919 and closing beneath it will tend to confirm that warning. Our extreme projected underlying support for tomorrow lies at 799800. This market has immediately declined for 6 trading days. This does warn that this market is in crash mode position right now. A break of today’s low of 857919 during the next trading session will warn of a potentially serious decline ahead especially if it closes below today’s low again. The last important high was formed on Monday August 11th at 1186711 which was 43 trading days ago.
Our projected support for tomorrow lies at 835591 and a break of that level can set in motion a continued panic to the downside where extreme support lies at 819531. Hence, pay close attention at this time.
We did close above the previous session’s Intraday Crash Mode technical support indicator which was 907521 settling at 925810. The current Crash Mode support for this session was 885724 which we penetrated intraday and closed below warning this market is in a panic type sell-off. The Intraday Crash indicator for the next session will be 819531. Normally, when you open back above this pivot number or closed back above it then the sell-off is subsiding. So, watch this number which is dynamic for it changes with each session.
Intraday Projected Crash Mode Points
Today…… 885724
Previous… 907521
Tomorrow… 819531
This market has declined for 6 trading days since the last high established at 1088252 from which we have witnessed a decline of 21% qualifying this as a correction. However, the overall decline has been more pronounced falling for 14 trading days which has been a decline of 25%.
Granted, this decline has penetrated the previous key cycle low established at 1045944 and it is sharply lower by 26% from the last high made 09/19. This type of pattern warns we are in the throes of a near-term correction which is rather serious at this moment.
Interestingly, this market has dropped for several days and closed below the previous low warning that the market is still vulnerable. The projected extreme target support for tomorrow lies at 799800 which needs to hold on a closing basis to imply a bounce can form thereafter.
Up to now, the market remains quite bearish below all our system support indicators with resistance starting at 952532. The broader cyclical system indicators are also in a bearish position while the long-term trend and cyclical strength are bearish. This market is also trading mostly below the bank of eight moving average indicators suggesting it remains in a mixed posture for now.
This market has technically been trading beneath our projected envelope of support at 999397 warning this decline has been rather a spectacular crash down where emotions run high 25% from the high made 09/19. We have elected all four Bearish Reversals from that high showing weakness.
Friday October 10, 2008
The Dow Jones Industrials made a new low penetrating the previous session’s low after opening below it and then closed below that level collapsing substantially for the seventh consecutive time by 27% warning this market has been in a Panic Sell-Off after 7 days down. It is possible that we may have a temporary low forming. The extreme projected underlying support for today was 799800 which today’s action did penetrate intraday but we closed above that at the end of the session. Our extreme projected underlying support for tomorrow lies at 713534.
Indeed, this market has declined sharply bringing to bear the full scope of emotions in such declines. We need a higher open and a break above today’s high of 890128 while holding today’s low of 788251 to suggest a bounce is in order.
The Projected Breakout Resistance indicator resides at 865254 which we are already exceeded intraday but the market closed below it as of this session’s closing at 845119 Still, this typically implies that this market will rally to test overhead resistance if we exceed that level again intraday.
Intraday Projected Breakout Resistance
Today…… 923667
Previous… 941209
Tomorrow… 865254
Clearly, this market has been in crash mode position up to now. A break of today’s low of 788251 during the next trading session will warn of a potentially serious decline ahead especially if it closes below today’s low again. The last important high was formed on Monday August 11th at 1186711 which was 44 trading days ago.
Our projected support for tomorrow lies at 760663 and a break of that level can set in motion a continued panic to the downside where extreme support lies at 745394. Hence, pay close attention at this time.
We did close below the previous session’s Intraday Crash Mode technical support indicator at 885724 settling at 857919 which alerted us to a further decline was likely going into the instant session. The immediate Crash Mode support for this current session was 819531 which we have now closed back above suggesting the crash is subsiding. The Intraday Crash indicator for the next session will be 745394. Now since we closed back above this indicator in the current trading session, then holding above this indicator for the next session will imply the decline is subsiding.
Intraday Projected Crash Mode Points
Today…… 819531
Previous… 885724
Tomorrow… 745394
This market has declined for 7 trading days since the last high established at 1088252 from which we have witnessed a decline of 27% qualifying this as a correction. However, the overall decline has been more pronounced falling for 15 trading days which has been a decline of 31%.
Granted, this decline has penetrated the previous key cycle low established at 1045944 and it is sharply lower by 32% from the last high made 09/19. This type of pattern warns we are in the throes of a near-term correction which is rather serious at this moment.
Interestingly, this market has dropped for several days and closed below the previous low warning that the market is still vulnerable. The projected extreme target support for tomorrow lies at 713534 which needs to hold on a closing basis to imply a bounce can form thereafter.
Presently, the market remains quite bearish below all our system support indicators with resistance starting at 943667. The broader cyclical system indicators are also in a bearish position while the long-term trend and cyclical strength are bearish. This market is also trading mostly below the bank of eight moving average indicators suggesting it remains in a mixed posture for now.
This market has technically been trading beneath our projected envelope of support at 981467 warning this decline has been rather a spectacular crash down 31% from the high made 09/19. We have elected all four Bearish Reversals from that high showing weakness. We have not elected any Bullish Reversals from this low today.
The Threat to Gold
Armstrong Economics Blog/Gold
Re-Posted Aug 26, 2020 by Martin Armstrong

QUESTION: In regards to your last post about Bitcoin and your comment that there may be a “threat regarding gold”, as well. What kind of threat do you think? If you own precious metals as a store of value and assume at some point you may need to use it to pay for things, they may have to get turned into dollars (or an alternative digital currency being forced) in order to buy products. My thought is that there will be a tax law passed that somehow taxes gold/silver when you sell it, not necessarily based off the capital gains. What is your take on this and what do you see the government potentially doing to discourage, force an alternative, or even ban people from having precious metals? Thanks for all your insight.
B
ANSWER: Gold bullion was listed as a black market circumventing Bretton Woods. They seized $38,000 in gold bars from a woman crossing the Canada-US border. You already cannot transport gold internationally. What most people do not realize is that even hopping on a plane, even on a domestic flight, carrying more than $10,000 in cash gives them the right to confiscate it. They confiscated $181,000 in cash from a man on a domestic flight.
Therefore, the risk is that they go beyond simply confiscating gold in transport, but they move to even shut-down physical dealers who already must report on transactions. They can plainly make gold illegal in transactions just as they now make it illegal to pay for even a hotel in cash with more than €1,000.
Phillips Curve is Dead & the Fed Will Respond
Armstrong Economics Blog/Economics
Re-Posted Aug 26, 2020 by Martin Armstrong
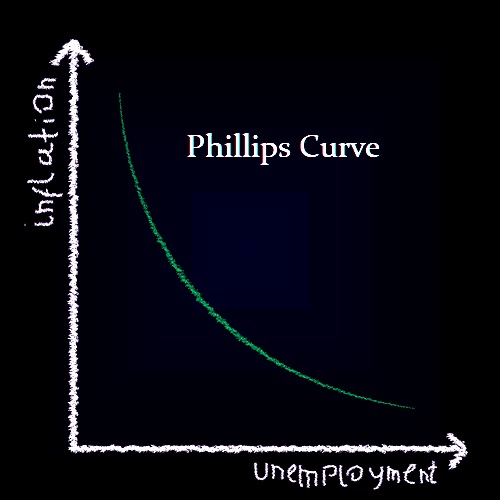
The Phillips Curve states that inflation and unemployment have an inverse relationship. Higher inflation is associated with lower unemployment and vice versa. The Fed is actually recognizing that the Phillips Curve is dead. I have been warning that the Quantity Theory of Money is also dead because all the tremendous increases in the money supply since the Great Recession 2007-2009 has failed to produce inflation or stimulate the economy. Instead, this has led to negative interest rates since 2014 which have undermined the entire Keynesian Model as well.

This is why the book I put out Manipulating the World Economy keeps selling out. All three editions are gone. Every time Amazon listed the books, they were gone in less than 3 hours. All of these theories were dealt with and this book has had a major impact already. Of course, the goldbugs and Bitcoin advocates hate my guts because it does not support the old theories they rely on which indeed were the VERY SAME theories used by the central bankers which have failed. This has led to many deep conversations about how these theories no longer work and what is the future.
The media is portraying the Fed will create inflation now in a big way. Those forecasts are still relying upon these old theories which have failed to produce anything these projections said were going to happen including hyperinflation.
CNBC claimed that the Fed was going to deliver a major speech that would change the way the Fed views inflation and that this will somehow effortlessly restore everything back fo a normal inflation level. Missing in all of this remains CONFIDENCE. Not until people begin to look at these theories and how they have failed as is taking place in central banks behind the curtain, they will not grasp the risks of the future.
