Posted originally on CTH on April 17, 2025 | Sundance
Health and Human Services Secretary Robert F Kennedy Jr provides an update on the latest scientific study of the growth in Autism cases within the U.S and a new HHS initiative to find the root causes.
As noted by RFK Jr, there is no longer any valid scientific debate about the rate of growth in Autism, specifically around young boys. Something environmental is causing the trigger that generally occurs after the age of two-years-old. The scientific research on the scale of the problem is jaw-dropping as outlined in the secretary’s remarks. WATCH:
Posted originally on Apr 15, 2025 by Martin Armstrong
The United States has about 330 million people, and one in every $3 spent in world trade is by American Consumers. Europe has 450 million people, but it still clings to Marxism, is highly regulated, and is very anti-entrepreneurial. Trump fails to grasp here that trade wars will NOT even the score. The global consumer market seems to be ignored. As I have explained, the Current Account, which people call the trade account, also includes all interest and dividends on stocks, bonds, and investments. In theory, if China bought 100% of the US national debt, then the perceived trade deficit from interest of $1 trillion would flow to China, and this has nothing to do with jobs or manufacturing anything.
Let’s clarify trade. The United States has the largest economy in the world, so it’s the top contributor to global consumer spending. China would be next, followed by countries like Japan, Germany, the UK, India, and so on. Note that China is already the #2 consumer-based economy. Europe is far too Marxist, and it still clings to the old theories of Mercantilism. The average German has less net wealth than an Italian, yet they are the biggest economy.
In recent years, the global GDP has been around $100 trillion. Depending on the economy, consumer spending typically makes up about 60-70% of a country’s GDP. So, if we take 65% of $100 trillion, that’s about $65 trillion in global consumer spending annually in theory. Now, breaking this down by country. The US GDP is around $25 trillion. If US consumer spending is about 68% of GDP, that would be roughly $17 trillion. Therefore, the US share would be 17/65, approximately 26%. That means we have a US consumption-driven economy.
China’s GDP is around $18 trillion. However, consumer spending as a percentage of GDP is lower, maybe around 40%, because their economy is more investment—and export-driven. So 40% of $18 trillion is $7.2 trillion. That would be about 11% of the global total ($7.2T / $65T).
Let’s compare this to Japan’s GDP, which is about $4.9 trillion. Consumer spending there is higher as a percentage, maybe around 55%, so $2.7 trillion. That’s roughly 4.15% globally.
Germany’s GDP is around $4.2 trillion. With consumer spending at around 50% of GDP, that’s $2.1 trillion, so 3.2% globally.
India’s GDP is approximately $3.4 trillion. Consumer spending accounts for a larger part, maybe 60%, so the total is $2.04 trillion, which is about 3.14% of the global total.
The UK’s GDP is about $3.1 trillion. Consumer spending at 60% would be $1.86 trillion, so around 2.86%.
France’s GDP is $2.9 trillion. Consumer spending at 55% gives $1.6 trillion, about 2.46%.
Brazil’s GDP is $2.0 trillion. If consumer spending is 60%, that’s $1.2 trillion, so 1.85%.
Italy’s GDP is $2.1 trillion. Consumer spending at 60% would be $1.26 trillion, around 1.94%.
Canada’s GDP is $2.0 trillion. Consumer spending at 57% gives $1.14 trillion, which is 1.75%.
South Korea’s GDP is $1.7 trillion. Consumer spending at 50% is $0.85 trillion, so 1.3%.
Russia’s GDP is around $1.8 trillion. If consumer spending is 50%, that’s $0.9 trillion, about 1.38%.
Australia’s GDP is $1.6 trillion. Consumer spending at 55% would be $0.88 trillion, 1.35%.
Consequently, the total for these top countries is around 59.65%, leaving about 40.35% for the rest of the world. This is all based on rough estimates. Then we also have nominal GDP vs. PPP (Purchasing Power Parity). However, consumer spending in nominal terms is usually what’s used for such global comparisons, further complicating our exercise.
Another consideration: The figures I used for consumer spending as a percentage of GDP might not be accurate for each country. For example, China’s consumer spending as a percentage of GDP has been increasing but was historically lower. According to the World Bank, in 2022, China’s household final consumption expenditure was about 38% of GDP. The US was around 68%, Japan about 55%, Germany 52%, India was around 59%, UK 63%, France 54%, Brazil 64%, Italy 61%, Canada 57%, South Korea 48%. So my initial estimates were somewhat close but may need adjustment.
US: 25T GDP * 68% = 17T
China: 18T * 38% = 6.84T
Japan: 4.9T * 55% = 2.695T
Germany: 4.2T * 52% = 2.184T
India: 3.4T * 59% = 2.006T
UK: 3.1T * 63% = 1.953T
France: 2.9T * 54% = 1.566T
Brazil: 2.0T * 64% = 1.28T
Italy: 2.1T * 61% = 1.281T
Canada: 2.0T * 57% = 1.14T
South Korea: 1.7T * 48% = 0.816T
Russia: 1.8T * 52% = 0.936T (assuming 52%)
Australia: 1.6T * 55% = 0.88T
Spain: 1.4T * 58% = 0.812T
So total consumer spending from these 14 countries is approximately $41.389 trillion out of about $65 trillion globally.
Now, converting each country’s consumer spending to a percentage of global:
US: 17 / 65 = 26.15%
China: 6.84 / 65 ≈ 10.52%
Japan: 2.695 / 65 ≈ 4.15%
Germany: 2.184 / 65 ≈ 3.36%
India: 2.006 / 65 ≈ 3.09%
UK: 1.953 / 65 ≈ 3.00%
France: 1.566 / 65 ≈ 2.41%
Brazil: 1.28 / 65 ≈ 1.97%
Italy: 1.281 / 65 ≈ 1.97%
Canada: 1.14 / 65 ≈ 1.75%
South Korea: 0.816 / 65 ≈ 1.26%
Russia: 0.936 / 65 ≈ 1.44%
Australia: 0.88 / 65 ≈ 1.35%
Spain: 0.812 / 65 ≈ 1.25%
Others: 36.3%
Please remember that these percentages are estimates of global consumer spending by country based on GDP and consumption patterns. The United States is the largest consumer-based economy in the world, and about 26% of total world spending involves the American consumer. China is only 10.5%, and Japan is at 4.1%. Europe comes in at around 12%.
In summary, China is actively trying to build a more consumer-based economy, with policies and trends supporting this shift. However, structural and demographic challenges might slow this transition into 2028. The progress is evident, but it’s a work in progress. After 2032, they hold the potential to surpass the United States as the financial capital of the world. The problem in the United States is that the Democrats keep trying to oppress the economy like Europe, imposing socialistic goals that are not economically efficient.
Key Evidence of China’s Transition:
Rising Consumption Share of GDP:
Household consumption contributed 53% of GDP in 2023, up from ~35% in 2010. While still lower than the U.S. (~68-70%), this marks significant growth.
Services and high-tech industries are expanding, reflecting demand for healthcare, education, and entertainment.
Policy Shifts:
“Dual Circulation” Strategy:
Emphasizes domestic consumption (internal circulation) alongside international trade, reducing reliance on exports.
Social Reforms:
Efforts to strengthen social safety nets (pensions, healthcare) aim to lower household savings rates, freeing income for spending.
Urbanization and Middle-Class Growth:
Over 60% of China’s population now lives in cities, fostering a consumer class with higher disposable income.
E-Commerce and Digital Economy:
China leads globally in e-commerce (e.g., Alibaba, JD.com) and digital payments, facilitating consumer spending. The digital economy accounts for ~40% of GDP.
Challenges to a Consumer-Driven Model:
Structural Imbalances:
Investment and exports still dominate (e.g., state-led infrastructure, real estate). Transition requires rebalancing toward the private sector and services.
Household debt
has risen to ~62% of GDP (2023), potentially constraining spending.
Demographic and Social Factors:
Aging Population: By 2035, 30% of citizens will be over 60, likely increasing savings and reducing consumption.
Income Inequality: Rural-urban gaps and uneven wealth distribution limit broad-based consumption growth.
Geopolitical and Economic Risks:
Trade tensions and global demand volatility (e.g., post-COVID, U.S.-China decoupling) pressure China to prioritize domestic demand.
Real estate sector
Slowdowns could dampen consumer confidence.
China is deliberately building a consumer-based economy through policy reforms, urbanization, and digital innovation, rejecting the European mercantilist economic philosophy. While progress is evident, structural hurdles, such as reliance on investment aging demographics, mean the transition will be gradual but ongoing. The government’s success in addressing these challenges will determine the pace and sustainability of this shift. China’s economy remains a hybrid model, blending consumption growth with traditional drivers like state investment.
The current account is a key component of a country’s balance of payments, recording international transactions in goods, services, income, and transfers. It consists of four main components:
Trade in Goods (Visible Trade):
Exports and imports of tangible products (e.g., machinery, vehicles, electronics).
The balance of trade in goods is often referred to as the “merchandise trade balance.”
Trade in Services (Invisible Trade):
Exports and imports of intangible services (e.g., tourism, financial services, education, consulting, transportation).
Combined with trade in goods, this forms the trade balance (goods and services).
Primary Income (Income Flows):
Cross-border income from investments and employment:
Investment income: Dividends, interest, profits from foreign investments (e.g., dividends from overseas stocks).
Compensation of employees: Wages, salaries, or benefits earned by workers in a foreign country (e.g., remittances from expatriates).
Secondary Income (Current Transfers):
One-way transfers where no goods, services, or assets are exchanged in return:
Remittances: Money sent by migrants to their home country.
Foreign aid/grants: Government transfers (e.g., disaster relief, development aid).
Pensions, gifts, or donations: Transfers between individuals or organizations.
A Trade War based on just the gross of the Current Account does NOT reflect our trade deficit or surplus.
Foreign investors overall own roughly 10-20% of Manhattan’s high-end residential properties (e.g., condos), with Europeans constituting a significant but minority share of this group. For example, if Europeans account for 30-40% of foreign-owned properties, their stake might be 3-8% of Manhattan’s luxury residential market. While exact figures are elusive, Europeans likely own 3-7% of Manhattan’s total real estate, with higher concentrations in luxury residential and prime commercial sectors. This is only an estimate and not definitive. Any income, such as rents, on that property will flow out through the current account and will appear as a trade deficit when it has NOTHING to do with trade.
As of 2023, approximately 23-24% of the total U.S. national debt is held by foreign entities. This calculation is based on foreign holdings of around $7.4 trillion out of $31.4 trillion at the time. Therefore, of about $1 trillion in interest expenditures. Thus, about $230+ billion is flowing out through the current account that has nothing to do with trade. The major holders of US national debt include Japan, China, and the United Kingdom.
Understanding these components is now CRITICAL in the middle of a trade war. The sale of US debt will go through the capital account, but it will reduce the interest paid to foreigners that go through the current account, creating the illusion of a trade deficit. I disagree with Trump’s formulas, and the risk of a permanent trade war with China is now assured unless he gets on a private phone call. You cannot make public demands against China for then they cannot back down based on their culture.
Posted originally on CTH on April 8, 2025 | Sundance
After previously saying her number one concern about President Trump’s tariff program was Beijing dumping all their excess products into the EU at a discount, EU Commission President Ursula von der Leyen announces she is coordinating the tariff response with China.
Apparently, the EU recognizes the ideological alignment of support from Canada just isn’t going to be enough to pressure President Trump and retain leverage into the U.S. market. This is quite a remarkable admission from von der Leyen all things considered. [STATEMENT]
President von der Leyen held today a phone call with Premier Li Qiang to discuss the state of EU-China relations, as 2025 marks the 50th anniversary of diplomatic ties.
The two leaders held a constructive discussion during which they took stock of bilateral and global issues.
The President underscored the vital importance of stability and predictability for the global economy. In response to the widespread disruption caused by the US tariffs, President von der Leyen stressed the responsibility of Europe and China, as two of world’s largest markets, to support a strong reformed trading system, free, fair and founded on a level playing field.
The President called for a negotiated resolution to the current situation, emphasising the need to avoid further escalation.
President von der Leyen emphasised China’s critical role in addressing possible trade diversion caused by tariffs, especially in sectors already affected by global overcapacity.The leaders discussed setting up a mechanism for tracking possible trade diversion and ensuring any developments are duly addressed. (more)
In the 2017 – 2019 version of the same dynamic, the EU was slow to realize the Trump impact to the Chinese economy would lead to less industrial purchases from Beijing. This dynamic pushed the EU toward recession. In 2025 von der Leyen is trying to proactively mitigate that outcome.
This coordination of response between Brussels and Beijing is happening simultaneous to the Chinese central bank beginning a rapid devaluation of their currency. Direct subsidies and currency manipulation are the first two approaches taken by any economy dependent on access to the U.S. market.
The difference this time is the scale of the tariffs President Trump is delivering. There’s no way to subsidize and lower currency value at a rate significant enough to mitigate a near 50% tariff impact across all sectors. China and the EU will subsidize and devalue, but they cannot repeat their prior defensive programs to this scale.
The key takeaway from this public admission by the EU President is to note how consequential the tariffs are to their parasitic endeavors.
The EU is directly working with Beijing against American interests.
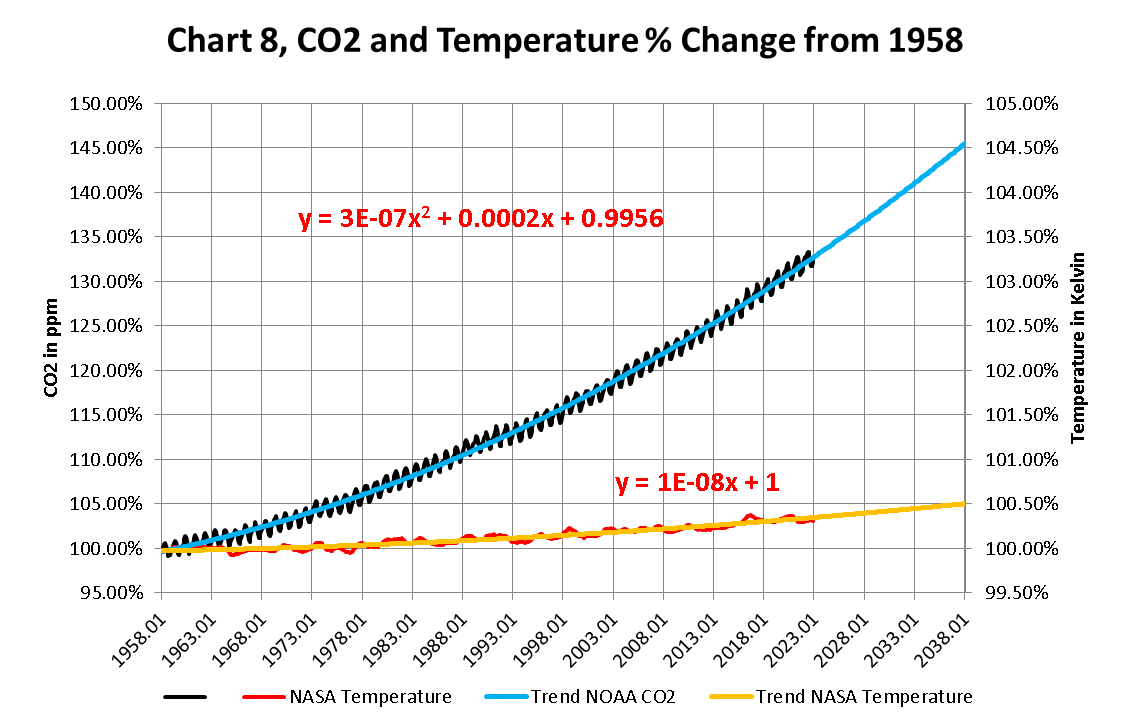
The attached report on Global Weather for February 2025 Data has charts showing the relationship between CO2 growth and Temperature increases going up since we started to accurately measure CO2 in the atmosphere in 1958. These Charts were created by showing CO2 as a percent increase from when it was first measured in 1958, the Black plot, the scale is on the left and it shows CO2 going up by about ~34.0% from 1958 to January 2024. That is a very large change as anyone would have to agree.
Now how about temperature, well when we look at the percentage change in temperature also from 1958, using Kelvin (which does measure the actual change in heat), we find that the changes in global temperature (heat) is about ~.3% and may reach .5% by 2028. To even be able to see this minuscule change we had to reduce the scale of the Temperature Axis by a factor of ten.
This Chart 8 uses unaltered values from NOAA and NASA properly displayed ,and the Blue and Yellow projections are created by Microsoft Excel not me.
The NOAA and NASA numbers tell us the story of the Very Small Changes in the temperature of the planets Atmosphere As Carbon Dioxide goes up geometrically.
Posted originally on Mar 25, 2025 by Martin Armstrong
Few know that Bill Gates heavily lobbied for the Inflation Reduction Act, which former President Joe Biden later admitted was intended to combat climate change and not inflation. Gates met with key lawmakers like Senator Joe Manchin ahead of the 2022 legislation. Another tool utilized by Gates was Breakthrough Energy, a venture fund he established in 2015 to promote net zero policies. The group recently laid off most of their employees in Washington, D.C., as Gates shifts methods for “climate” advocacy.
“We need to go from 51 billion tons of emissions per year to zero,” Breakthrough Energy stated on its website. “The only way to avoid the worst impacts of climate change is to reduce global greenhouse gas emissions from 51 billion tons a year, where they are now, to net-zero—and we need to do it by 2050. That means we need unprecedented technological transformations in almost every sector of modern life.”
Gates has every intention of continuing to push for net zero by 2050. However, Gates admitted that he needed to shift his policy amidst the new political landscape where he cannot directly influence policy. And what better way to do that than to throw money at the private sector. The focus is now on creating clean energy technology rather than manipulating public policy. Gates admitted he had to shift course because Donald Trump was revitalizing the energy sector and lifting restrictions on fossil fuels.
Breakthrough Energy and Gates are now focusing on Europe, where leaders are still on board with the Paris Accord. Instead of acknowledging that Europe’s economy is failing due to these initiatives, Breakthrough claims that key companies like Volkswagen, ThyssenKrupp Steel, Northvolt, and ACC Gigafactories are failing because Europe is not adopting clean energy fast enough.
“Europe is at a crossroads. In his analysis published in September 2024, Mario Draghi highlighted an “existential risk” and forecast Europe’s “slow agony” if it doesn’t radically change course to reverse declining productivity, investment, and innovation. Recent announcements only seem to confirm this dire prediction: industries are reducing production across Europe (Volkswagen, thyssenkrupp Steel); announced investments are being cancelled or put on hold (Northvolt, ACC Gigafactories), and industrial output in Europe’s four largest economies is declining, with Germany, France, Italy and Spain having recorded a year-on-year drop in the production of capital goods and consumer durables.

There is no denying it: Europe is in crisis, one in which its established industrial base is eroding while new sectors fail to get off the ground. This is particularly concerning for cleantech where Europe’s ambitions are high, but the economic realities are sobering. As the recent bankruptcy of Northvolt reminds us, even with solid industrial policy in place, it is hard to scale up in Europe. Turning this situation around will be one of the overriding priorities of the new European Commission, which has recently unveiled the Competitiveness Compass and will soon produce the Clean Industrial Deal, two new (long overdue) economic and industrial policy programs. In a volatile security and fractured geopolitical environment, with looming threats of trade wars and deepening systemic competition, European policymakers have their work cut out for them.”
The European Commission welcomes Gates’ proposal and believes it can perpetually spend to achieve net zero by 2050. I explained in another blog post how scientists have stated that this goal is IMPOSSIBLE. Moreover, the World Economic Forum has pushed the EU to create the Clean Industrial Deal (CID) through a €100 billion spending package. It is no conspiracy to point out that globalist organizations are pushing Europe into economic ruin.
Posted originally on Mar 24, 2025 by Martin Armstrong
COMMENT: Marty, Cheer up. They are coming for you!
Gene
REPLY: Well, I can’t outrun that many. Hopefully, one is interested in financial markets. Then maybe. When I went to a new doctor, she asked if I was vaccinated, and I said, “NO!” She replied, “Good!“ She worked last at the VA and quit over government policy.
Posted originally on Mar 17, 2025 by Martin Armstrong
QUESTION: NASA believes that this next solar maximum will be less than the last. Do you agree with that, or should I ask Socrates to agree with that? My second question is the coming asteroid. They say it will hit the earth in 2032. Is that part of Socrates’ forecast?
Fred
ANSWER: Well, as for the asteroid hitting the Earth in 2032, they are playing it down really hard, like it has less than 3%. However, they are already looking at ways to try to destroy it because the odds are much higher than they are telling you. All I can say is that the 8.6-year cycle functions on a fractal basis, and it is extremely accurate. The precession of the equinox is nearly 25,800 years in duration, and that is 3 x 8.6. The fact that this is arriving in 2032 may simply be destiny and part of the universe’s timing.
Now, as to the next solar cycle, we show it should arrive here in 2025, but our computer disagrees with NASA, and it should be stronger than the last. This is the trend into 2032 for solar energy to intensify, meaning more significant flares and possible disruption to power grids, etc. This will be part of the trend into 2032 that will also impact the commodity markets.
I have created this site to help people have fun in the kitchen. I write about enjoying life both in and out of my kitchen. Life is short! Make the most of it and enjoy!
This is a library of News Events not reported by the Main Stream Media documenting & connecting the dots on How the Obama Marxist Liberal agenda is destroying America


