MiningWatch Canada is estimating that 3 billion tons of mined metals and minerals will be needed to power the energy transition. All of this nonsense for climate change means that mining for minerals will escalate dramatically. There will be an incredible expansion in the mining industry for six critical minerals: lithium, graphite, copper, cobalt, nickel, and rare earth minerals. What is really just insane is that even if this green energy were to last, over the next 30 years, we will have to increase the production of these minerals consuming more that all the past generations combined. Our What-If models project copper at 9-10 by 2028 shutting down fossil fuels.
Posted originally on the CTH on February 12, 2023 | Sundance
Appearing on Face the Nation with Margaret Brennan, House Foreign Affairs Committee Chairman, Mike McCaul, discusses the ongoing Biden administration battle in the sky with balloons, objects and various Unidentified Flying Objects (UFO’s).
McCaul identifies China as the most likely culprit for sending the spy and surveillance equipment over North America, claiming the timing of the spycraft arrival against the backdrop of the military revealing the latest stealth bomber, the “B-21 Raider,” does not seem coincidental.
Additionally, because of course he does, Chairman McCaul notes that if we do not continue to send billions to Ukraine, then China and Russia will continue sending spy missions over the United States. The way we defeat the UFO’s is to send more money to Ukraine. That’s his logic, and he’s sticking to it. WATCH:
MARGARET BRENNAN: We go now to Congressman Michael McCaul. He is the Chairman of the House Foreign Affairs Committee. Good morning to you.
REPRESENTATIVE MICHAEL MCCAUL (R-Texas): Morning, Margaret. Thanks for having me.
MARGARET BRENNAN: I want to start on this unusual activity, three takedowns in eight days. In the case of the spy balloon, this was Chinese surveillance, according to the administration. On Friday, they put restrictions on six Chinese companies that allegedly helped China’s military build that balloon. Is this the right move, to just try to make it harder for them to get U.S. technology, or does Congress need to do something that’s more broad?
REPRESENTATIVE MICHAEL MCCAUL: Well, it’s certainly the right move.
It will be one of my number one priorities, as the chairman of the Foreign Affairs Committee in this Congress, to stop the export of technology to China that then goes into their most advanced weapons systems, in this case, a sophisticated spy balloon that went across three nuclear sites, I think it’s important to say, in plain view of the American people, you know, in Montana, the triad site, air, land, and sea nuclear weapons.
In Omaha, the spy balloon went over our Strategic Command, which is our most sensitive nuclear site. It was so sensitive that President Bush was taken there after 9/11. And then, finally, Missouri, the B-2 bomber, that’s where they are placed. It did a lot of damage.
MARGARET BRENNAN: Is that what U.S. intelligence told you? They have been saying they mitigated the impact.
REPRESENTATIVE MICHAEL MCCAUL: They say they mitigated it.
But my assessment, and — and I can’t get into the detail of the intelligence document — is that, if it was still transmitting going over these three very sensitive nuclear sites, I think — I think, if you look at the flight pattern of the balloon, it tells a story as to what the Chinese were up to as they controlled this aircraft throughout the United States.
Going over those sites, in my judgment, would cause great damage. Remember, a balloon could see a lot more on the ground than a satellite.
MARGARET BRENNAN: So, you said you want to try to stop the export of technology that can be used by China’s military.
As a conservative, though, how much — this has to make you a little uncomfortable to have government try to control private business investment. How do you do that?
REPRESENTATIVE MICHAEL MCCAUL: Well, we have what’s called an entities list. The Department of Commerce had jurisdiction over the office within their — the Department of Defense has one.
We need to harmonize those, make it more security-focused. You know, capital flows is one issue, but technology exports into China that they use to turn — that maybe eventually turn against us, we have to stop doing that.
And I think we can do it by sectors. They do it by companies now. Obviously, they identified the six. I think, shockingly, when the balloon was recovered, it had American-made component parts in there with English on that. It was made — you know, parts made in America that were put on a spy balloon from China. I don’t think the American people accept that.
MARGARET BRENNAN: Do you believe that this was a strategic choice by Xi Jinping’s government in Beijing, or do you believe that it was just the left and right hand not knowing what was going on?
REPRESENTATIVE MICHAEL MCCAUL: When I saw the sites that it was flying over, it was very clear to me this was an intentional act. It was done with provocation to gather intelligence data and collect intelligence on our three major nuclear sites in this country.
Why? Because they’re looking at what — what is our capability in the event of a possible future conflict in Taiwan? They’re really assessing what we have in this country. I find it extraordinary the timing of this flight as well, right before the State of the Union speech, and also right before Secretary Blinken was scheduled to meet with Chairman Xi.
I think it was very much an act of belligerence on their part. And perhaps they don’t care what — what the American people think about that.
MARGARET BRENNAN: Before I let you go, I want to ask you.
You voted in the last Congress to provide a lot of assistance to Ukraine. But, this past week, at least 10 of your members, Republican members, introduced a bill called the Ukraine Fatigue Resolution to try to cut off aid.
How hard is it going to be to have a Republican-led House continue to help Ukraine?
REPRESENTATIVE MICHAEL MCCAUL: I still believe, Margaret, there are many, on both sides of the aisle, a majority of the majorities in support of this.
We have — we have factions on the left and right that do not support Ukraine…
MARGARET BRENNAN: This WAS a Republican bill.
REPRESENTATIVE MICHAEL MCCAUL: … assistance, and that will probably continue.
Right. And I do think, for me, particularly, it’s — we have to educate, where has the money gone? You know, the audits that are in place right now, there are four of them on Ukraine funding. And we have to explain, why is Ukraine so important?
You know, what happens in Ukraine impacts Taiwan and Chairman Xi, that China’s aligned with Russia, Iran and North Korea against freedom, democracy in the West. And I think that’s a debate we’ll have, but I still feel very confident that we will give them the assistance they need.
MARGARET BRENNAN: Yes.
REPRESENTATIVE MICHAEL MCCAUL: I would like to see it faster, so they can win this faster.
MARGARET BRENNAN: So, you — you think Matt Gaetz, Marjorie Taylor Greene, others who signed this need to be educated?
REPRESENTATIVE MICHAEL MCCAUL: I — you know, look, we took Marjorie Taylor Greene into a briefing.
She was satisfied, I thought, with what — the controls that have been put in place on the spending. But I don’t think that they will be — ever be persuaded that this cause is something that they would support.
I think they have this false dichotomy that somehow we can’t help Ukraine beat back the Russians, who invaded their country and — and secure the border. We can do both. We’re a great nation. And the fact of the matter is, unfortunately, this administration has chosen not to secure the border. He can’t even control and secure our airspace now, it looks like.
MARGARET BRENNAN: Congressman McCaul, thank you for your time today.
REPRESENTATIVE MICHAEL MCCAUL: Thanks, Margaret. Thanks for having me.
Posted originally on the CTH on February 5, 2023 | Sundance
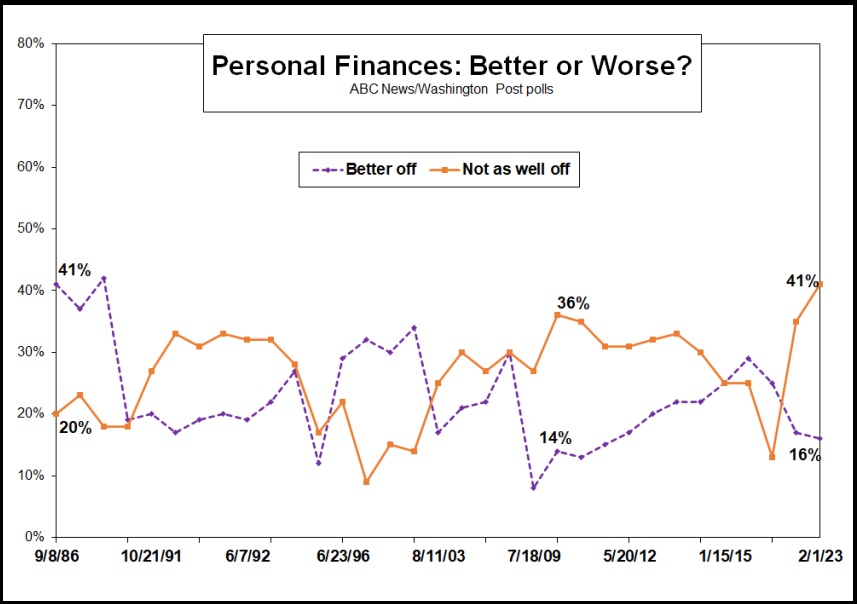
According to the latest ABC/WaPo polling [Full pdf Here], 41% of Americans say they are worse off financially under Joe Biden. That is the highest negative response to the question in the 37-year history of ABC polling.
Yet we are supposed to believe voters suffering under the worst financial outlooks in 40-years rewarded Joe Biden just two months ago with support for his Democrat Party and candidates? Something is just not adding up.
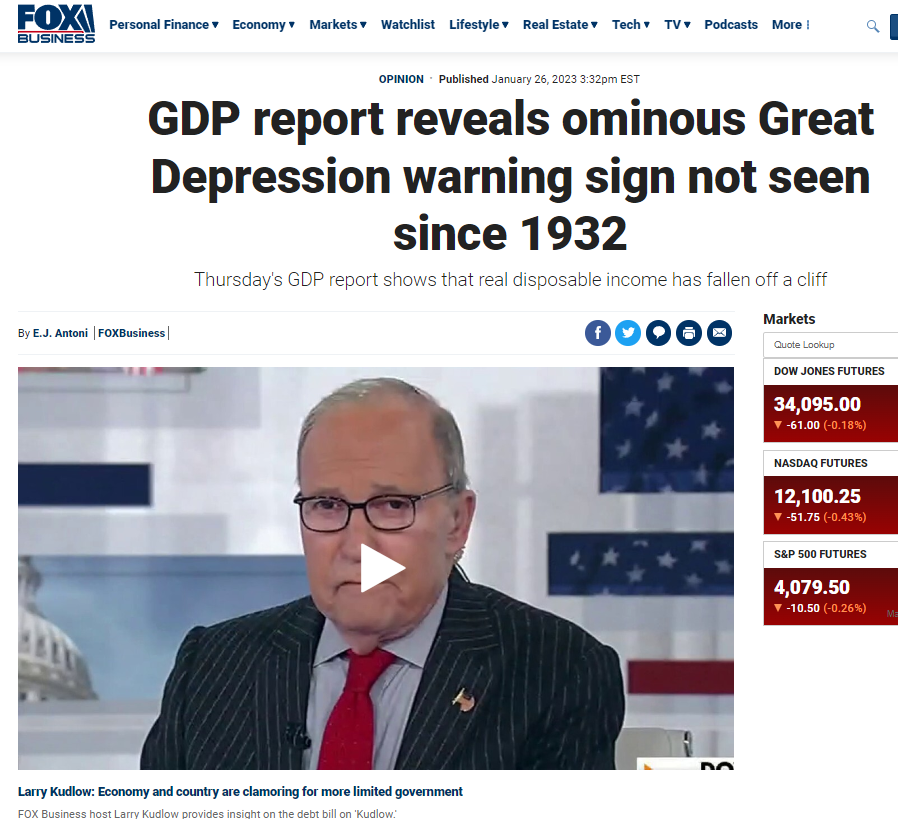
Fox Business is reporting that economic conditions are much worse than you are being told. Unfortunately, this is the conclusion when you have ZERO understanding of the historical trends and economic conditions. It is true that the shortages of COVID have caused prices to rise faster than economic growth and most incomes. Therefore, they conclude that our standard of living has been rapidly declining. The number reveals that more than one-third of all U.S. young adults are being supported in part by their parents. Thanks to COVID, this disrupted society far greater than anyone is reporting. In addition to the shortages because of the lockdowns, by the end of 2020, more than half of young adults in America were living with one or both parents. That statistic actually exceeded the record high of the Great Depression.
Here is the worst part of this analysis. Many are jumping on the bandwagon claiming that the decline in real disposable income has been the largest since 1932 and therefore, this is a warning sign of a Great Depression is coming. They seem to be focused on the fact that the GDP report showed a significant decline in real disposable income, which fell over $1 trillion in 2022. Now let’s look closer!
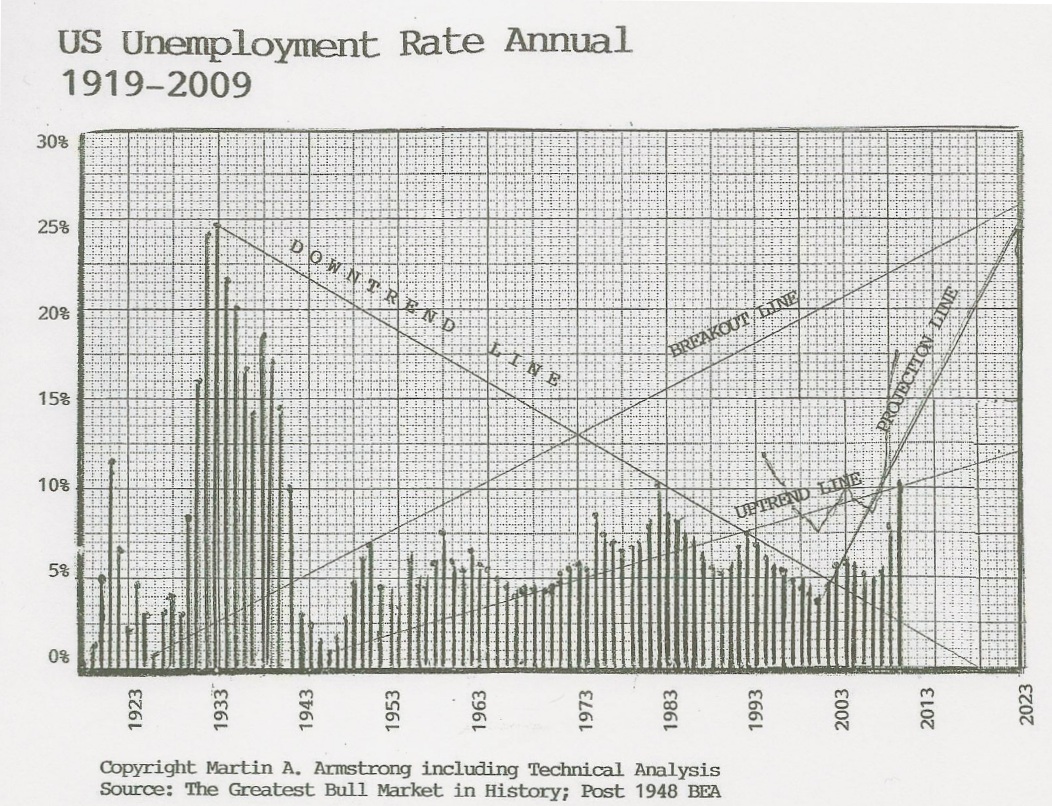
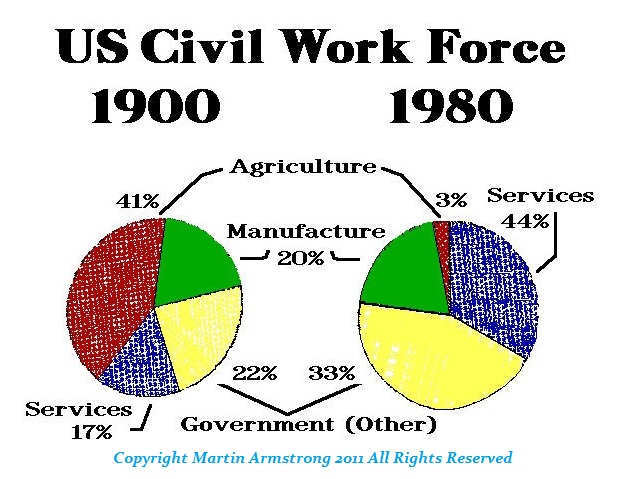
First of all, the entire reason why unemployment rise to 25% during the latter part of the Great Depression was the Dust Bowl. Why? At that time, about 40% of the civil workforce was still agrarian. The Dust Bowl meant job loss. If you could not even plant crops, there was no need for people to pick crops.
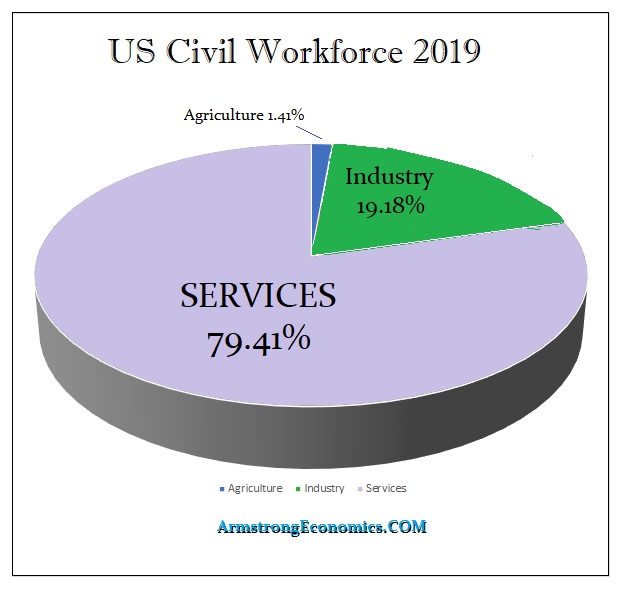
Service during the Great Depression accounted for 17% of the workforce compared to 44%+ today. Government, federal, state, and local, was 22% of the civil workforce during the Great Depression compared to 33% by 1980. Things have continued to evolve and by 2019, services represent 79.41%. Agriculture is now a tiny fraction of what it once was – 1.41%.
In the USA, at the state level, their share of the civil workforce varies greatly. Florida is at about 11.3% compared to New Mexico which is 22.5% – a government employee’s paradise. The lowest is Michigan at 10.1%.
During the Great Depression, the entire reason for the collapse in disposable income was the collapse in agriculture which created a collapse in income due to massive unemployment. That is totally different from the crisis we have today.
Here we have rising prices due to shortages and then central banks raising interest rates in a fool’s quest to stop inflation when it is not based on speculation. Moreover, the biggest borrower is the government, and rising interest rates will only increase their exposure to keep rolling over the debt. Therefore, governments have been borrowing year after year. What happens when the public no longer buys their debt? Real disposable income has been collapsing for completely different reasons since 1932. Here we have the costs of everything rising and then these people want war with Russia and China. Every war since the start of recorded history has resulted in inflation. Add to this, the total insanity of trying to end climate change by outlawing fossil fuels at a time when the climate is prone to getting colder.
We are already witnessing riots around the world BECAUSE of inflation. During the Great Depression, people were suffering from DEFLATION. So comparing just that statistic of a decline in personal income and projecting we now face a Great Depression, does not even qualify to be classified as analysis. That is no different from someone warning that carrots must be lethal because everyone who has ever eaten a carrot has obviously died.
For the life of me, there is absolutely no logic to any of this attack on Russia except the desire to conquer and destroy it as any sort of a superpower or independent nation-state. Every President always sought peace until Biden who seems to be reading the cur cards for Armageddon. Even Henry Kissinger said every president has invited him to the White House EXCEPT Biden.
Even if we assume that the sanctions worked and forced Putin to withdraw from protecting the Russians in the Donbas whom the West had all agreed were entitled to their human rights and self-determination with the fake Minsk Agreement, what would happen in the political crisis in Russia? We confiscated all Japanese assets, put energy embargoes on them, and threaten to prevent them from dealing with any other country for energy. Roosevelt did everything he could to get Japan to attack Pearl Harbor. Biden has done the same to Russia.
The risk of overthrowing Putin would lead to a potential civil war and the further breakup of Russia with more nukes than the West. Of the 14,500 nuclear weapons on the planet, Russia and the United States own the lion’s share, with a combined total of approximately 13,350 nukes. The remaining 1,150 weapons are held by seven countries. The USA has 6,500 nukes and Russia has 6,800. Destabilizing Russia is just insane. Russia will wipe out Europe in the blink of an eye if pushed and they now know that this Ukraine bullshit is really a war of the USA and NATO against Russia and we are the aggressors.
I can say that US troops have been told that we will be at war with China by next year.
All my sources are saying that the Biden Administration is DOMINATED by inexperienced climate zealots who are demanding we have no time to wait and we MUST end fossil fuels NOW before there are any alternatives in place. They are the ones pushing to destroy Russia which is embraced by the Neocons, all because the majority of their GDP is all fossil fuels.
The sanctions now are imposed by the European Union and will ban imports of refined Russian fuels on February 5th, 2023, adding to its embargo on seaborne Russian crude oil that began in December. The EU is putting its entire future and the lives of ALL its population at risk for the Donbas which has been occupied by Russians for centuries and two former Russian leaders came from that region. It was Khrushchev who drew the border within the USSR purely for administrative purposes. That region was never occupied by Ukrainians.
There is no difference if Mexico had demanded Texas and everyone who lives there must surrender their language and their religion to fit the norm of being Mexican. Then Texans have no right to vote on their future. The entire Minsk Agreement has been a joke. It was a deliberate ploy to buy time for war. This has now confirmed to both China and Russia that the United States and Europe cannot be trusted. Treaties mean absolutely nothing! this stupid ploy has opened the door for World War III because there is no point negotiating with the EU, Germany, France, or the United States when they will not HONOR their agreements. That means there can be no resolution!
That leaves only All Out War to the Death
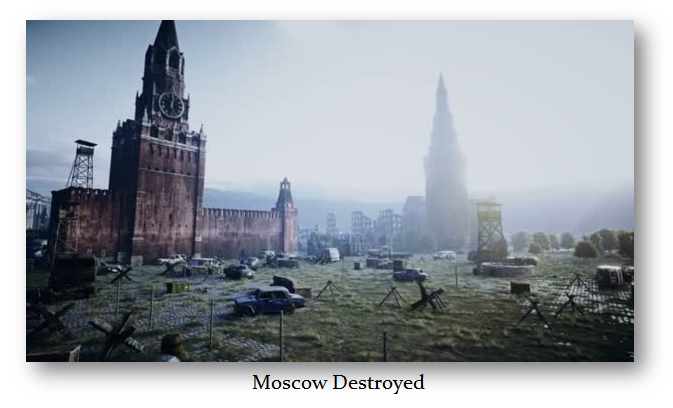
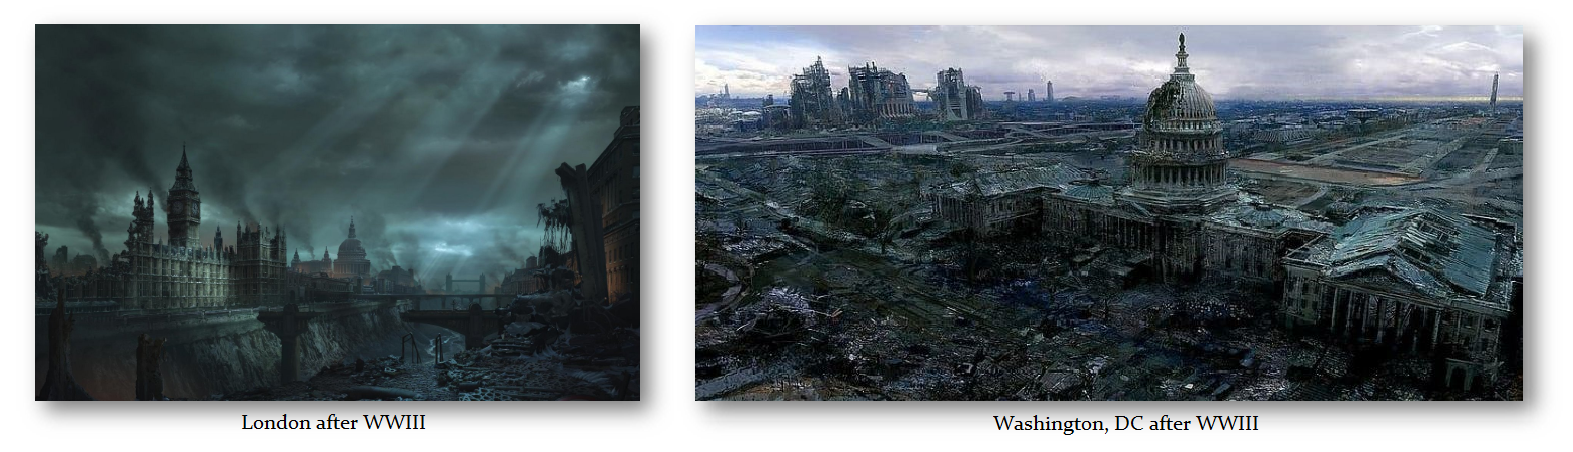
But hey! There will be new business opportunities as well. Just think of the guided tours to show how foolish these mortals have been. There will be plenty of nuked cities to explore. The good news, we will exterminate all the climate change zealots who insisted on destroying Russia. Yet it may be up to us to prevent the politicians from crawling out of their safe underground bunkers to the new light of CO2 free world after they killed off all those nasty trees and plants that need CO2 to survive. They say the one bug that will survive a nuclear attack is cockroaches. I guess that’s why we are supposed to eat bugs now.
The German Federal Foreign Minister has actually come out and bluntly said: “We are at war with Russia.” I have been warning from the outset that the West has been the aggressor and deliberately did what it could to compel Putin to invade the very same way that Roosevelt did to Japan (1) by imposing an energy embargo (2) seizing all their assets in the USA, and (3) threatening to blockade any attempt to get energy from any other place. There were senate investigations into this very question that Roosevelt deliberately compelled Japan to attack Pearl Harbor just so he could then enter World War II whereas the people and Congress refused to fight Europe’s war. That view of distrust of FDR was so great, it compelled the US Senate to hold hearings into what did FDR know in advance of the Pearl Harbor attack.
Here we have the same pattern.
(1) In 2014 US installs an interim government in Ukraine which is unelected and immediately sense troops to attack the Donbas for wanting to separate from Ukraine after its own revolution
(2) West engages in the Minsk Agreement whereby Merkel has come out and acknowledged it was in bad faith and intended only to allow Ukraine to build its army while making a fool out of Putin for trusting the West
(3) Zelensky is elected promising to end corruption and the civil war with Russia
(4) VP Kamila Harris at Munich Security Conference tells Ukraine they should join NATO
(5) On February 23rd, 2022, Zelensky announces that Ukraine should rearm itself with nuclear weapons
February 24th, 2022, Putin intervenes to support the Donbas. If the United States even exists after World War III which they are promoting, then we would no doubt have a similar investigation into the deliberate policies that have rejected any possible peaceful negotiations and promoted war for the total destruction of Russia.
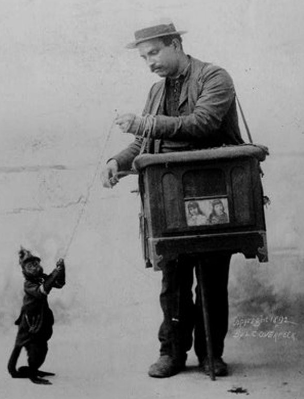
Putin has responded by saying that Germany is still occupied by the United States and it does as it is told. Indeed, all of Europe is totally out of its mind. You cannot push Russia into a corner and resurrect the old Iron Curtain this time from our side. That will NEVER bring peace and stability. Europe is indeed the monkey dancing to the tune of the organ grinder.
Running our war models, 2023 was the start and January was the target. I wish these forecasts were wrong. If Europe is going to even survive beyond 2027, it has better wake the hell up. The EU itself may not exist beyond 2024.
World Peace is attainable if we just look at Rome. After conquering various states, what kept them together? It was economics. Once everyone shared a common market, then the people benefited by manufacturing products and selling them to everyone else in the empire. We have taken the opposite approach adopting the theories of Karl Marx worrying about local jobs. It does not pay for the people to impose trade barriers so someone can grow a head of lettuce in the desert and sell it for $25. If another nation can produce a product at half the cost, that is not saving a local job, it is exploiting everyone else in the economy to pay higher prices for something that could be obtained far less. It REDUCES the standard of living for the whole – it does not advance society.
When people in Russia and China are linked economically with the consumers in America, then the governments are LESS LIKELY to push for war when that will undermine their people and their economic power. Blowing everyone else seems to be fund for politicians
Rome has shown us the way to peace. We ignore the lessons from history at our own peril.
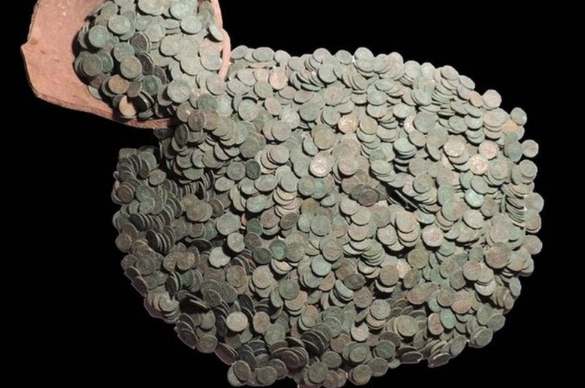
QUESTION: Why do you buy hoards? It is interesting. Just curious.
JY
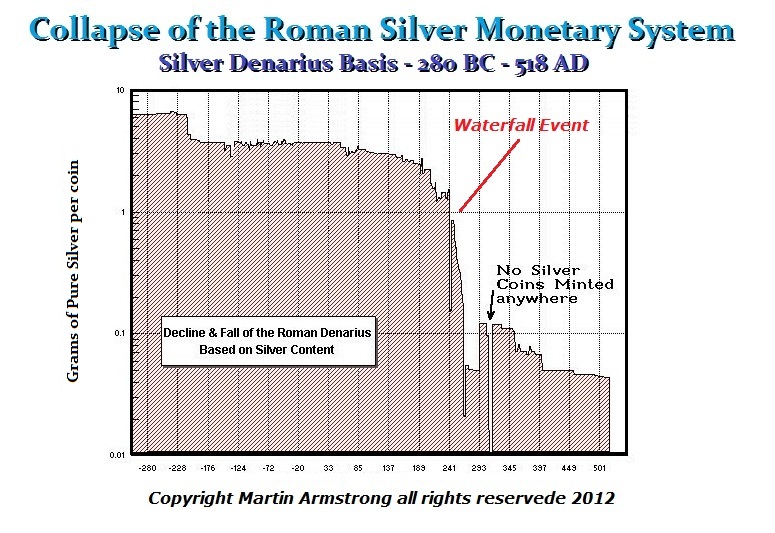
ANSWER: The coinage is the ONLY way to truly confirm the history. Much of the most important periods like the 3rd century AD, the fall of the Republic, or the Revolution during the Debt Crisis of the 1st century BC known as the Social War, can only be properly understood through the coinage lacking really detailed accounts of financially what was taking place. By recreating the monetary system using coinage, I was able to answer the question – How did Rome Fall? Gradually? Or Catastrophically? By assembling all the coinage, and testing it out, I could establish what nobody else could due using documents or archaeological digs. Rome collapsed in just 8.6 years.
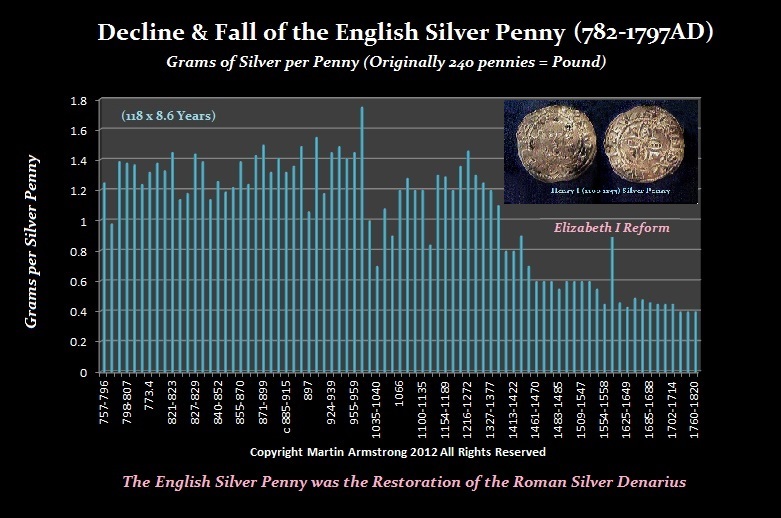
That was then observed in testing and using the same methods around the world. The collapse of the English coinage that inspired Gresham’s Law, bad money drives out good, also took just 8 years.
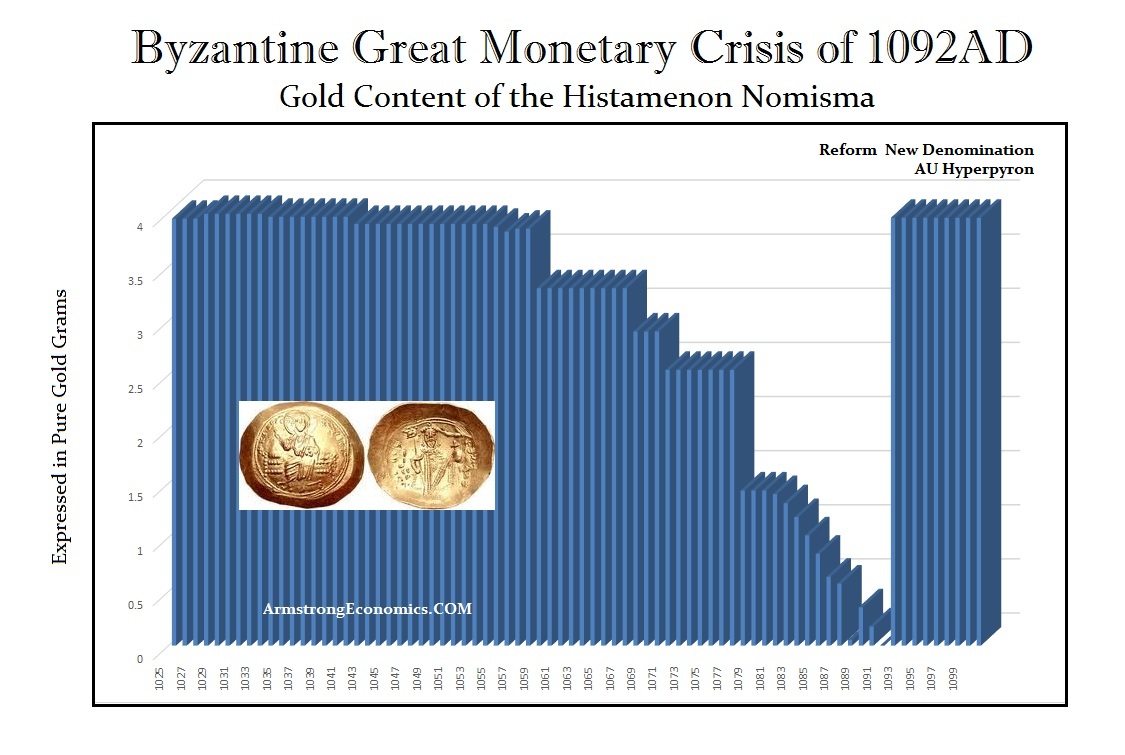
The Great Monetary Crisis of 1092 saw the gold content collapse also in just 8 years. The same pattern has unfolded time and time again. History repeats NOT because of wars or abstract theories. It repeats simply because human nature never changes – on technology.
The computer was about to forecast the fall of Communism in 1989.95 and it spread and took down the Berlin wall a few months after Tiananmen Square. People attributed that to modern communication. That was nonsense, The Roman Republic fell in 509 BC, and in the same few months in Athens, they too overthrew their tyrants, and Democracy was born.
The question is NOT how fast the information spreads. It could have traveled from Rome to Athens in a few days. The real question is how long does it take to filter through society to create political change?
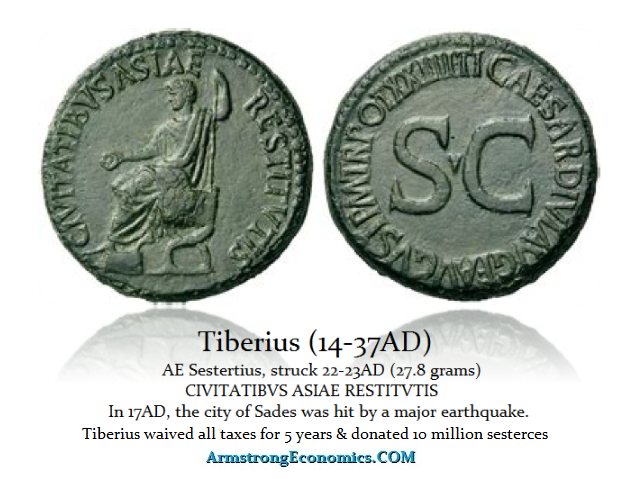
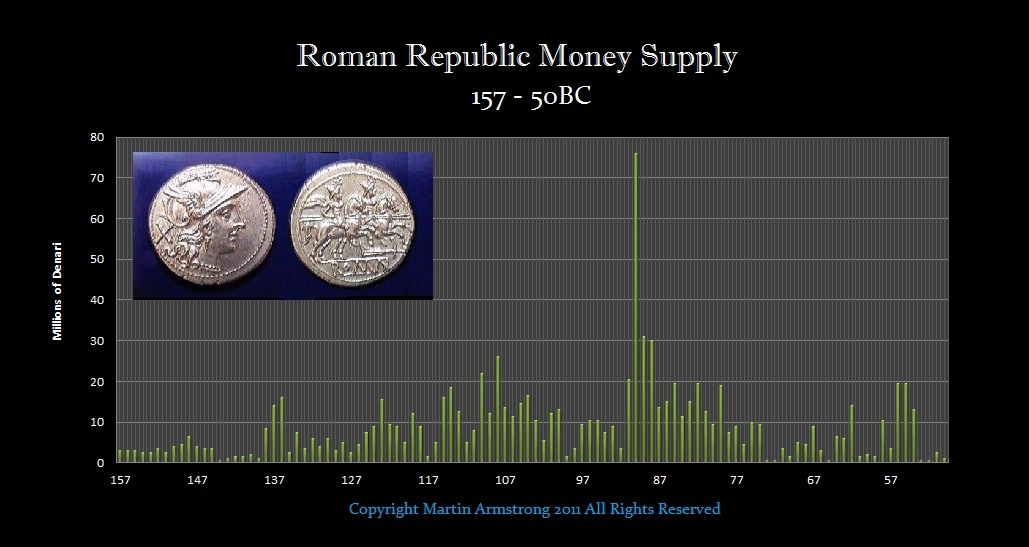
Therefore, assembling the number of coins by examining hoards and the number of different dies multiplied by 15,000 will give us a good idea of the money supply at that time as illustrated above. Granted, this research project cost tens of millions of dollars to produce. Nonetheless, it has yielded a wealth of information that enabled us to see specifically what took place economically. Human nature has not changed. When Rome burned, Nero did visit the victims. Tiberius issued coins for the aid of Asia when a major earthquake devasted the region we call Turkey today.
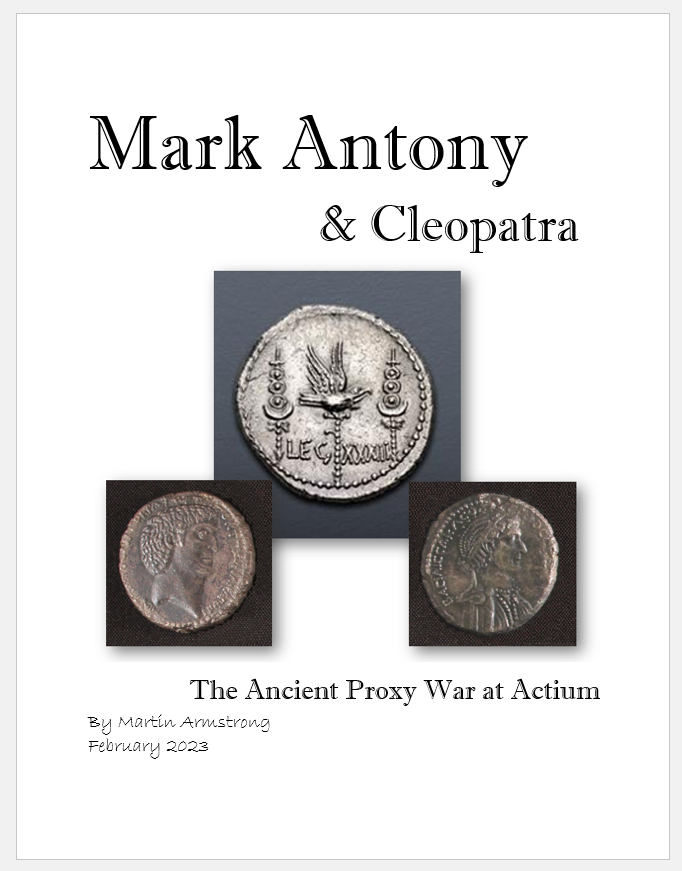
I am finishing a book on the famous Battle of Actium where Mark Antony lost to Octavian giving birth to Imperial Rome. The number of dies and the amount of coins issued by Antony demonstrates that the entire wealth of Egypt was at his disposal and it was really an Egyptian proxy war against Rome. The number of silver denarii struck had to be at least 25 million. The sheer massive amount of the increase in the money supply thanks to Egypt was huge. Antony’s coins remained in circulation for decades, although very work. They were the most common coin found in hoards at Pompeii in 79AD about 100 years later. Hoards enable us to see the cost of that war and how it changed Egypt and Rome.
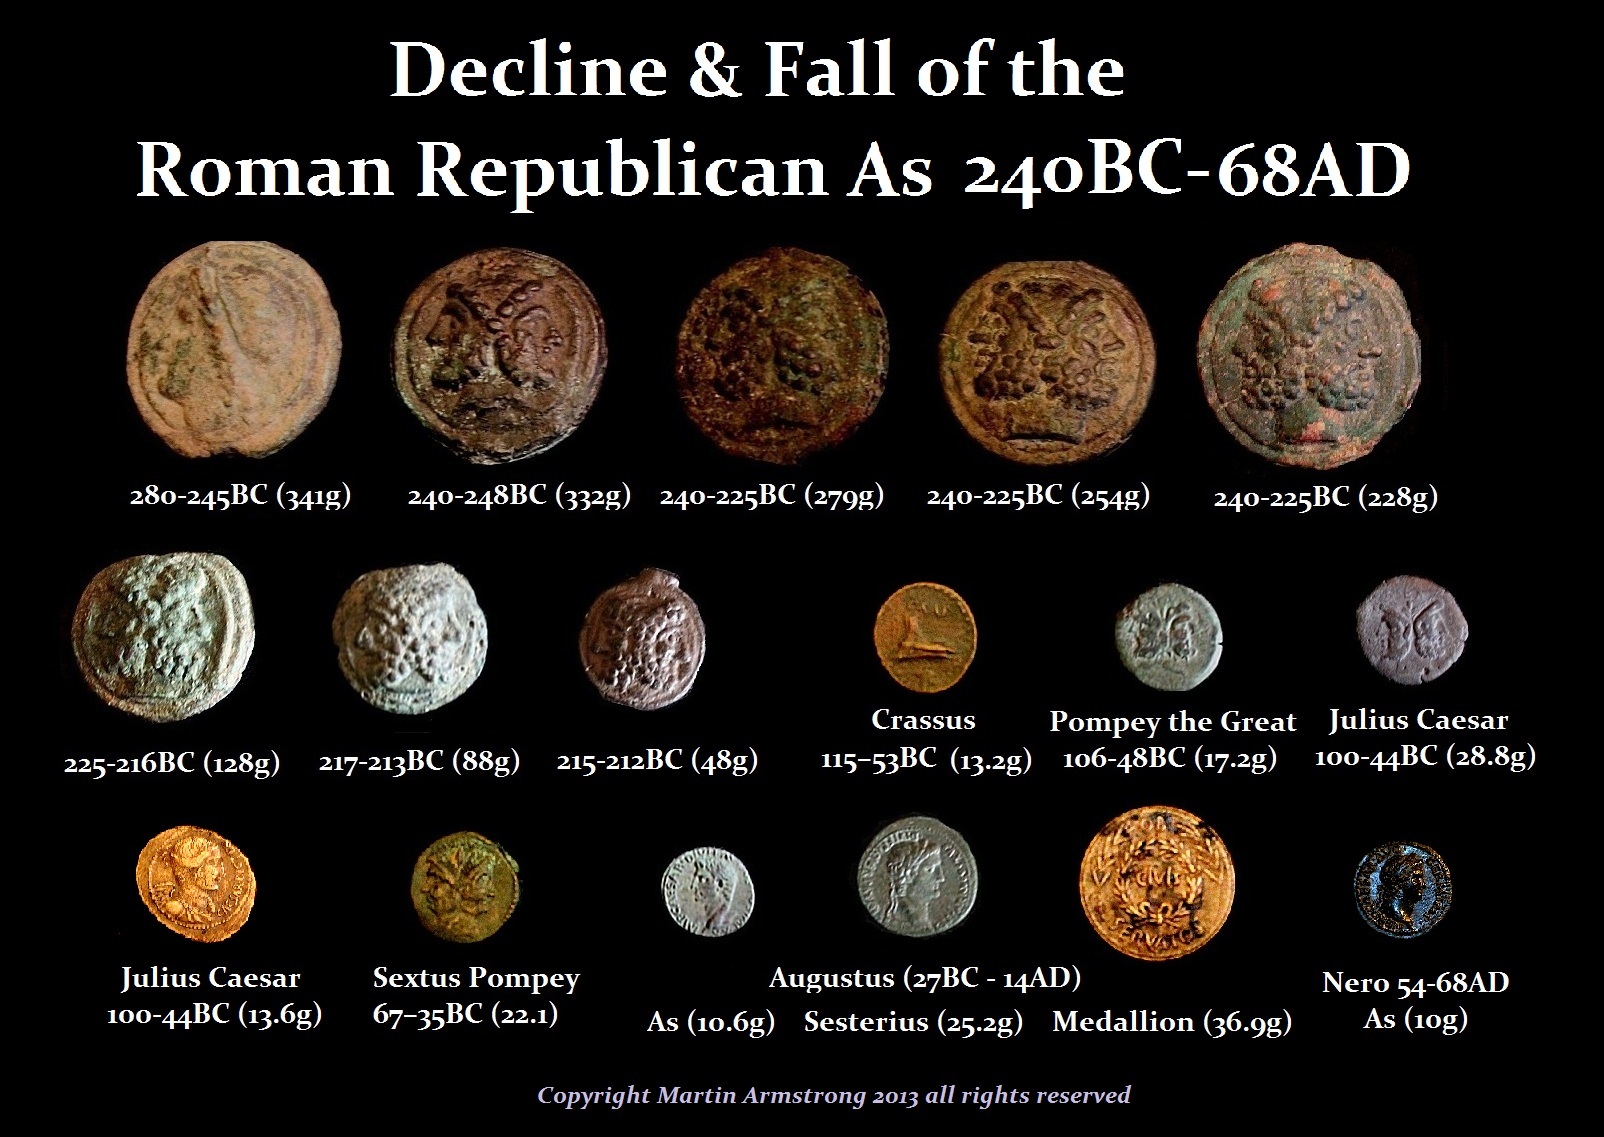
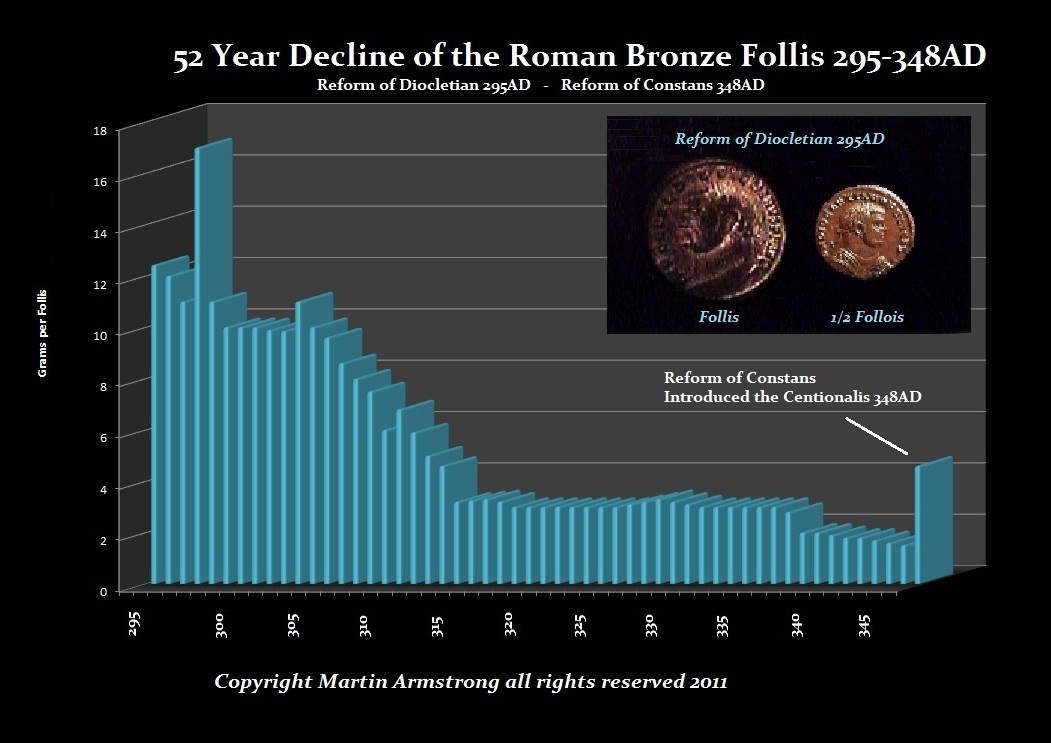
Where Rome began with bronze as its monetary unit and one pound was known as a Roman As, we can see that the price of the Punic Wars as what was one pound of bronze consistently declined. Here we found it was six waves of 51.6 years which are in themselves six waves of 8.6 years, that produced the major wave of 309.6 years. So if we look from the beginning of the Roman As being 341 grams in 280 BC, by the time we get to Nero in 54AD, the Roman As was about only 10 grams.
Even looking at the reforms of Diocletian in 295AD, his introduction of the follis declines remarkably also following the six waves of 8.6 years. I have looked at the monetary systems of Asia, the Middle East, Europe, and the Americas. they have conformed to the Economic Confidence Model confirming that this is a cycle that clearly incorporates everything from war to climate change.
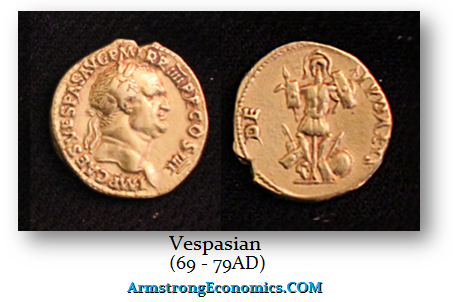
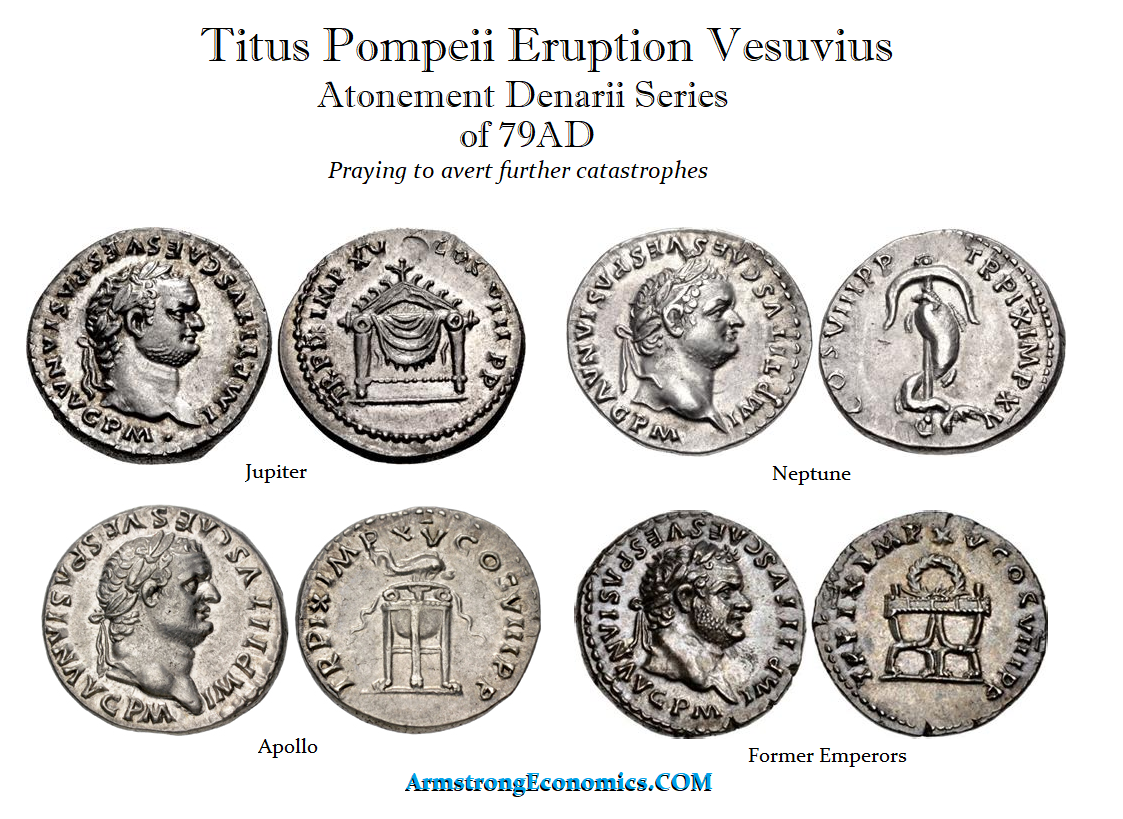
Even though Emperor Titus’ (79-81AD) reign was marked by a relative absence of military and political conflicts after his father, Vespasian (69-79AD) had defeated Judaea was defeated, there were several disasters during his brief leadership. On October 24 in 79 AD, Mount Vesuvius erupted and almost destroyed the cities and resort communities around Naples. The cities of Pompeii and Herculaneum were buried under stones and lava in 79AD shortly after Titus (79-81AD) came to power. Titus made all efforts to help the victims of the volcano and donated large amounts of money from the imperial treasury. The emperor visited Pompeii right after the tragedy happened.
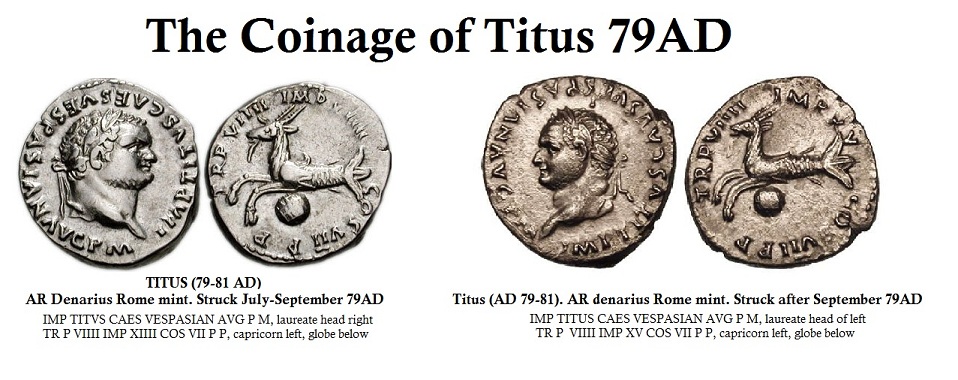
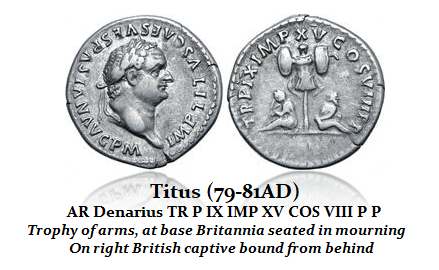
A single silver denarius was discovered in 1974 among the 180 silver coins buried in Pompeii. When it was cataloged, it overturned history. Titus’ father died on June 24th, 79 AD. Therefore, any coin of Titus as emperor would have to have the very first recording of his power “IMP VIIII” or 8th Imperator, which was a title that meant ‘leader of the army’ to the Romans. The coin discovered in Pompeii had the legend “IMP XV,” which was granted to Titus for the war in Britannia. Titus sent Gnaeus Julius Agricola who pushed further into Caledonia and managed to establish several forts there as recorded by Tacitus (Agricola 22). Therefore, Titus received the title of Imperator for the fifteenth time for this event, according to Cassius Dio (Roman History LXVI.20). This took place we know in September 79 AD about 3 months after becoming emperor following his father’s death. Obviously, if any coin was discovered in the ruins of Pompeii with “IMP XV” in its legend, then this provides absolute proof that the date for Vesuvius of August 24th, 79 AD cannot be correct.
Archeologists in Pompeii have discovered a remarkable inscription written in charcoal which has survived the catastrophe confirming that the eruption of Mt Vesuvius indeed took place in October 79AD as confirmed by the coin discovered and ignored by historians. The charcoal writing, discovered on the wall of a villa during a new phase of excavations, adds weight to a theory that the volcano destroyed the town in October 79AD rather than August of that year in line with Cassio Dio and the denarius of Titus. The date of August 24th, 79 AD, came from a letter addressed by Pliny the Younger to the Roman historian Tacitus, originally written some 25 years after the event.
Titus devoted much of his silver coinage of Atonement to the gods for the disaster of Pompeii. There were four main Atonement issues commemorating the services of prayer and propitiation through which the emperor attempted to address the public alarm over the disaster. People often attributed such events to the gods being angry. The coinage showed emblems seeking the approval of Jupiter, Neptune, Apollo, and the deceased former Emperors to watch over the Roman people.
News actually spread rapidly around the Roman Empire. There were formal boards where notices would be posted in which important news and major events would be informed to the people much like such a board in a big company with notices to the employees. These boards were called the Acta Diurna and they were designed to inform the Roman people thereby avoiding fake news. We could call them ancient billboards in modern terms and even government officials would walk up and pin a written notice and the crowds would rush to see what is news. Thus, everyone knew of Pompeii in a matter of days. It did not take long for information to circulate.
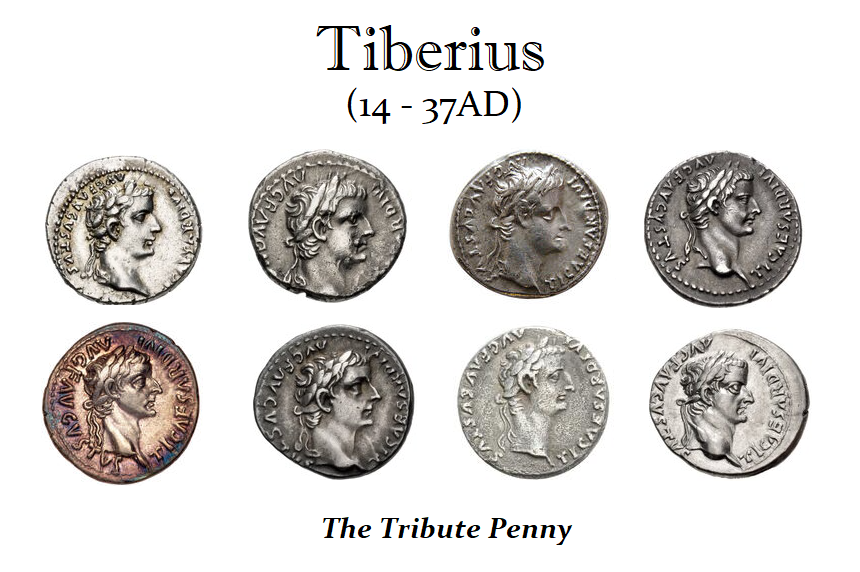
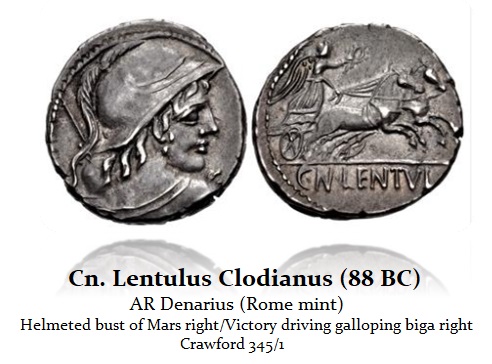
Because the coin dies back then were hand carved, we are able to identify the number of dies in use during a given year because each is unique. Just look at these portraits on the famous Tribute Penny of Tiberius (14-37AD). It all depended upon the artistic ability of the engraver.
The coin itself has taken its name because Jesus, referring to a denarius, which the English translated to “penny” because that was their silver coin, asked: “Whose is this image and superscription?” When answered that the likeness was Caesar, He replied; ”Render therefore unto Caesar the things which are Caesar’s and unto God the things that are God’s” (Matthew 22:20-21). Thus, the coin has been called the tribute penny meaning that was how you paid your taxes.
Hoards have enabled me to (1) see what was in circulation at that point in time for the hoard can be dated to around the most recent coin in the hoard. (2) I also have a number of ancient Roman dies like this one of Tiberius. Studies creating modern dies to test how many coins could be struck from such a die before it cracked provides a picture of about 15,000 coins.
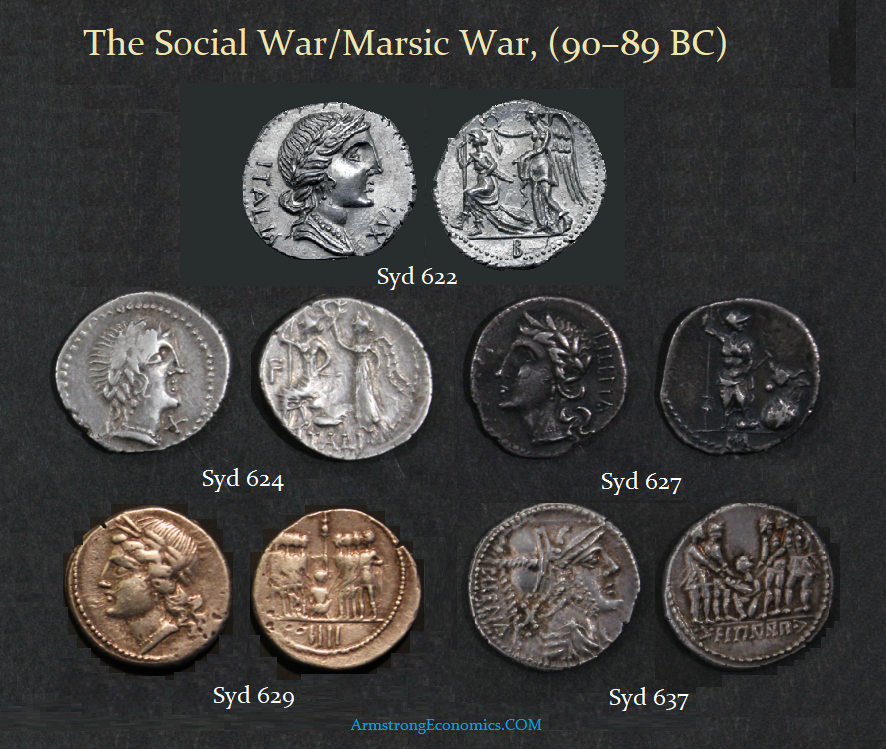
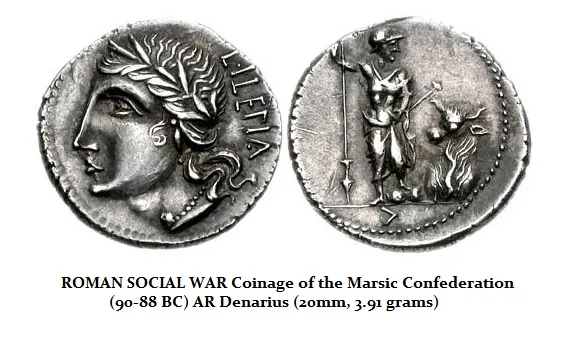
By completing die studies quantifying how many were in use, it then becomes possible to estimate the money supply. Here we can see that during the Social War of 90-87BC, there is a drastic increase in the quantity of coinage issued obviously to pay for soldiers. However, conducting metal testing on the coinage of this period, we find that Rome also debased the coinage slightly adding up to 10% copper to the silver. Therefore, studying hoards allows one to actually ascertain the extreme of monetary affairs.
The Social War of the First Century BC was a failed Revolution against the corrupt Republic. The rebellion was waged by ancient Rome’s Italian allies (socii) who were denied equal rights with the Romans, despite the fact that they also fought alongside Romans in battle. They were seeking to separate and thus they fought for independence. Here are the coins of the rebels. They are very rare. You can see the theme celebrating the female head of Italia.
The allies in central and southern Italy had fought side by side with Rome in several wars and had grown restive under Roman autocratic rule, wanting instead Roman citizenship and the privileges it conferred. In 91 BC, the Roman tribune Marcus Livius Drusus proposed granting them Roman citizenship. The arrogance of the Senators erupted into a heated opposition. They went as far as to even Drusus for daring to propose such a decree. That resulted in the revolution.
When I dug deeper, the coinage with the debasement also reveals that there was a financial crisis. In all honesty, it was the Debt Crisis that ended the Roman Republic. There was a Sovereign Debt Crisis during the Roman Republic period that resulted in a dictatorship and a debt default. The Roman Debt Crisis of the 1st century BC has left behind a vivid account of what took place. The volume of gold and silver in Italy had increased dramatically during the late 2nd century BC following the Punic Wars. We have the first real gold coins issued by the Roman Republic at that time.
However, this concentration of wealth, which was akin to the United States after World War I and II, was absorbed by commercial expansion and investment in Gaul and Asia. A period of excessive concentration of money and large profits came to an end with the rise of the Social War of 91-88BC which was a war waged between the Roman Republic and several of the other cities in Italy (no taxation without representation), which prior to the war had been Roman allies for centuries. The war was begun by the Picentes because the Romans did not want to afford them Roman citizenship, thus leaving the Italian groups with fewer rights. The war resulted in a Roman victory and genocide against the Samnites. However, Rome granted Roman citizenship to almost all of its Italian allies, including the Samnites, to avoid another war. Therefore, we find that the debt crisis was correlated with a separatist movement – which we are beginning to see worldwide starting in Europe, but will eventually become a contagion in the United States as the conflict between left and right erupts after the November elections.
The Social War led to the complete state bankruptcy of the Roman State. We can see the dramatic rise in the money supply created during this time of war. This turmoil was then followed by the dictatorship of Sulla who then imposed an attempt to control the debt crisis capping interest rates at 12%. The previous legal rate was capped at 8.5%, but obviously, the market had exceeded that limit and Sulla had to confront that reality in 88BC. The debt crisis continued and then in 86 BC, the government was compelled into default. This is when the Valerian Law came into play. The State debts were defaulted on and thus reduced to 25%.
Posted originally on the CTH on January 17, 2023 | sundance
There has always been a general shaping and interpretation surrounding economic news, specifically as it relates to the impact of pricing on consumers and corporations. However, against the backdrop of supply side inflation, the financial gaslighting from the Wall Street Journal stands out at the top.
Without pretending, and looking directly at the Main Street reality, CTH has outlined inflation as a matter of monetary and energy policy. From that standpoint the timing and scale of price increases (inflation measured over time) was predictable. Our current status is an inflationary plateau, where prices remain high but stabilize for likely two quarters.
What the Wall Street Journal outlines as a “shopper rebellion against high prices” is complete hogwash. Notice in the construct of the narrative, the demand side (consumers) is identified as the cause of diminished revenue & profits for corporations. They continue pretending that inflation was not driven by energy costs.
(WSJ) – […] Many companies raised their prices substantially last year to offset higher fuel costs and higher prices for ingredients, parts and labor. As fuel prices have dropped and pandemic supply-chain snarls have eased, some of those costs have come down.
That is a good sign for the economy. It suggests that some inflation in the past year resulted from extreme supply-demand imbalances brought on by the pandemic and the war in Ukraine and which are now fading.
Notice the transparent lack of mentioning ‘energy policy’ as the inflation driver.
[…] The study, by economists at the Federal Reserve Bank of Kansas City, found that higher markups—the gap between what a firm charges and what it costs to produce an item—were a major driver of inflation in 2021.
They concluded that companies in some cases were raising prices in 2021 in anticipation of future cost pressures, rather than because of market power or outsize demand. Andrew Glover, a senior economist at the Federal Reserve Bank of Kansas City who was involved in the study, doesn’t expect prices to fall this year, he said, but he anticipates that the pace of increase will continue to slow.
Inflation is the rate of increase over time. We have experienced two years of massive price increases. Yes, the rate of those increases will moderate, this is the plateau, but the price will never drop. The current prices are a direct result of fixed energy policy.
[…] Unit sales of food and beverages fell 3% last year, but on a dollar basis they rose 10%. That showed consumers were willing to pay higher prices for groceries but bought fewer items.
[…] “People need to eat,” said Krishnakumar Davey, a president at IRI. Shoppers are nonetheless buying less when possible and, in many cases, buying less expensive versions of necessities such as toilet paper and laundry detergent. (read more)
Meanwhile the Fed is worried that wages will be forced to increase. Here is the real worry for the Wall Street Journal, “If consumers believe high prices will persist, they could seek bigger raises, and businesses, seeing higher labor costs, could continue raising prices.” Yes, workers, forward inflation is your fault.
Government policy drives up prices, but workers needing wage increases to pay for those higher prices… well, that is not acceptable to the government, comrade proles.
In electricity generation, capacity factor, utilization, and load factor are not the same.
A lot of confusion exists in the press and certainly in politics, and even amongst “energy experts”, about using the term “capacity factor”. It may be excused, since the distinction made in this article became only relevant with the penetration of variable “renewable” energy, such as wind and solar, in our energy systems.
Worldwide average solar natural capacity factor (CF) reaches about ~11-13%. Best locations in California, Australia, South Africa, Sahara may have above 25%, but are rare. (see www.globalsolaratlas.info, setting direct normal solar irradiance)
Worldwide average wind natural capacity factors (CF) reach about ~21-24%. Best off-shore locations in Northern Europe may reach above 40%. Most of Asia and Africa have hardly any usable wind and the average CF would be below 15%, except for small areas on parts of the coasts of South Africa and Vietnam. (see www.globalwindatlas.info, setting mean power density)
Natural capacity factors in Europe tend to be higher for wind than for solar. Wind installations in Northern Europe may reach an average of over 30% (higher for more expensive offshore, lower onshore), but less than 15% in India and less than 8% in Indonesia.
Average, and the emphasis is on average, annual solar PV capacity factors reach around ~10-11% in Germany, ~17% in Spain, ~25% in California, and may reach 14-19% in India, but they reach less than 15% in Indonesia’s populated areas. Carbajales-Dale et al. 2014 confirm higher capacity factors for wind than for solar; they estimate global average wind capacity factors to be around 21-24% and solar around 11-13% (see figure above).
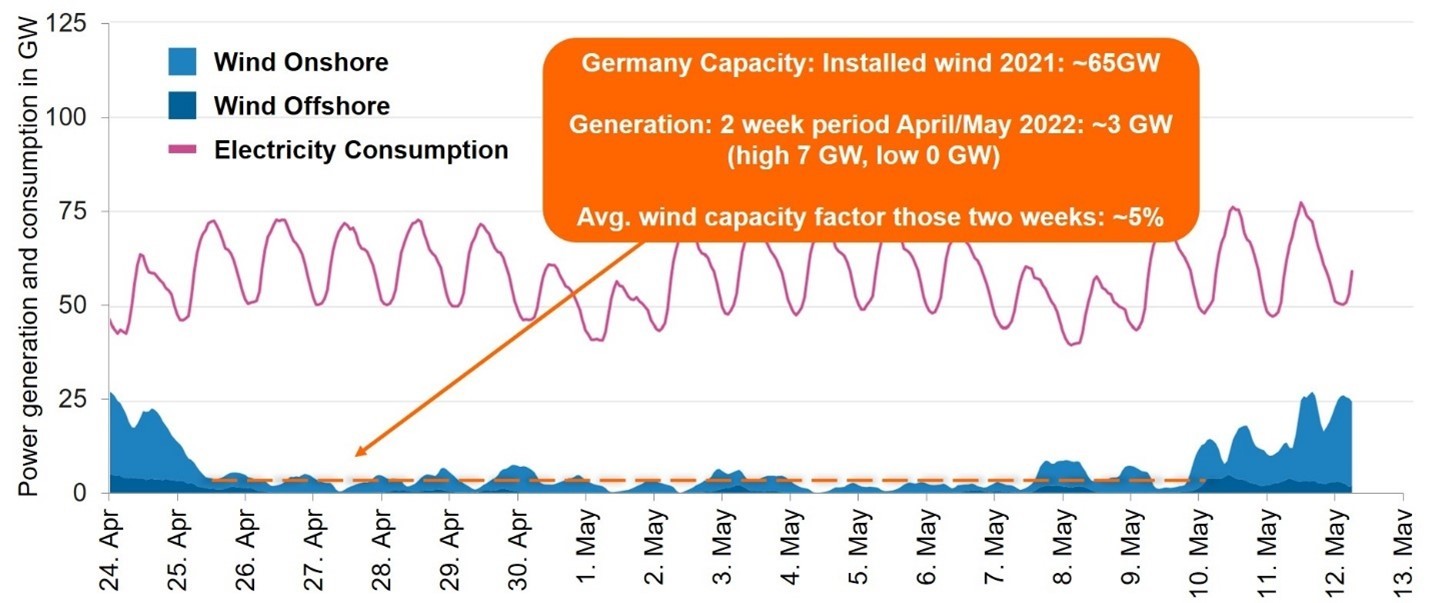
The figure further below illustrates a two week period in May 2022 (when I wrote this chapter of our book on capacity factors), where the average wind capacity factor reached only ~5% for ALL German wind installations (on- and offshore).
To avoid confusion, I try to use “natural capacity factor” in my writing wherever possible
The “natural capacity factor (CF)” is the % of the maximum possible output of the “power plant” (coal, gas, nuclear, solar, wind, hydro, etc), achieved under the natural conditions of the site, assuming no operational or technological failures or outages.
I define “utilization” is the % of the power plant’s workable capacity used on average over the year, which is only reduced because of technological, operational, economical outages or curtailments… completely independent of the CF
The “net load factor” – in my definition – is then the product of natural capacity factor x utilization
Thus, when we speak of the natural capacity factor, we are only referring to the nature-derived capacity factor, not the technological oroperationally driven “utilization” (often referred to as uptime, plant load factor, or PLF). In other words, when technology fails, or a power plant is turned off on purpose, this will reduce the utilization but not the natural capacity factor.
As mentioned, the natural capacity factor is due to the site, not the solar PV installation. Thus, even a perfect PV material still needs to deal with natural capacity factors with an annual average of 10-25%, not counting for other losses from conditioning, transmission, balancing, or storing highly intermittent sources of electricity (Schernikau and Smith 2021).
The press has mentioned several times that coal or gas have capacity factors of 60% or less on average. This is at best misleading, more likely knowingly wrong for political reasons. However, such a number is not the nature-derived capacity factor; it is the utilization which declines with higher penetration of wind and solar, and contributes to electricity system cost increases.
Utilization never should and cannot be compared to natural capacity factors, they are very distinct. Conventional power plants have near 100% natural capacity factors, but their operational and technological utilization often falls significantly below 90%, also but not only because of the priority given to wind and solar in the system. Because of their high CF, the net-load factor is only slightly lower than utilization for a convention power plant.
Because utilization of wind and solar is often near 100%, their net-load factor is often only slightly lower than their natural capacity factor.
Figure: Germany’s wind generation 25 April to 10 May 2022 during a 2-week wind lull Source: Agora 2022, Figure 10 in Book “The Unpopular Truth… about Electricity and the Future of Energy”, http://www.unpopular-truth.com
Needless to say, the natural capacity factor of wind and solar (even for hydro, because of natural river flows) cannot be predicted or guaranteed for any given time frame. The natural capacity factor can be estimated on an annual basis but still varies widely even annually (see Europe in 2021) and is very erratic, sometimes for days and weeks reaching near 0% for wind and solar, even in top locations.
Thus, natural capacity factors worldwide are a direct result of the location of the wind or solar installation; they do not in any way depend on and cannot be influenced by the technology employed.
The last point is important… no technological advances can change the natural availability of wind, solar, or river flows and therefore influence the natural capacity factor for a given installation. Technology CAN and WILL improve how much usable electricity you get out of the natural input product (wind, solar, river flow, gas, coal, uranium, etc)… this is called conversion efficiency and their limits are discussed further below.
Since the easy locations have already been “used up”, one can expect average natural capacity factors to decline over time… contrary to what Net-Zero plans assume (see International Energy Agency (IEA), McKinsey & Company, or International Renewable Energy Agency (IRENA)).
For a photovoltaic (PV) park, the natural capacity factor CF depends entirely on the intensity and duration of the sunlight, which is affected by seasonality and cloudiness, day and night, and the ability to maintain the PV panel surface’s transparency, e.g., dust in the Sahara or snow in winters.
Wind farms’ natural capacity factors depend on the site’s wind speed distribution and the saturation speed of the wind turbine. The CF of a wind turbine is determined by the number of hours per year in which the wind farm operates at or above the saturation wind speed (Smith and Schernikau 2022). If the design wind saturation speed is set low, e.g., 4-5 m/s, the wind farm produces little energy, even for high capacity factors. Typically, wind saturation speeds are 12-15 m/s.
It now becomes obvious why the installed capacity needs to be much larger for wind and solar than for dispatchable power such as nuclear, coal, gas, or hydro. This significant relative increase in energy generation capacity to produce the same available, but unpredictable, energy output is coupled with a significantly higher raw material input and energy input factor for variable “renewable” energy which must be offset from any fuel savings.
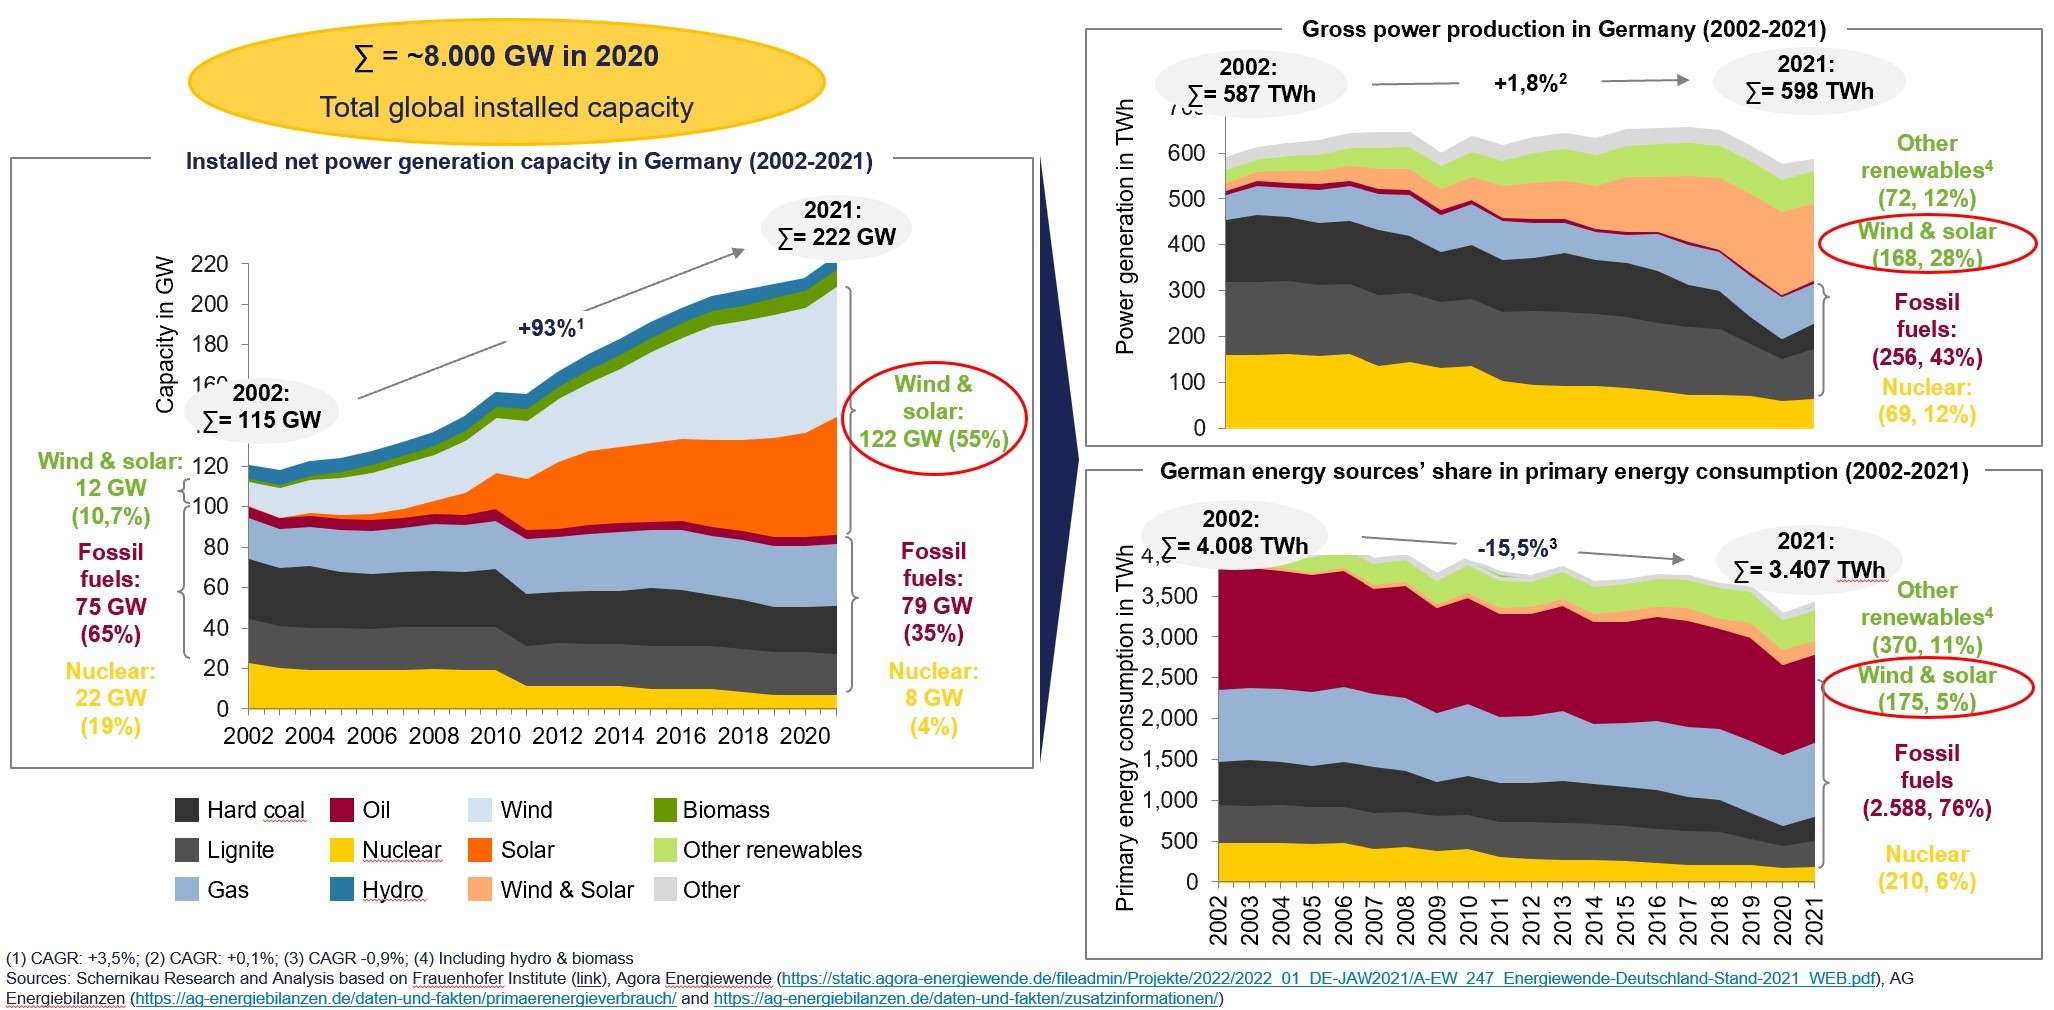
#Germany is a good example: Total installed power capacity more than doubled in the past 20 years, essentially all consisting of wind and solar (see figure below)
Wind and solar installed capacity is now above 125GW, more than 150% higher than peak power demand in Germany of around 80GW
Germany’ conventional installed power capacity consisting of coal, gas, and nuclear still barely matches peak power demand
With all this capacity addition in Germany, wind and solar made up less than 30% of total electricity generation in 2021 and about 5% of total energy consumption
Figure: German installed power capacity, electricity production, and primary energy
Source: Schernikau Research and Analysis based on Fraunhofer 2022, AGE 2021, Agora 2022 Figure 7 in Book “The Unpopular Truth…about Electricity and the Future of Energy”, http://www.unpopular-truth.com
The low natural capacity factor of wind and solar installations – without any doubt – is one of the key reasons for their low net-energy efficiency (https://dx.doi.org/10.2139/ssrn.4000800).
On Conversion Efficiency
Below figure summarizes energy conversion efficiencies for wind and solar and the laws they follow. Conversion efficiency measures the ratio between the useful output of an energy conversion machine and the input, in energy terms, thus after accounting for capacity factor.
I have created this site to help people have fun in the kitchen. I write about enjoying life both in and out of my kitchen. Life is short! Make the most of it and enjoy!
This is a library of News Events not reported by the Main Stream Media documenting & connecting the dots on How the Obama Marxist Liberal agenda is destroying America


