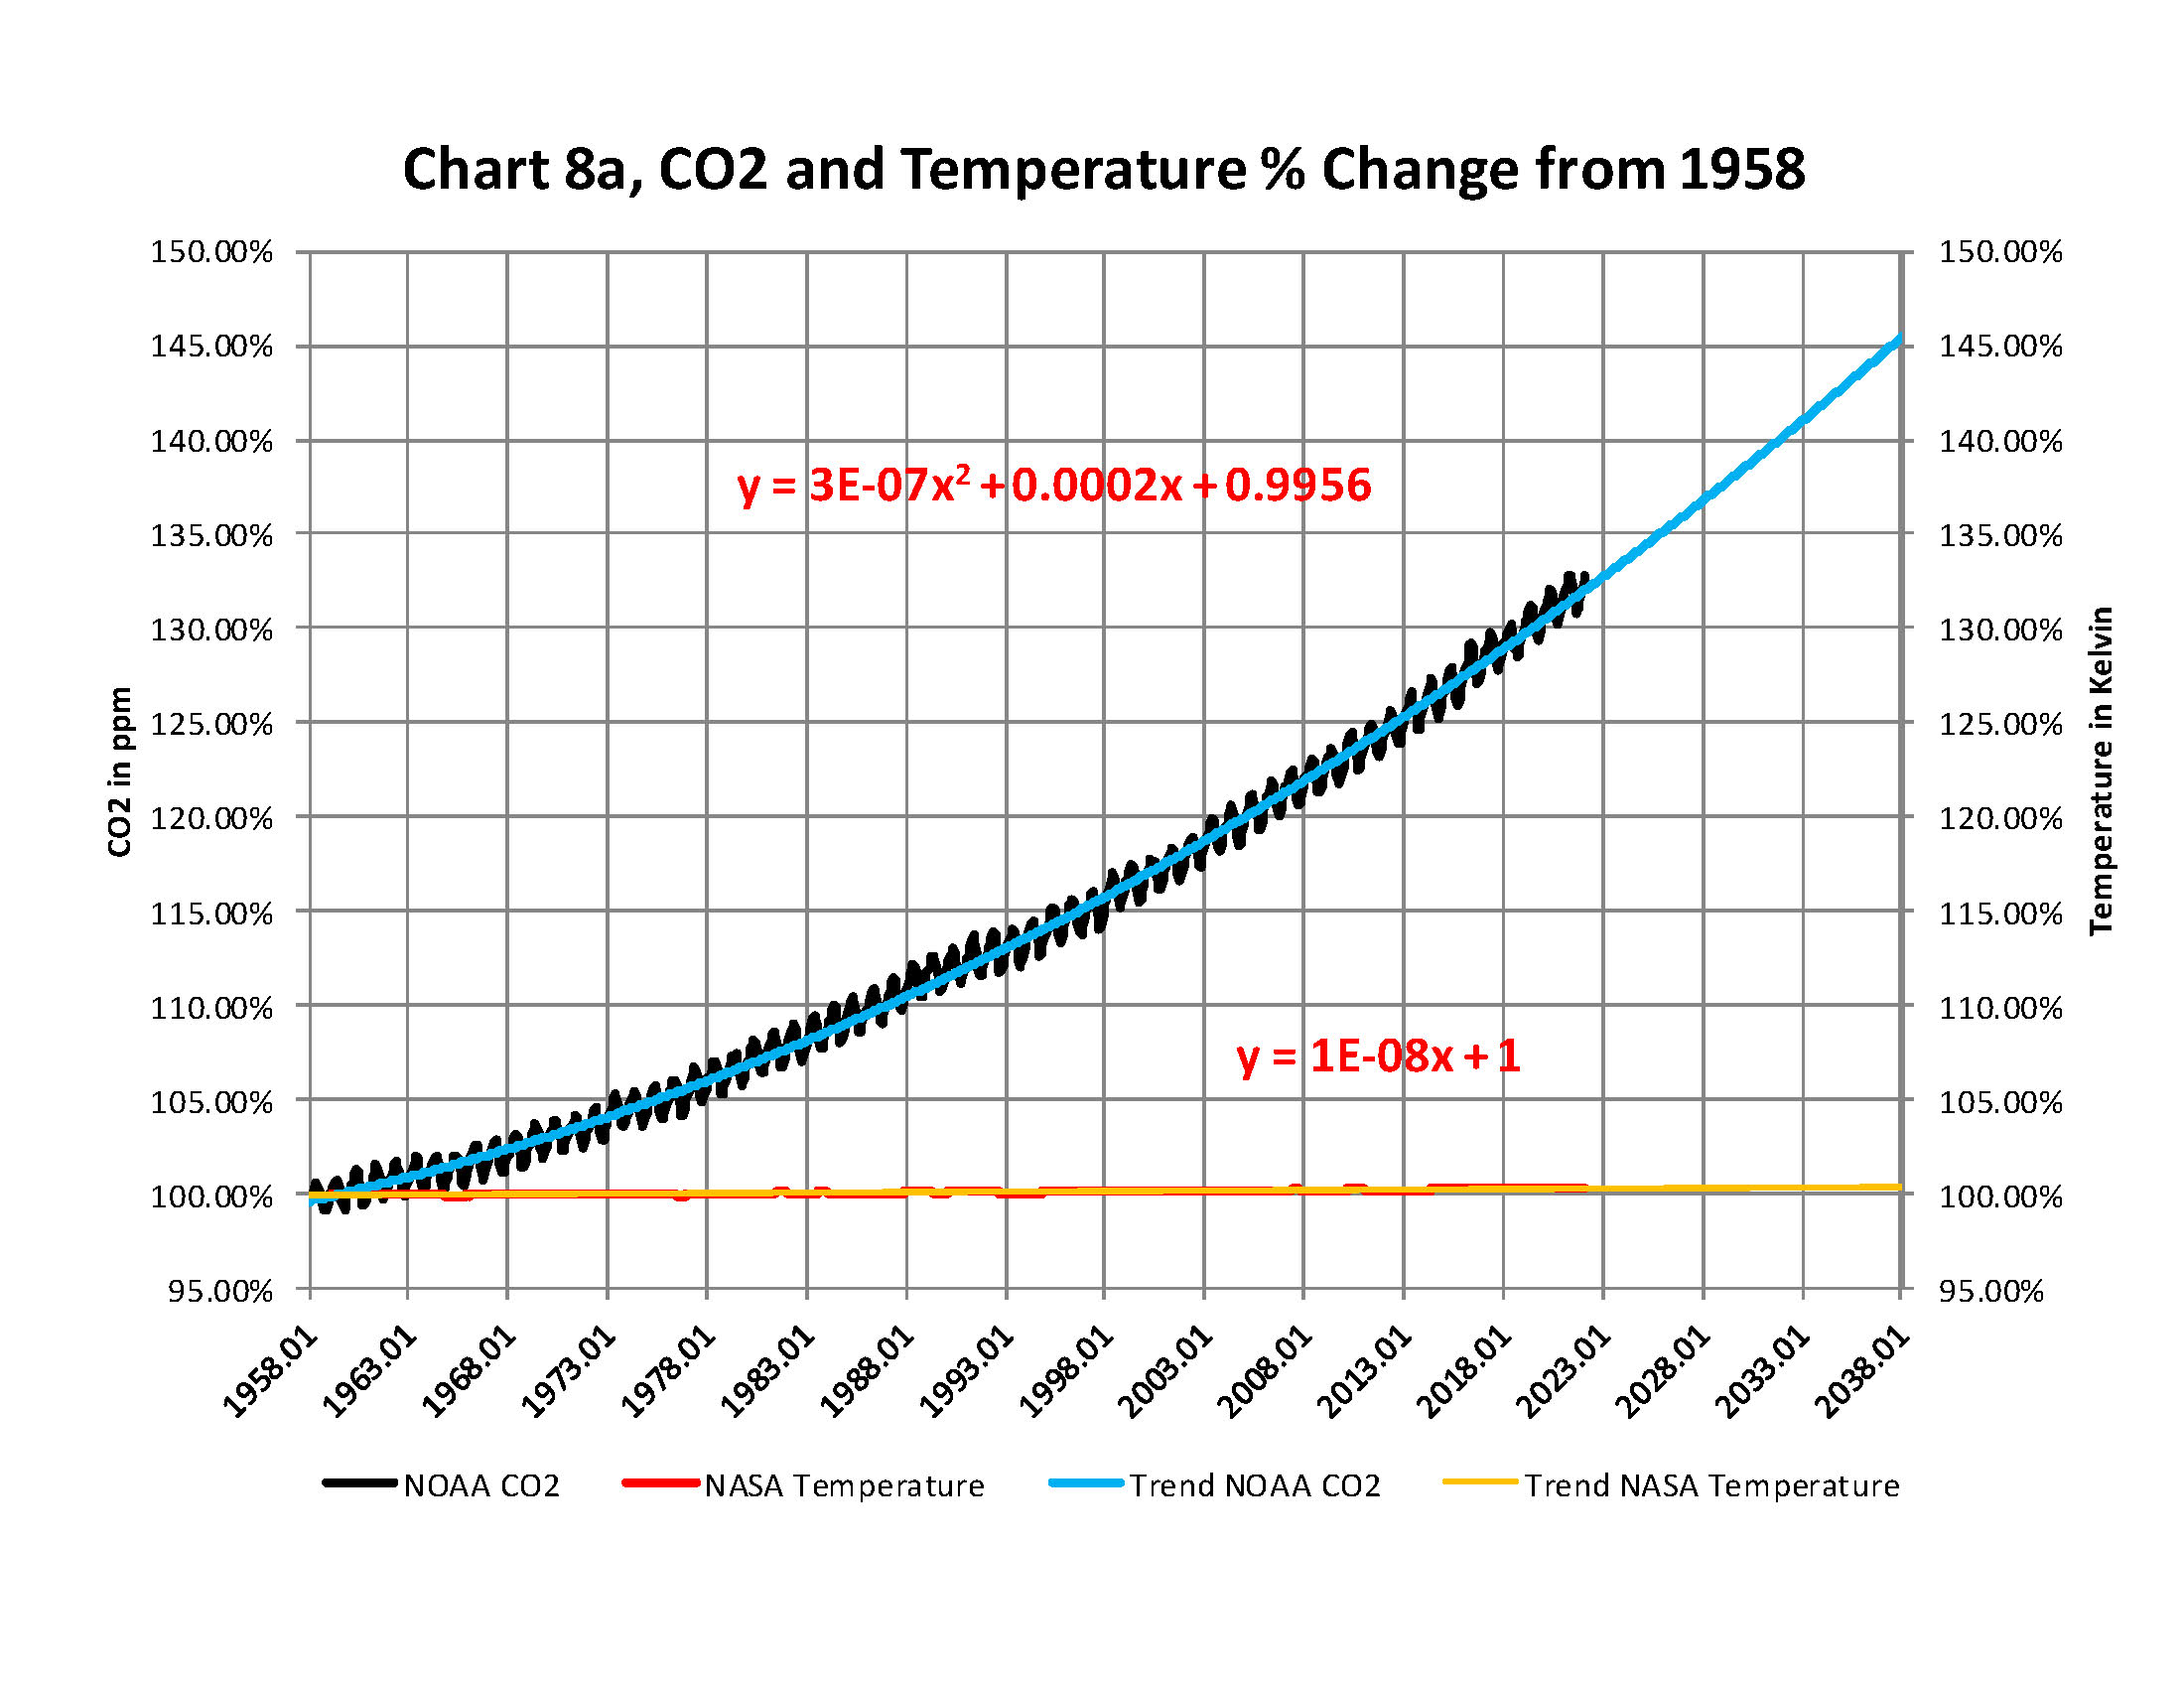
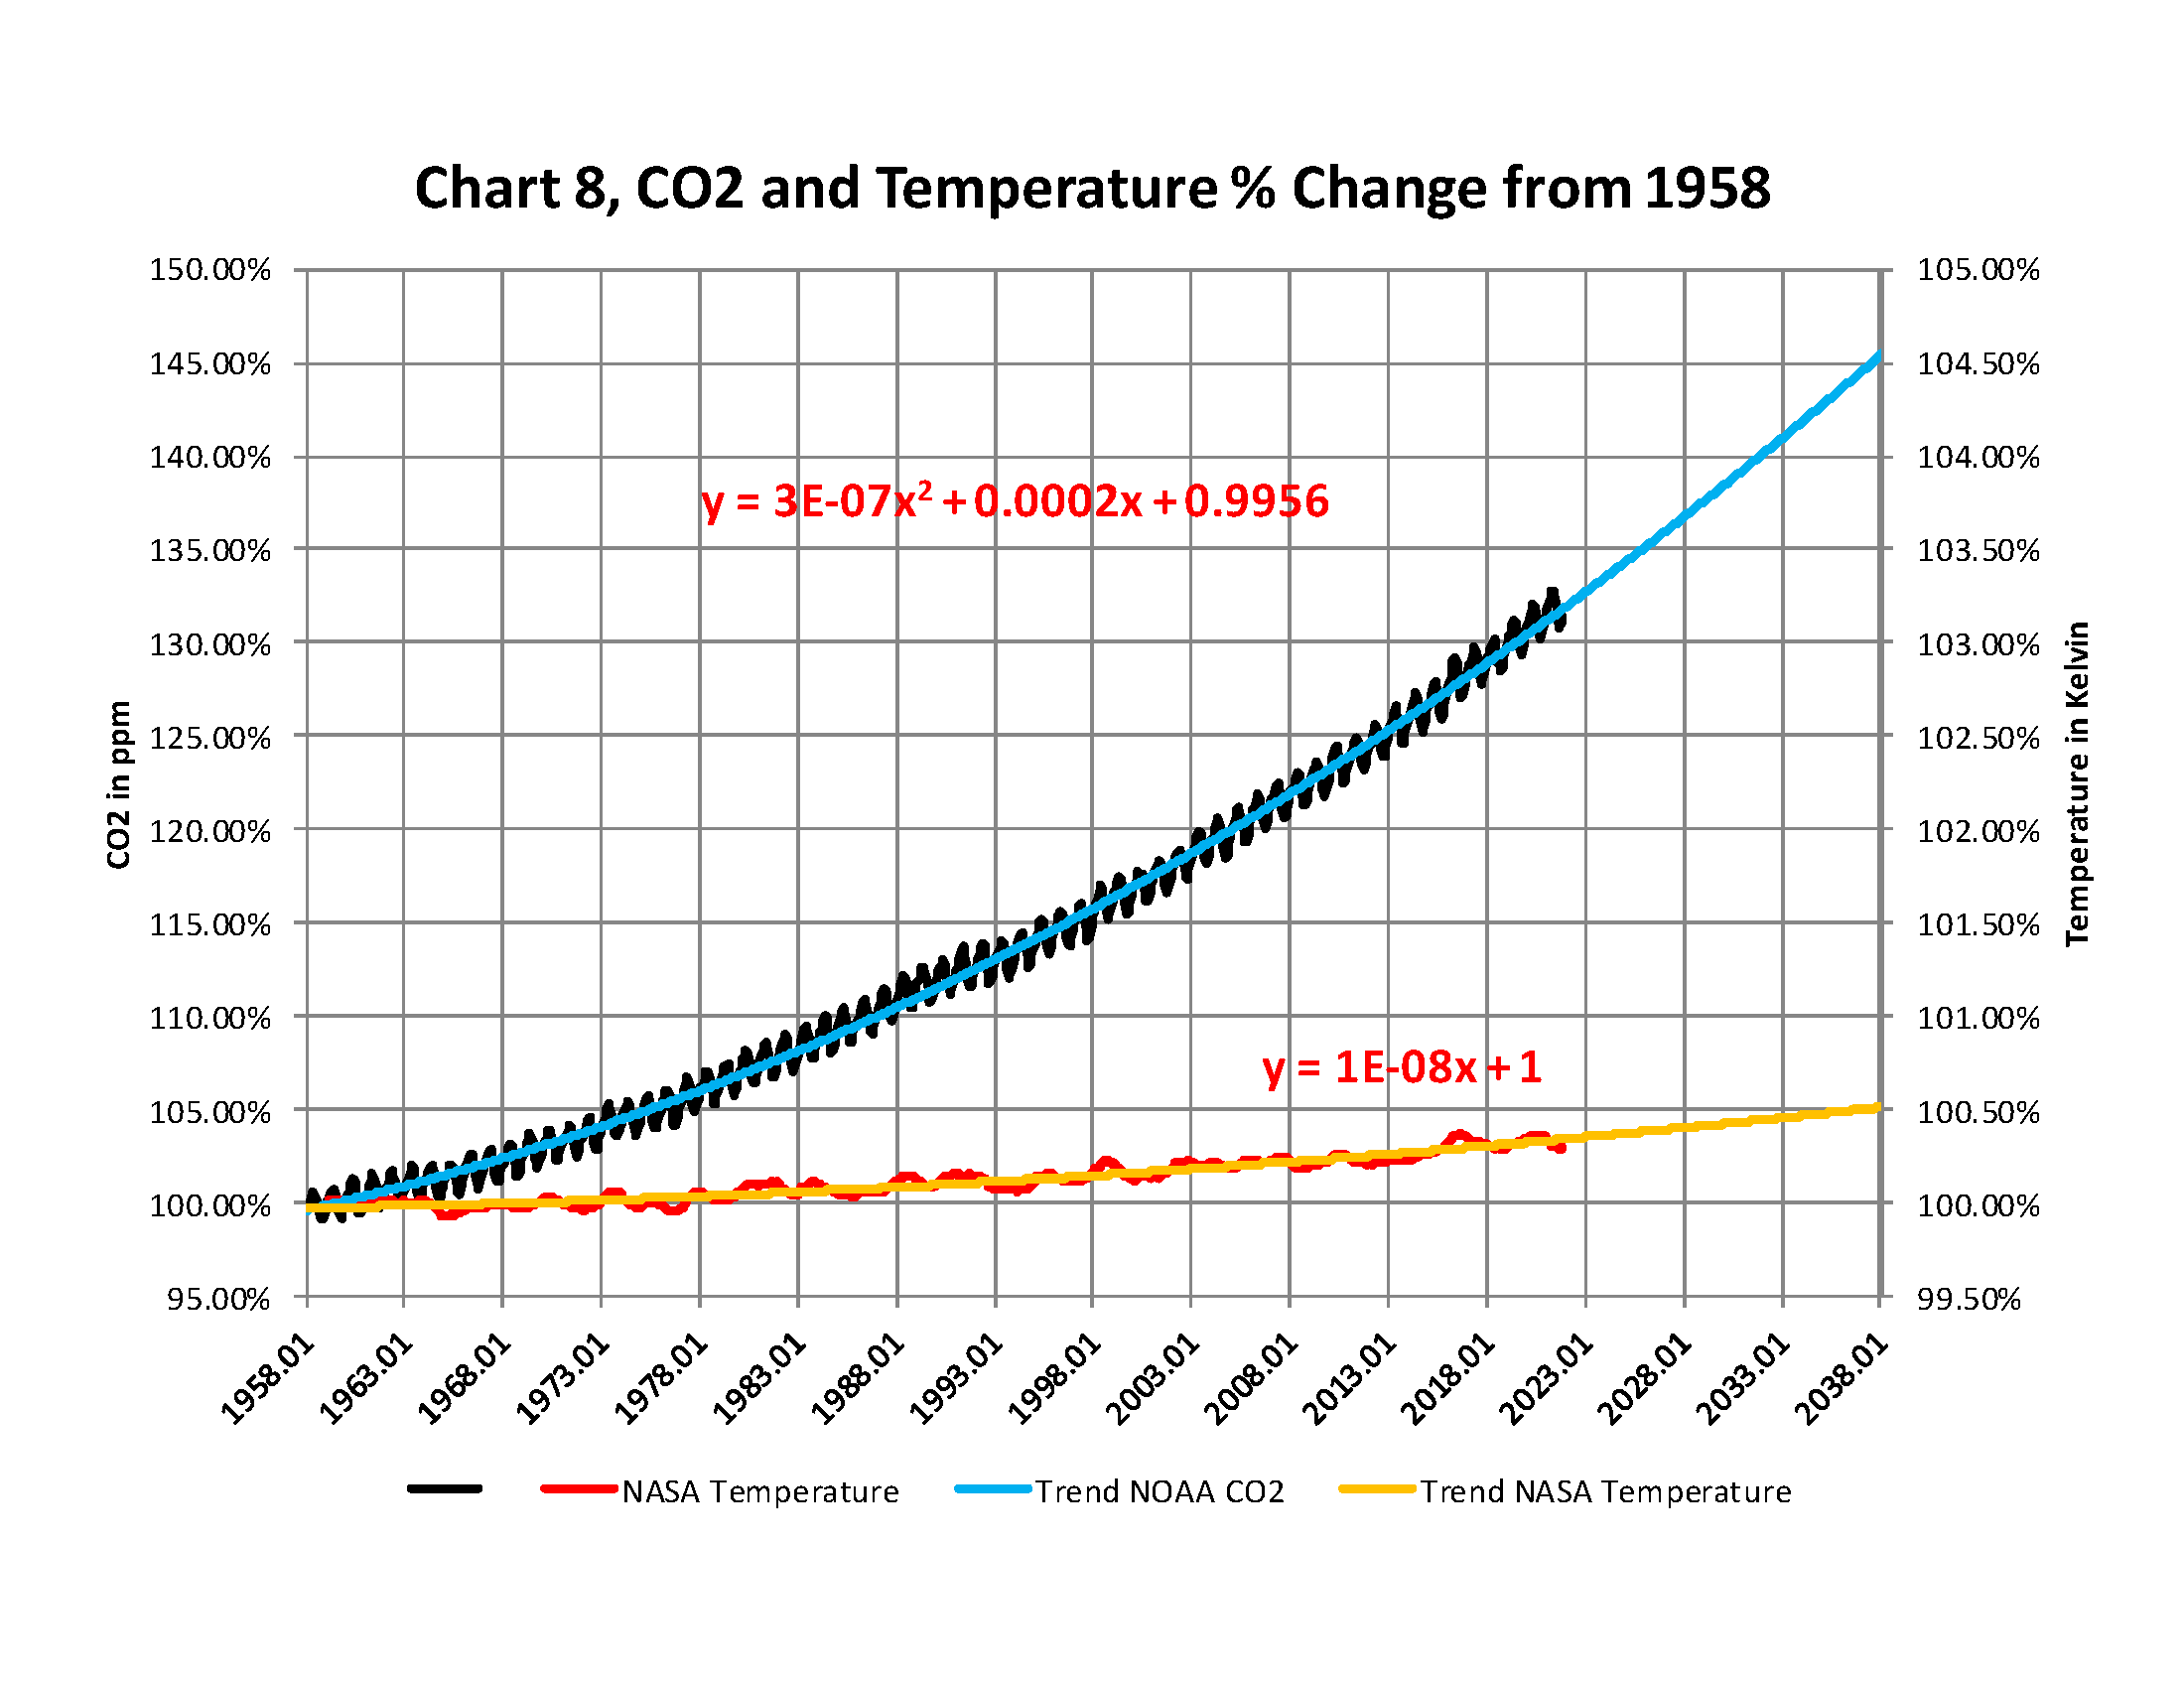
From the attached report on climate change for May 2022Data we have the two charts showing how much the global temperature has actually gone up since we started to measure CO2 in the atmosphere in 1958? To show this graphically Chart 8a was constructed by plotting CO2 as a percent increase from when it was first measured in 1958, the Black plot, the scale is on the left and it shows CO2 going up by about 32.0% from 1958 to May of 2022. That is a very large change as anyone would have to agree. Now how about temperature, well when we look at the percentage change in temperature also from 1958, using Kelvin (which does measure the change in heat), we find that the changes in global temperature (heat) is almost un-measurable at only .4%. As you see the increase in energy, heat, is not visually observably in this chart hence the need for another Chart 8 to show the minuscule increase in thermal energy shown by NASA in relationship to the change in CO2 Shown in the next Chart using a different scale.
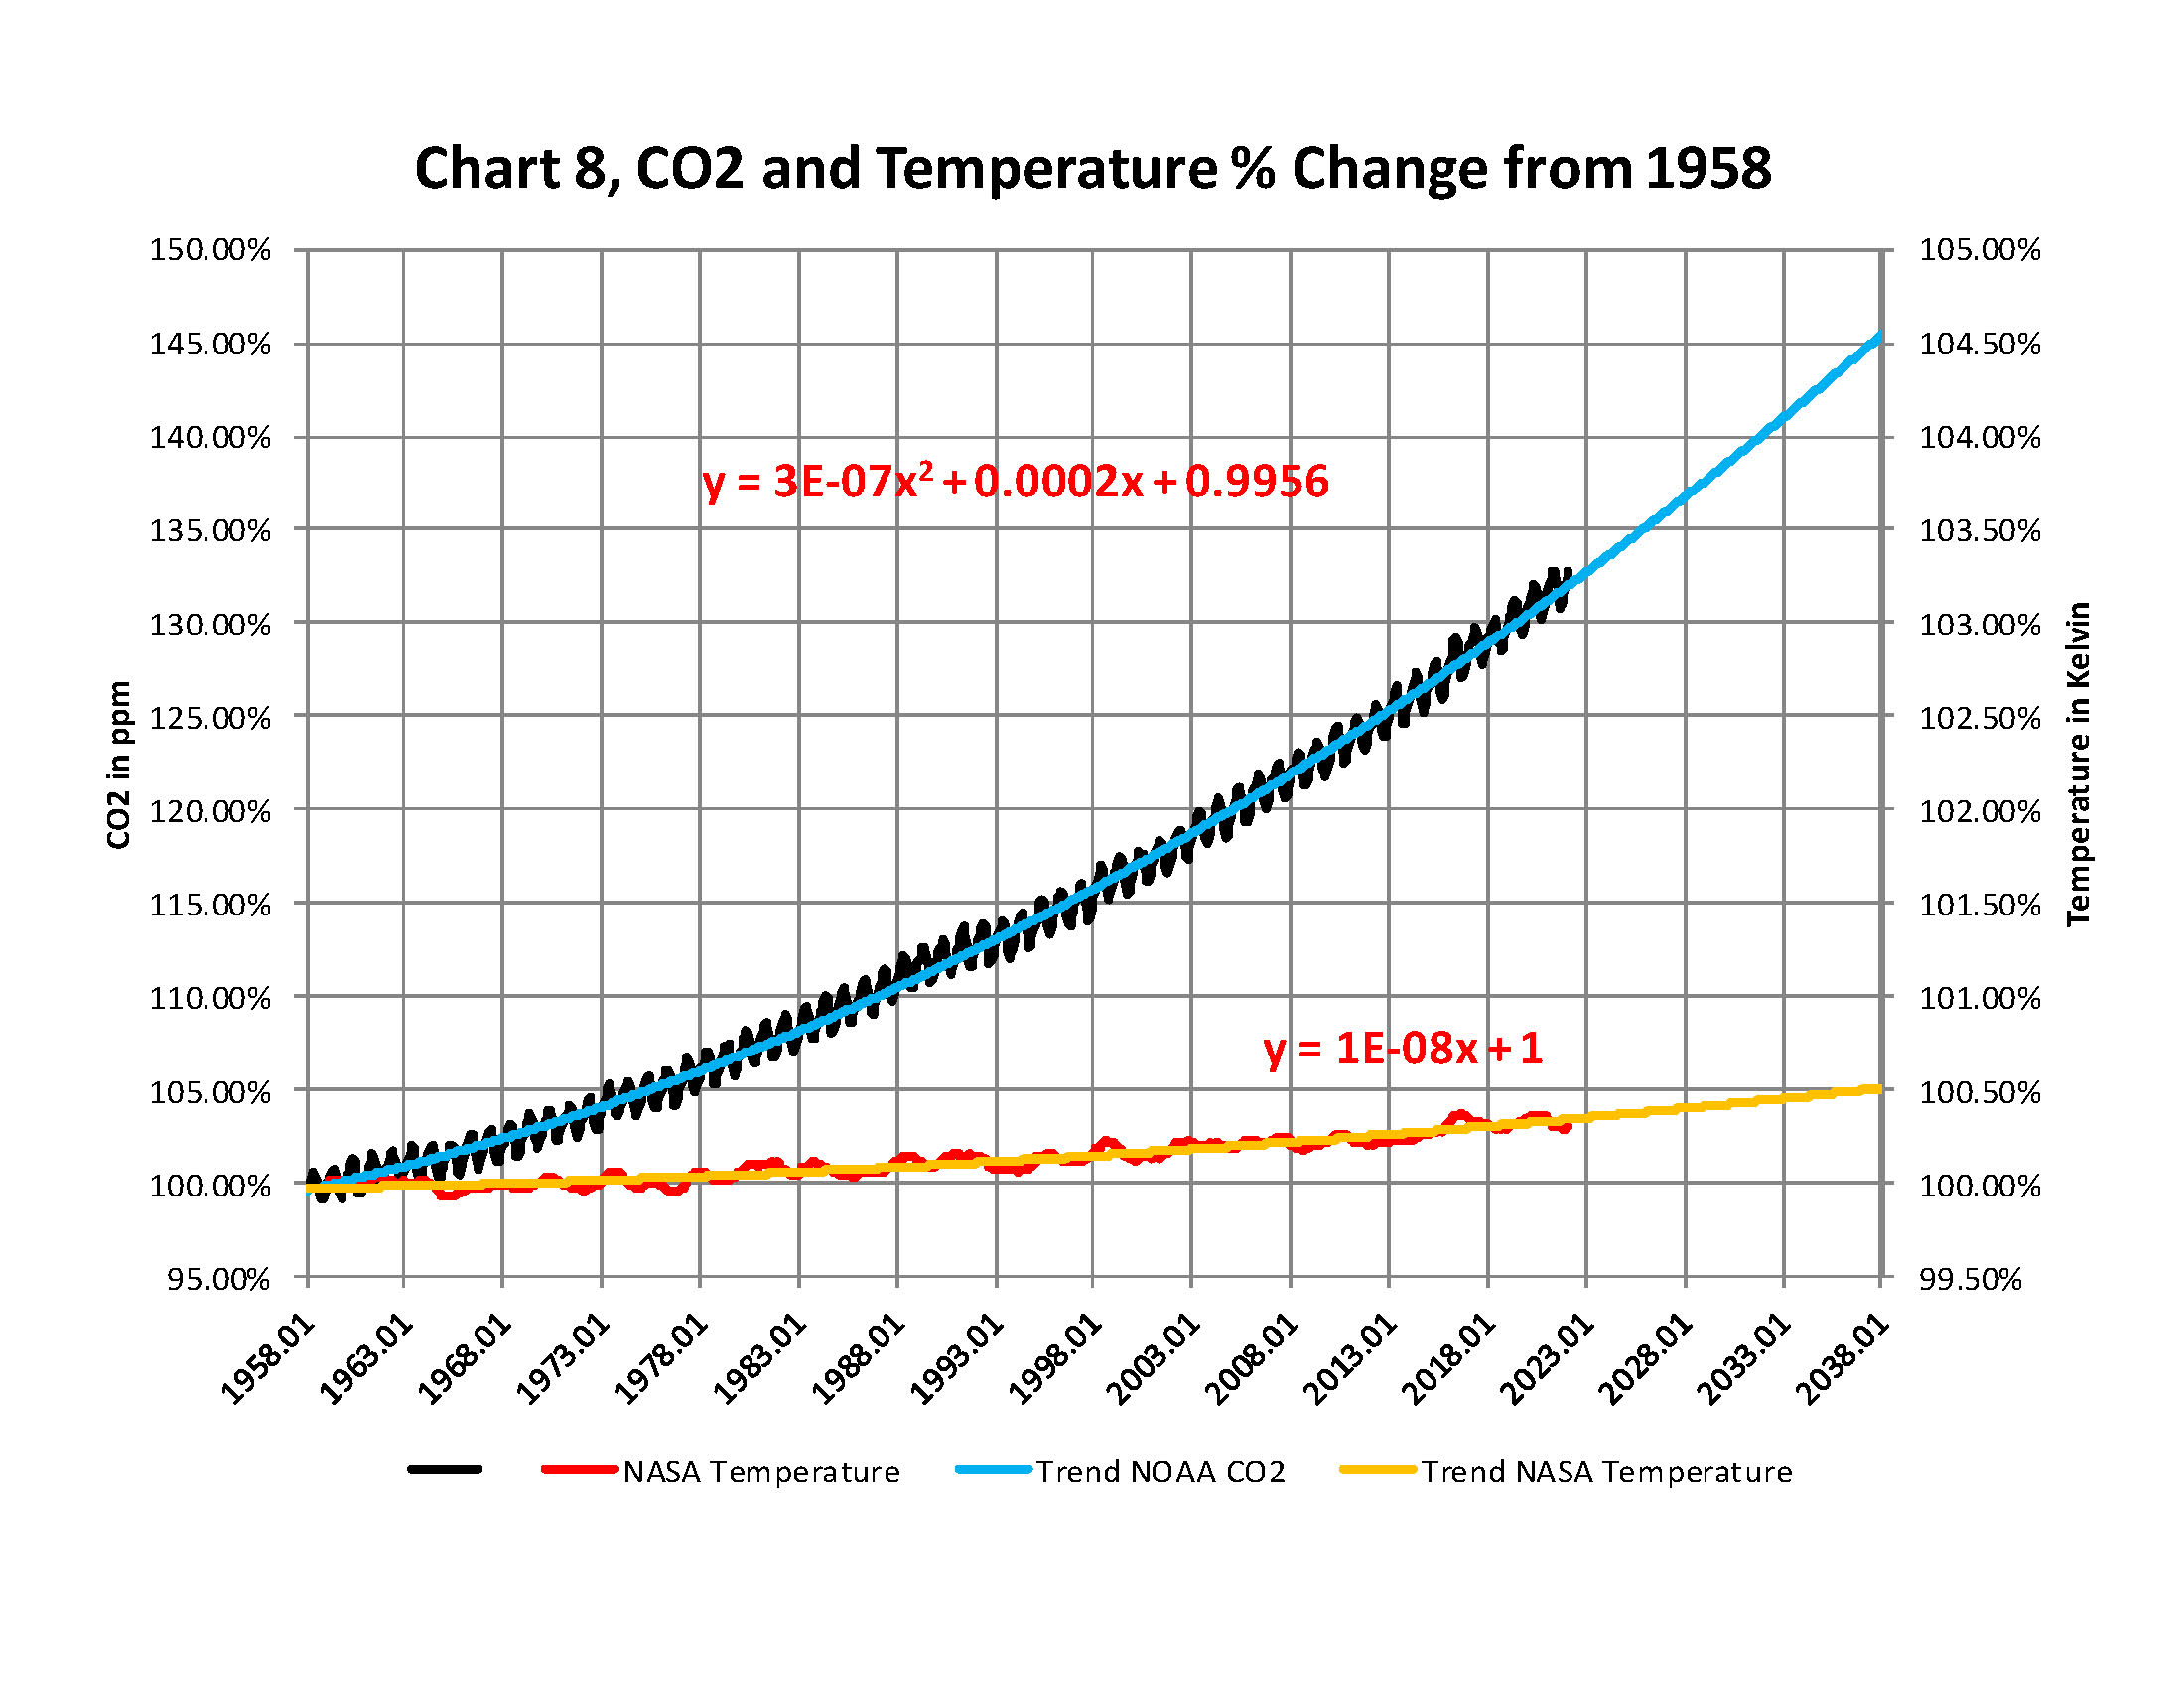
This is Chart 8 which is the same as Chart 8a except for the scales. The scale on the right side had to be expanded 10 times (the range is 50 % on the left and 5% on the right) to be able to see the plot in the same chart in any detail. The red plot, starting in 1958, shows that the thermal energy in the earth’s atmosphere increased by .40%; while CO2 has increased by 32.0% which is 80 times that of the increase in temperature. So is there really a meaningful link between them that would give as a major problem?
Based to these trends, determined by excel not me, in 2028 CO2 will be 428 ppm and temperatures will be a bit over 15.0o Celsius and in 2038 CO2 will be 458 ppm and temperatures will be 15.6O Celsius.
The NOAA and NASA numbers tell us the True story of the Chan ages in planets Atmosphere
The full 40 page report explains how these charts were developed .
spaceXcentric Published originally on Rumble on June 3, 2022
Starship Super Heavy is only a few weeks away from lighting up. Polaris Dawn completes mountain training. Starlink is given a new destination. And we finish with today’s Honorable Mention. Ep 324
SpaceX prepares to static fire Starship Super Heavy 24/7. Falcon 9 breaks another record during the Nilesat 301 mission. Polaris Dawn gives us an update. And we finish with today’s Honorable Mention. Ep 326
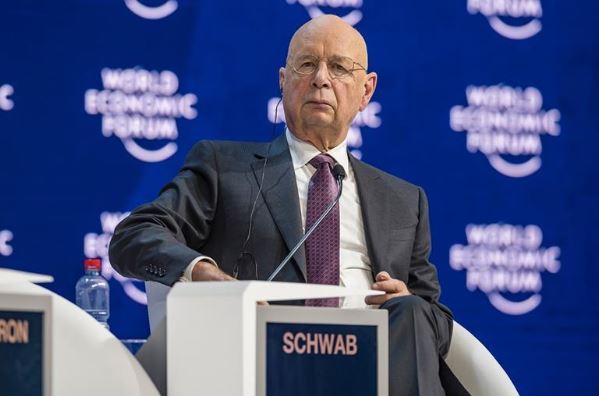
Klaus Schwab’s view of the future and Artificial Intelligence is seriously flawed. He argues that the fusing of the political, physical, digital, and biological worlds will have a transformative impact on every facet of human existence. He insists that this will range from the way we live our lives, the manner in which we will work, the reconfiguration of economic models, the products we sell, and I believe his self-delusion, the power to extend our lives indefinitely. Of course, his cohort, Yuval Noah Harari, dreams of converting society into programmed robots. Meanwhile, Pfizer CEO Albert Bourla dreams of putting chips in every pill that confirms to a central database that you took his latest creation.
Schwab’s Fourth Industrial Revolution is seriously flawed for he has no understanding of actual real AI programming. Yes, insofar as AI is concerned, I do not believe in the view that if you throw in mountains of data, somehow the computer will evolve and figure it all out and come up with a force or conclusion. They did that at IBM with Big Blue. They thought it would find the cure for cancer – it failed. There is something more that makes our brain function. It is NOT just a neural net and consciousness somehow emerges because of all the connections. Granted, they try to mimic the brain and look upon us as simply a biological lifeform without actually understanding there is something much deeper.
Perhaps the night you suddenly fell in love with your partner. You were out to dinner, and your unconscious mind actually recorded everything — the place, the food, the music, what they wore. You consciously are not actually noticing all these variables. But years later, you hear that song, taste that same food, or revisit the place. Suddenly, without even trying to remember, the event is relived. You can close your eyes and see the event as if it were a recorded movie. Our brain is actually recording everything without us even trying. Creating a neural net and dumping all this information in there does not recreate that ability.
Sigmund Freud (1856- 1939) and Carl Gustav Jung (1875–1961) dived very deeply into the construct of the mind. Their view of our unconscious was the result of very deep self-analysis. Socrates is different. I created pathways and taught it how to analyze. I spend a lot of time self-analyzing how I would trade, and what I would look at as an international hedge fund manager. I had to understand how the mind actually worked both on the conscious and unconscious levels.
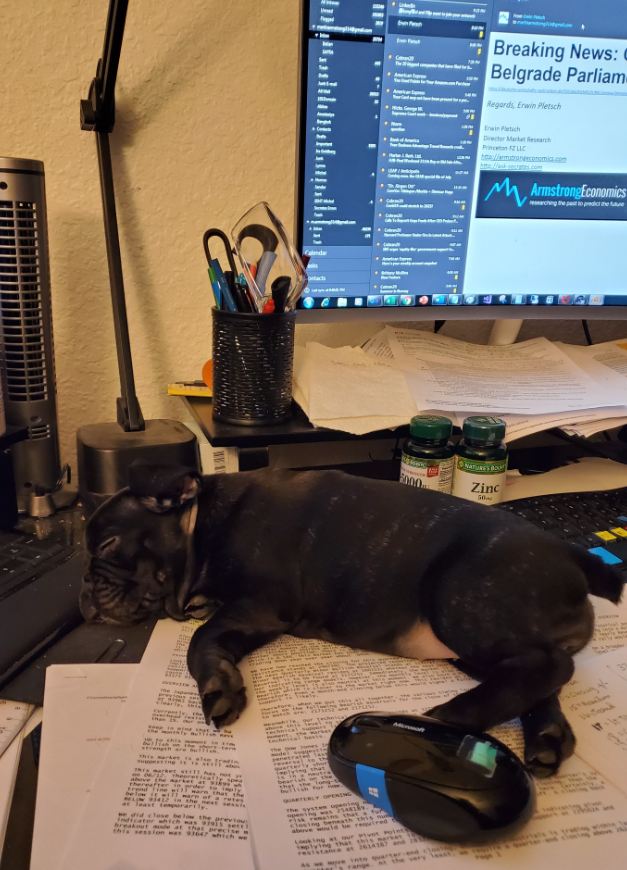
Because I knew I was not going to be a world globe trotter again, I got a dog. She has taught me about how the mind also works. She thinks. She has a strategy. She has the same range of emotions that we have from boredom to excitement. I can see her thinking. She clearly communicates through her eyes and body language. There is an innate ability to communicate with dogs that has evolved over the centuries, which is one of the primary reasons our canine-human love affair has gone on for centuries. There is a distinct dog-human interspecies understanding that is extraordinary, but it also is a glimpse into ourselves. She anticipates where I will go when I get up and will gently let me know when she is hungry. But to my astonishment, she will play ball, but then will try to make me go fetch. She would bang her bowl if it was out of the water, but then if she wanted me to stop working, she would bang the bowl because she knew that sound would cause me to come out of the office.
There is a whole other aspect to not just our mind, but how even a dog thinks, which reveals to me that the failure in AI with machine learning is that it is one-dimensional. There is a far deeper level of activity beyond our conscious mind that they try to duplicate with neural nets. My dog has indeed reinforced my understanding of how to really construct AI, which is substantially different from the one-dimensional neural net.
My dog understands so many words that it is astonishing. I was talking with a friend and just mentioned the word “dog,” and she got up and immediately ran to the window to see what dog dared to enter her domain. If I say we are going shopping, she goes to the front door. If I say we are going to take a walk, she runs to the back door. She obviously understands far more language than I ever expected. A 2020 study by researchers at Eötvös Loránd University in Hungary discovered that, while dogs may not pick up minute details in human speech, they can, in fact, comprehend their owners’ most basic words.
What she has taught me is that even a dog has a conscious and unconscious mind. She dreams as we go. It is really amazing when you pay attention. This is just far more involved than creating a one-dimensional neural net, throwing a bunch of data in, shaking (not stirring), and hoping for the best. Their theory that accelerating the ability to calculate and adding parameters to models was not really a game-changer. The models are faster, and playing a game of chess or Jeopardy, they can beat a human because they have the ability to test every possible outcome in a few minutes. But that is the problem. They can wow everyone with speed, but they CAN NOT create something new. That was the failure of IBM’s Big Blue.
Creativity REQUIRED imagination, and expanding the nodes and speed does not lead to imagination. Without imagination, we cannot create a real game-changer. Thus, all the AI that Schwab cheers will lead the world into his Fourth Industrial Revolution is missing the critical ingredient, which does not exist in the conscious mind but is buried in the unconscious realm where we hide our talents, dreams, and our long lost memories. This is why Socrates has provided forecasting that is even original.
So I have taken a different approach. Socrates is NOT a one-dimensional neural net. Don’t worry. It will not suddenly come alive and decide to wipe out the inferior species known as humans. But the world Schwab envisions is not real. It only leads, not to the critical ability of creativity, which exists only in freedom, but to oppression and conformity precisely as the result of Marx’s experiment we call socialism/communism. Communism collapsed because it suppressed creativity. That also necessitates FREEDOM.
From the attached report on climate change for March 2022Data we have the two charts showing how much the global temperature has actually gone up since we started to measure CO2 in the atmosphere in 1958? To show this graphically Chart 8a was constructed by plotting CO2 as a percent increase from when it was first measured in 1958, the Black plot, the scale is on the left and it shows CO2 going up by about 32.0% from 1958 to April of 2022. That is a very large change as anyone would have to agree. Now how about temperature, well when we look at the percentage change in temperature also from 1958, using Kelvin (which does measure the change in heat), we find that the changes in global temperature (heat) is almost un-measurable at only .4%. As you see the increase in energy, heat, is not visually observably in this chart hence the need for another Chart 8 to show the minuscule increase in thermal energy shown by NASA in relationship to the change in CO2 Shown in the next Chart using a different scale.
This is Chart 8 which is the same as Chart 8a except for the scales. The scale on the right side had to be expanded 10 times (the range is 50 % on the left and 5% on the right) to be able to see the plot in the same chart in any detail. The red plot, starting in 1958, shows that the thermal energy in the earth’s atmosphere increased by .40%; while CO2 has increased by 32.0% which is 80 times that of the increase in temperature. So is there really a meaningful link between them that would give as a major problem?
Based to these trends, determined by excel not me, in 2028 CO2 will be 428 ppm and temperatures will be a bit over 15.0o Celsius and in 2038 CO2 will be 458 ppm and temperatures will be 15.6O Celsius.
The numbers tell us the story of the planets Atmosphere
The full 40 page report explains how these charts were developed .
Way too much effort has been put into a non-issue in regards to extreme climate change; because the planet’s climate has never been constant since the planet was formed. In general, the temperatures have run from 12 degree C to 22 degrees C with the average around 17 degrees C. Since we are now around 15 degrees C, which is on the cold side of the average, it’s hard for me to see where the problem is. Especially, since more people die from the cold weather then the hot weather and current temperatures are below normal and therefore not a threat.
Then we have CO2 which has run from a high of around 7,000 ppm around 500 million years ago to 420 ppm today, again historically very, very low. And there does not seem to be any correlation between the two. In fact, if you look at the last 65 million years the CO2 dropped from around 800 ppm to below 200 ppm and temperature dropped form 22 degrees C to around 12 degree C around 1650. But then CO2 had been dropping for over 100 million year so where is the correlation?
So now, let’s look at the more current climate. But before we can do that, we must look at where all our information comes from. CO2 started to be actually tracked by NOAA in 1958. Their website is https://gml.noaa.gov/ccgg/trends/ and the CO2 levels are published monthly. There is an annual cycle to the CO2 levels, as in the summer, in the northern hemisphere the CO2 levels go down as the vegetation uses the CO2 as food. Then in the winter, we burn lots of carbon based fuels for heating and the levels go back up. Local temperatures have been recorded since the time of the U. S. civil war but they have only been turned into a global temperature going back to 1880 recently with modern computers by NASA. The estimated global temperatures can be found at https://data.giss.nasa.gov/gistemp/ in their table Land Ocean Temperature Index (LOTI) in text or CSV format. However, they are not published as a temperature but as an anomaly from the average temperature from 1950 to 1980 estimated to be 14 Degrees C. which is odd since it’s in the middle of the range that we are looking at which is not a good practice statistically. The reason I say this is that the calculated global temperatures are re-calculated every month as adjustments are made to the software. The process used in called Homogenization by NASA.
To get the anomaly, you would take the current temperature, say 14.8 degrees C and subtract 14 degrees C leaving .8 degrees C and then multiple that by 100 to give you an anomaly of 80. The NASA LOTI table shows that value for every month from the current back to January 1880. I don’t understand why this is done like that nor why they don’t use kelvin like everyone else would use doing research on the quantity of heat in a subject material. I guess it’s because the temperature changes are so small that it’s hard to show a change relevant to the subject as 80 looks a lot bigger than .8 but we have to work with what we are given. For example, 14.8 degrees C divided by 14.0 degrees C equals 5.7% and 287.95 degrees K divided by 286.15 degrees K = 1.0%. A Note, Kelvin or K is used when making these kinds of calculation is science and engineering.
I have all these values in an Excel spreadsheet in column format by month from the current year back to September 2012, Sadly I didn’t keep the ones back to when I started in 2007 since I didn’t realize, back then, that the values in the table were not fixed and there were changes in them as NASA modified the process used to calculated all the values. There are presently 1,707 values in the LOTI table.
We use the NOAA Co2 value starting in 1958, as is, then use the NASA anomalies from 1958 with an adjustment to determine if there is a reasonable correlation between the two over time. The method used was to create a monthly percent increase for each since 1958 the NOAA data is useable as published. The NASA anomalies need to be adjusted as they don’t represent the actual heat in the atmosphere. The base has to be absolute zero 273.15 K (Kelvin) so we can determine the actual increase in thermal energy in the atmosphere. That is a straight forward calculation which needs no description. Once we have the monthly temperature in degree kelvin, we then calculate the increase in thermal energy from 1958 to the present.
The comparison is then very simple. The first plot shown below as the black plot is the monthly CO2 level in the atmosphere as a percentage increase from 1958. The annual cycle is clearly shown in the Chart. The blue plot is the trend line with a excellent fit with a geometric increase that shows there has been no slowdown in the increase. The equation for the trend is shown in red. The second plot shown below in red (hard to see here) is the monthly heat value of the atmosphere in Kelvin and as percentage increase from 1958 just like CO2. The yellow heat content plot is the trend line with a reasonable fit and the equation for it is shown red at the bottom of the chart. The scales on the chart axes are the same for both plots 95%5 to 150%, so the relationships are correct.
Now since it’s kind of hard to see the temperature changes on Chart 8a as they are so small let’s change the scale on the chart and make a new chart. The new Chart is Chart 8 and the scale on the right side is from 95% 105% the scale on the left side is the same at 95% to 150%. With that change, we can see some movement as shown in Chart 8 on the next page. When you compare the two Charts, you can also see how easy it is to make something look like it is something else.
This chart shows that if nothing changes from what it is now, by 2038 CO2 will have gone up by 145% and the heat in the atmosphere only .5% and that’s both from the base of 1958. Since we are told that the base is 14 degrees C which is actually 387.15 degrees Kelvin, 100.5% will only be 288.6 degrees Kelvin or around 15.5 degrees C. That is still nowhere near the historic average of 17.0 degree s C.
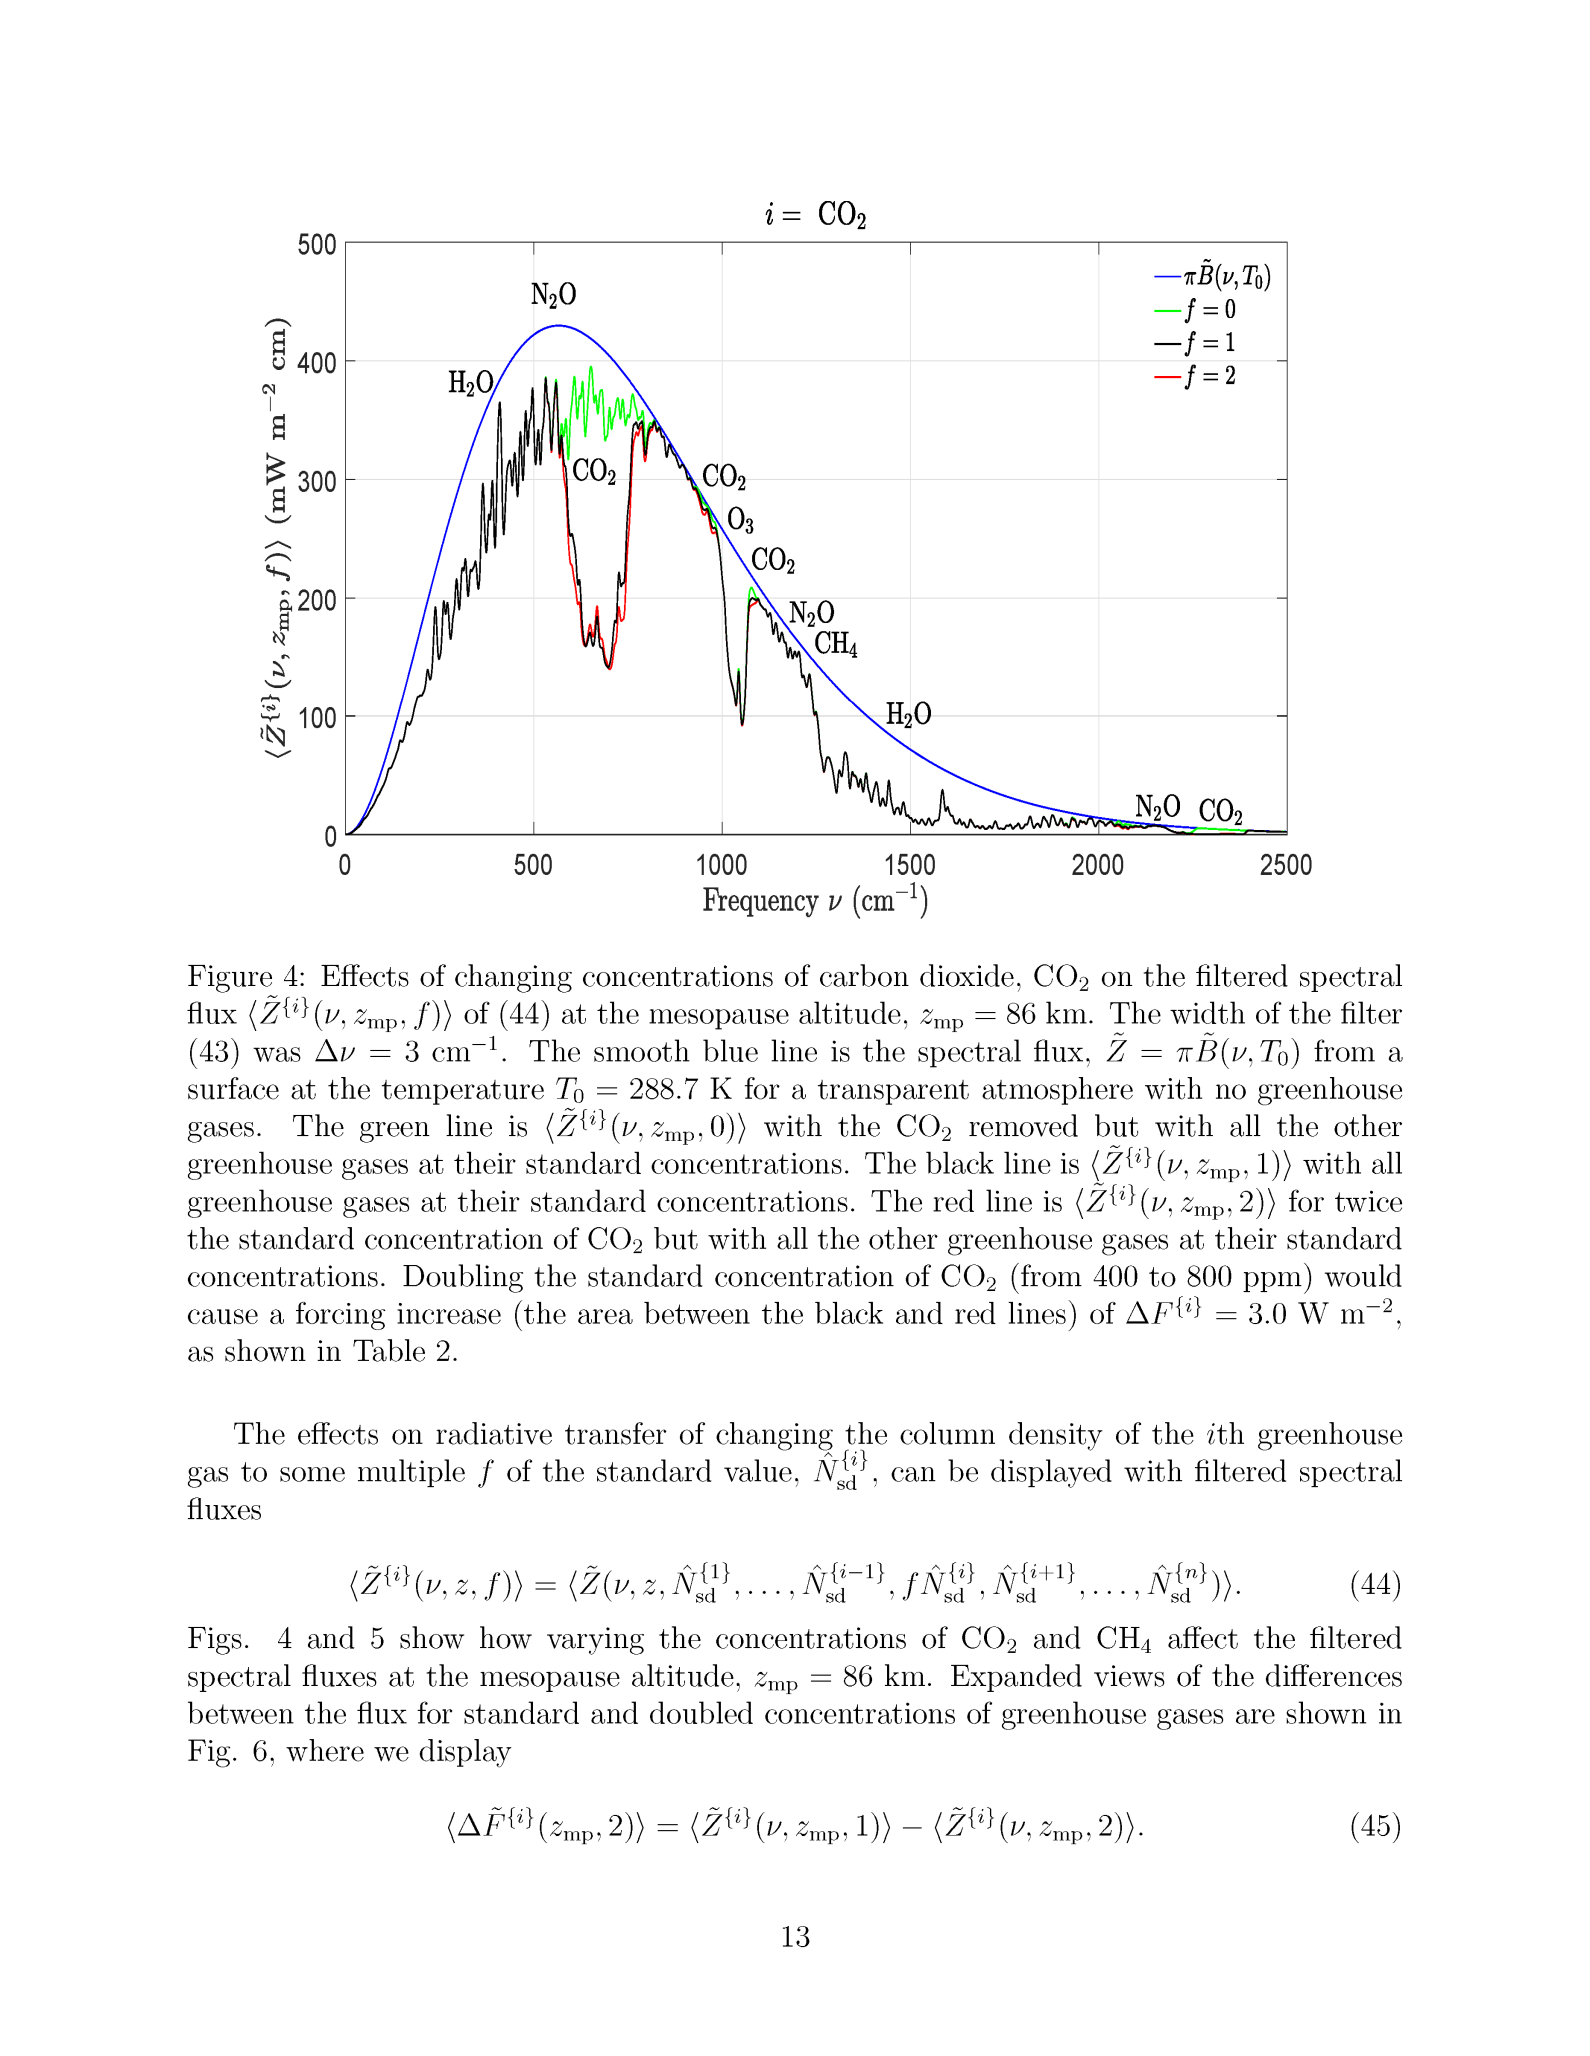
There is however, scientific evidence that this is probably relatively close to what the physics is predicting as what is shown in a paper written by W. A. Wijngaarden and W. Happer and published on June 8 2020 titled Dependence id Earth’s Thermal Radiation on Five Most Abundant Greenhouse Gases. It’s a 38 page work with significant ramifications to the validity of the IPCC climate change narrative. The bottom line to this scientific study is that there is NO DANGER to additional CO2 in the earth’s atmosphere. Any warming that might be caused by CO2 has for the most part already been accounted for. Page 13 from that paper, shown on the next page, clearly shows that the sun’s radiation absorption bands for CO2 are now saturated and there will be no additional effect. The green line is no CO2, the black line is the correct level of CO2, and the red line is double the current level of CO2. As can be clearly seen the black and red lines are virtually identical. In other words, the absorption bands of water in the atmosphere are saturated by the CO2 level around 400 ppm so that even if CO2 goes to 800 ppm it will have little to no effect on global temperature.
In summary, we have shown using two methods that CO2 is not a danger but we will be in great danger if we really try to get rid of Fossil fuels. There are three reasons for this assessment that a realistic engineering assessment of switching from fossil fuels to Solar PV and Wind power is just not realistic.
First, the Green power generation required to replace the existing fossil fuel power generating capacity exceeds the “scarce” raw materials available on the planet to make and maintain them. As shown in the next, three reasons.
Second, the life spans of solar PV and wind power devices are “significantly” less than conventional power plants. So they will need to be replaced constantly.
Third, Solar PV and Wind are both intermittent sources and are not suitable for base load power at the levels required for an advanced technology based economy. The amount of batteries required to smooth the load are also of a relatively short life and would be to be replaced constantly.
Four, The locations for solar PV and Wind generation are generally not were the needs are and they are all in different time zones the Transmission grid will need to be significantly increased to allow for the high voltage flows over long distances.
Then there is the fact that CO2 levels are now below optimum for plant life to use photosynthesis efficiently; the chemical process of converting sun light and CO2 into sugars to make the food they need to grow. CO2 levels above 1,000 ppm would be desirable and anything below 300 ppm CO2 is risky as planets need a minimum of 180/200 ppm CO2 or they die.
From the attached report on climate change for March 2022Data we have the two charts showing how much the global temperature has actually gone up since we started to measure CO2 in the atmosphere in 1958? To show this graphically Chart 8a was constructed by plotting CO2 as a percent increase from when it was first measured in 1958, the Black plot, the scale is on the left and it shows CO2 going up by about 32.0% from 1958 to March of 2022. That is a very large change as anyone would have to agree. Now how about temperature, well when we look at the percentage change in temperature also from 1958, using Kelvin (which does measure the change in heat), we find that the changes in global temperature (heat) is almost un-measurable at only .4%. As you see the increase in energy, heat, is not visually observably in this chart hence the need for another Chart 8 to show the minuscule increase in thermal energy shown by NASA in relationship to the change in CO2 Shown in the next Chart using a different scale.
This is Chart 8 which is the same as Chart 8a except for the scales. The scale on the right side had to be expanded 10 times (the range is 50 % on the left and 5% on the right) to be able to see the plot in the same chart in any detail. The red plot, starting in 1958, shows that the thermal energy in the earth’s atmosphere increased by .40%; while CO2 has increased by 32.0% which is 80 times that of the increase in temperature. So is there really a meaningful link between them that would give as a major problem?
Based to these trends, determined by excel not me, in 2028 CO2 will be 428 ppm and temperatures will be a bit over 15.0o Celsius and in 2038 CO2 will be 458 ppm and temperatures will be 15.6O Celsius.
The numbers tell us the story of the planets Atmosphere
The full 40 page report explains how these charts were developed .
Moderna, the company that produced its first vaccine amid Operation Warp Speed, has plans to release another risky injectable. The company is working on another mRNA vaccine to combat the common flu called mRNA-1010. Moderna is currently in phase two of the trial for the unnecessary vaccine, and there are already major red flags. Those who received the mRNA-1010 vaccine were twice as likely to experience side effects than those who received Afluria, the standard flu vaccine. The adverse side effects were experienced across every age group.
Why would the most vulnerable in our population take a vaccine that is proven to cause twice as much harm as the currently available one? Answer: coercion and fear for profits.
The company also plans to develop a vaccine that combines the unknown chemicals of the COVID vaccine with its flu vaccine. Novavax is already in phase one of a trial for a combination vaccine. The COVID narrative suddenly disappeared from the mainstream media the day Russian troops lined the border of Ukraine, but do not forget governments still plan to use the virus as a significant component of their toolkit to control the people.
From the attached report on climate change for February 2022Data we have the two charts showing how much the global temperature has actually gone up since we started to measure CO2 in the atmosphere in 1958? To show this graphically Chart 8a was constructed by plotting CO2 as a percent increase from when it was first measured in 1958, the Black plot, the scale is on the left and it shows CO2 going up by about 32.0% from 1958 to February of 2022. That is a very large change as anyone would have to agree. Now how about temperature, well when we look at the percentage change in temperature also from 1958, using Kelvin (which does measure the change in heat), we find that the changes in global temperature (heat) is almost un-measurable at only .4%. As you see the increase in energy, heat, is not visually observably in this chart hence the need for another Chart 8 to show the minuscule increase in thermal energy shown by NASA in relationship to the change in CO2 Shown in the next Chart using a different scale.
This is Chart 8 which is the same as Chart 8a except for the scales. The scale on the right side had to be expanded 10 times (the range is 50 % on the left and 5% on the right) to be able to see the plot in the same chart in any detail. The red plot, starting in 1958, shows that the thermal energy in the earth’s atmosphere increased by .40%; while CO2 has increased by 32.0% which is 80 times that of the increase in temperature. So is there really a meaningful link between them that would give as a major problem?
Based to these trends, determined by excel not me, in 2028 CO2 will be 428 ppm and temperatures will be a bit over 15.0o Celsius and in 2038 CO2 will be 458 ppm and temperatures will be 15.6O Celsius.
The numbers tell us the story of the planets Atmosphere
The full 40 page report explains how these charts were developed .
I have created this site to help people have fun in the kitchen. I write about enjoying life both in and out of my kitchen. Life is short! Make the most of it and enjoy!
This is a library of News Events not reported by the Main Stream Media documenting & connecting the dots on How the Obama Marxist Liberal agenda is destroying America