QUESTION: Mr. Armstrong; You are clearly a Roman scholar. Is it true that the Romans used crucifixion only for political crimes and that the two who were crucified with Jesus were not thieves but rebels? There has been some debate on this subject. I would like to hear your views.
Thank you
WR
ANSWER: Jesus’ crime was really sedition and not blasphemy. The high priests may have seen this as blasphemy, but Jesus would never have been put to death by the Romans for such a local issue. The Romans practiced freedom or religion. They allowed the provinces that they had conquered to retain their own gods. Even the Roman Emperor Elagabalus (218-222AD) was an heir to the throne being of the Severian House. He had been a priest in Emesa of the sun god, which is the modern city of Homs in Syria today. He worshiped a black meteor that had fallen from the sky and a temple had been built for this stone of god (see above). When Elagabalus became emperor, he carried the Stone of Emesa to Rome and built a temple there. After he was murdered, the Romans respectfully returned the stone to Syria as to not offend any god. As for the Black Stone of Emesa is concerned, it was most likely smashed to pieces when the temple was converted into a Christian church at some point during the 4th Century AD by the Byzantines.
Therefore, the only possible way that Jesus would have been crucified was for a civil crime, not a religious one, and the penalty had to be only for sedition, which is conduct or speech inciting people to rebel against the authority of a state. It is rabble-rousing, incitement to rebel, subversion, troublemaking, but not a religious issue. Therefore, the high Jewish priests took Jesus to the governor and had to make their case that he was inciting a rebellion against Rome by claiming to be King of the Jews. Pilate interrogates Jesus:
“You are a king, then!” said Pilate. Jesus answered, “You say that I am a king. In fact, the reason I was born and came into the world is to testify to the truth. Everyone on the side of truth listens to me.
“What is truth?” retorted Pilate. With this he went out again to the Jews gathered there and said, “I find no basis for a charge against him.”
Rome’s punishment only for a political crime was a crucifixion, which was a public display that was painful, and a visible warning to others. There is no possible way that the two men crucified with Jesus were common thieves. The sentence of crucifixion was only something that Rome could order. The two men who were killed along with Jesus are identified in the Gospel of Nicodemus as Dismas and Gestas.
Luke 23:39-41 says, “One of the criminals who hung there hurled insults at him: ‘Aren’t you the Christ? Save yourself and us!’ But the other criminal rebuked him. ‘Don’t you fear God,’ he said, ‘since you are under the same sentence? We are punished justly, for we are getting what our deeds deserve. But this man has done nothing wrong.’”
Matthew refers to Barabbas who is released by Pilate in place of Jesus only as a “notoriousprisoner” and that would never imply a common thief. Mark and Luke further refer to Barabbas as one involved in a στάσις (stasis, a riot), probably one of the numerous insurrections against the Roman power who had committed murder. The translation as “thieves,” however, the word can also mean “insurgents,” and it is more-likely-than-not that the two were co-conspirators of Barabbas rather than thieves. This is the only possibility that would support the sentence of crucifixion, which was a political weapon used to send a message to those still living: Do not engage in sedition or this will be your fate.
Crucifixion was an execution that was severe and reserved for political crimes, not common thieves. The more common method of execution in the Roman Empire was by strangling. Even the leader of the Gauls, Vercingetorix, who was an adversary was put on display in a triumph of Julius Caesar and then strangled – not crucified. This was simply a captive of a conquered nation or group who had not been under Roman rule and thus did not warrant crucifixion.
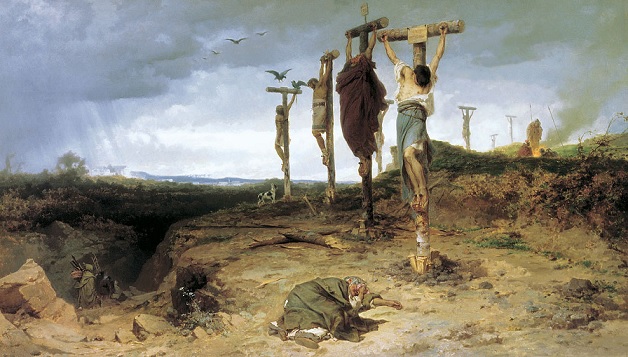
Spartacus (111-71BC) was a Thracian gladiator who escaped and became a slave leader during the Third Servile War, a major slave uprising against the Roman Republic. Crassus crucified 6,000 of Spartacus’ followers on the road between Rome and Capua pictured here in the 1878 painting by Fyodor Bronnikov. Again, the punishment of crucifixion is employed for rebellion. Even Karl Marx listed Spartacus as one of his heroes and described him as “the most splendid fellow in the whole of ancient history” and a “noble character, real representative of the ancient proletariat”.
Therefore, from a historical perspective of Roman law, Jesus would then have been crucified ONLY as a rebel and not for blasphemy. Giving a choice to the crowd between Jesus and Barabbas would not have been plausible unless they both stood for the same type of offense of sedition. This to me is clear evidence of the political nature of Jesus’s execution and was not merely a local religious issue but was a crime of sedition against the Roman Empire.
The War Cycle is in full swing upward since 2014. We have witnessed the invasion of Ukraine, the invasion of Syria, Rocketman in North Korea, and numerous civil uprisings. However, the war also comes with sharply declining economies as political leaders need to point the finger outside their domestic rule to distract their people.
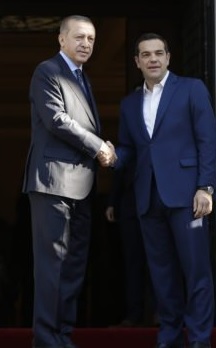
The Turkish President Recep Tayyip Erdoğan is also on a power trip and the sharply collapsing currency only puts more pressure on him to start conflicts. That basic incentive has played out with his visit to Greece in December. This was the first time a Turkish leader visited Greece in 65 years. As the Guardian reports, Erdoğan shocked Greece by calling for a revision of the Lausanne Treaty of 1923. The Turkish president in Turkey has sharply criticized the opposition for this demand and as always there is the justification for protecting people of Turkish origin living in Greece. Hitler used the same excuse to invade neighbors to defend Germans living on foreign lands.
The Treaty of Lausanne marks the conclusion of the four-year Greco-Turkish War, which regulated the demarcation between Greece and Turkey and the rights of the religious minority in the other country. Keep in mind that Turkey was the seat of the Ottoman Empire that conquered Constantinople and renamed it Istanbul. The Church of St Sophia became the Blue Mosque. So the conflicts between Greece and Turkey extend back thousands of years. Turkey was originally Anatolia settled by Greeks. They were conquered by Cyrus the Great of Persia and then by Rome. The Turks invaded from Turkestan and thus the ancient land of Anatolia became Turkey. This was where written language and even money were both born.
Erdoğan, while visiting Athens, accused the Greek government of not allowing the Turkish minority to vote for muftis, as promised in the treaty. Instead, the religious jurists would be appointed by the government. The Turkish President had questioned the Treaty of Lausanne in an interview with the Greek broadcaster Skai TV before leaving for Athens. Airspace and the maritime border could be “improved”, Erdoğan said.
In the Treaty of Lausanne in 1923, Greece had been given almost all the Aegean islands off the Turkish coast. The Greek Islands comprise more than 6,000 islands and islets covering much of the eastern Mediterranean. Only about 230 Greek islands are inhabited and, of these, just 80 or so have more than 100 permanent inhabitants.
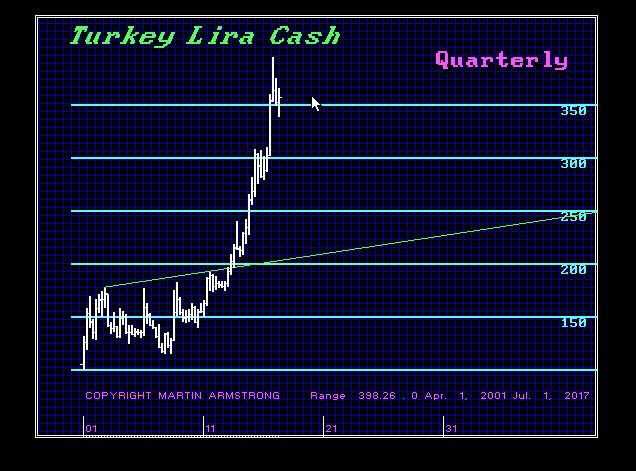
Erdoğan has domestic problems with the currency moving dangerously toward hyperinflation, which only unfolds when confidence in the government collapses. Turkey’s currency is being attacked from all sides. In October 2017, the Turkish lira collapsed when Turkey and the United States suspended bilateral visa processing, which was restored in early November. However, our model is warning that the Turkish lira will collapse into 2021.
Erdoğan is obviously trying to create an external enemy as the domestic economy turns against his policies. For several months, Erdoğan is trying hard to provoke a conflict in the Aegean Sea of Greece. On April 16th, 2017, Greek Minister of Defense Panos Kammenos and Greek Commander-in-Chief Alkiviadis Stefanis flew to Agathonisi Island, just off the Turkish coast. There they carried out an action with several soldiers. Lambs were roasted on a skewer, which was a symbolic action that dates way back to the Greek occupation of Turkey from 1919 to 1922. At that time, the Greek occupiers in the conquered territories of Turkey roasted lamb on skewers to make it clear to the Turks that they would be defeated.
Erdoğan asserts that the protection of the rights of ethnic Turks is his “top priority” and he wants to visit the Turkish minority in the northern Greek region of Thrace. Erdoğan was twice in Athens before back in 2004 and 2010. But it is the first visit of a Turkish head of state in Greece since 1952.
Erdoğan also criticized the implementation of the EU refugee pact with Turkey in Athens. The EU had “not fulfilled any of its economic promises”, while its country has kept all promises, Erdoğan said. He has long accused the EU of failing to fulfill its part of the March 2016 agreement, including the payment of aid.
Erdoğan also criticised the matter of the eight military personnel who had fled to Greece after the coup attempt in a helicopter. Erdoğan stated that Greece promised to extradite those men to Turkey, but that still had not happened.
Judicial Watch Director of Investigations Chris Farrell appears on Lou Dobbs show to discuss President Trump’s Twitter response toward the FBI and Deputy FBI Director Andrew McCabe’s plan to retire. Farrell outlines several things within this interview that CTH has been tracking on background.
.
First, there is a possibility the person Farrell describes at 02:50 might be John P. Carlin, the former head of the Justice Department’s National Security Division who left in October 2016, right after the controversial FISA warrant was issued.
John Carlin landed a job with law firm Morrison & Foerster leading their global risk and crisis management practice.
CNBC Video of John Carlin discussing President Trump and the Mueller investigation from mid-June 2017 is available HERE.
♦Second, while CTH understands the concern Farrell carries surrounding the final IG outcome, there’s no substantive reason to assign an intent of dilution toward his efforts, yet.
However, that said, the concern that Chris Farrell describes surrounding DOJ Inspector General Michael Horowitz explains why oversight Judiciary Chairman Bob Goodlatte has requested production of the IG investigative documentation from the OIG; which is due on/around Jan 15th, 2018.
Regardless of the structure within the finished report from Horowitz, Chairman Goodlatte appears positioning his committee investigators to review the evidence and likely launch a Special Prosecutor criminal probe based on the current investigative evidence; a reported 1.2 million pages of investigative documentation so far.
The first thing to go when a country is moving into economic crisis is the arts. This is intermixed with various social programs. As the economic crisis broadens, demand for taxing the rich rise. However, all this accomplishes is to cause capital to hide and hoard even more refusing to invest or spend and this then adds to the economic decline.
The BRICS were touted as the new rage in the world economy. The BRICS were even holding their own summits and they were supposed to surpass the G7, were all the forecasts. Brazil, Russia, India, China and South Africa became known as the “BRIC” nations back in 2001 which was a term coined by of course Goldman Sachs.
This curiosity about how the BRICS would displace the G7 as the world leading economic power was up there with the DOT.COM bubble and more recently the BitCoin Bubble. This five-country association of emerging economies has demonstrated that such hype of counting on such fades to alter the future have always ended in disappointment.
Russia ran into an economic headwind and sanctions, China has slowed remarkably and has now shifted its focus to try to build its internal economy as we see in Suadi Arabia and the UAE in the Middle East. India committed suicide trying to force its economy out of a cash-based economy with his leftist Prime Minister who has done far more harm to India than good.
South Africa has seen political change sweeping the nation because of the failure of this BRIC dream. The new ANC government of South Africa wants to nationalize the central bank and expropriate the white minority. They want to now take control of the central bank 100% and you know what that means – total economic disaster. The bank will now become the political tool of government divorcing any economic management whatsoever.
Then there is Brazil, burdened with corruption and everything within the social structure is collapsing. The symbol of this economic failure is the effective closure of its Rio de Janeiro’s splendid Municipal Theatre which has gone dark as months of unpaid wages forced ballerinas and opera singers into poverty.
Catching up. If you watched the prior two updates from Brett McGurk you’ll note he does an exceptional job explaining how the administration is coordinating with multiple partners to defeat ISIS. The Trump administration plan was labeled the “D-ISIS” strategy.
Special Presidential Envoy for the Global Coalition to Defeat ISIS Brett McGurk provides an update on D-ISIS Campaign, at the Department of State on December 21, 2017.
.
(Transcript) MR MCGURK: Yeah. Sum up the campaign against ISIS over the past – over the past year and where we are, and kind of a little bit on where we’re going. And we’ll have more to say about that in the coming year, particularly over the coming weeks.
I think it’s worth recalling ISIS used to be controlling basically a state, 100,000 square kilometers, the size of the UK; planning and plotting and carrying out major terrorist attacks against our partner homelands; inspiring attacks here in the homeland; responsible for the violent murder and – violent murder of American citizens James Foley, Steve Sotloff, Peter Abdul-Rahman, as well as the death of Kayla Mueller; committing acts of genocide against the Yezidis as they swept into Iraq, and other minority groups; displacing Christians from their – from their ancient homelands; and destroying our common heritage. We’ve really never seen anything like it, 40,000 foreign fighters from 110 countries around the world pouring into this so-called phony caliphate.
So in January, when the new administration came in, when President Trump came in and Secretary Tillerson came in, we faced real critical challenges in terms of major plotting attacks against us and against our partner homelands coming from Syria and Iraq. And they were aspiring to kind of major, 9/11-type attacks. That’s what they really aspire to do. And so long as they had these safe havens and sanctuaries, particularly cities, a city like Raqqa, and at the time they still controlled half of Mosul, it was really hard to root them out.
So really, three key decisions were made right off the bat as soon as President Trump came into office. Number one, he issued a directive within, I think, his third day for all of us to really look to accelerate the overall defeat of ISIS. He delegated authorities immediately to Secretary Mattis and our commanders in the field. When Secretary Tillerson came in, he made clear to all of us that if everything’s a priority, nothing’s a priority, and our priority is the defeat of ISIS. One of his first major events here at the State Department was gathering almost 70 countries here at the State Department from our global coalition; it’s now one of the largest coalitions of its kind ever assembled in history, with 74 members. And we all gathered here in March really to map out the next phase of the campaign over what is now the last 10 months, particularly Mosul and Raqqa.
The Secretary also made the decision very early on to deploy a small team of experts from the State Department into Syria to work with our military partners as we got into the campaign in Tabqa and Raqqa, which I’ll talk about. We established task forces here at the State Department and the Department of Defense to coordinate the interagency in a way that had not been coordinated before. And we developed an overall global campaign plan called the Defeat ISIS Strategic Plan, which has been approved by the President. So prioritize the defeat of ISIS. If everything’s important, nothing’s important. And accelerate the campaign. And I’ll bring you into the campaign and describe kind of how this has gone over the last year.
Second, when he looked at the situation in Syria, decided we have to set conditions for a political settlement in Syria by de-escalating the overall conflict. This is a conflict that killed 400,000 people, displaced 11 million people, and obviously the situation – we had to look to ways to bring it under control. We had tried things like national ceasefires; they hadn’t worked. So we really – we really took a new approach.
Looked at different parts of the country. Tried to establish de-escalation zones, ceasefire areas, and really pragmatic, pretty hard-nosed diplomacy with the Russians. And looked at Syria in terms of phases. Number one, you have to defeat the physical caliphate of ISIS; so long as you have a caliphate in the middle of Syria, it’s really hard to get a realistic, meaningful political process underway. And you had to overall de-escalate the overall conflict to move ahead on the political process based in Geneva under UN Security Council Resolution 2254. I’ll talk a little bit about that.
Finally, holding Assad accountable for his chemical weapons use and proliferation. I think the April 6 strike ordered by the President – we actually happened to be in some negotiations with the Russians while all this was going on – had a pretty dramatic effect, I think, on the overall situation, our ability to exert some leverage on the overall situation in Syria. So those three key decisions, I think, have made a difference and have helped us speed some things up. I think I have a map. Okay.
So let me just kind of brief on this map. It’s the current situation, and just a situation – if you can all see it. Everything in green on this map, everything in green used to be controlled by ISIS, so over 100,000 square kilometers.
Everything in light green was controlled by – I’m sorry – everything in light green – everything in dark green, the dark green, was controlled by ISIS in January of this year. Everything in light green and dark green has been taken away from ISIS; it’s about 98 percent of their former caliphate. And significantly, 50 percent of all the territory that ISIS has lost, they have lost in the last 11 months, since January.
So 50 percent of all the territorial losses against ISIS have come in the last 11 months over the course of 2017. Seven point seven million people used to be living under ISIS are no longer living under ISIS, and 5 million of those people were liberated over the course of this past year. So when we came into office, there was still about 5 million people under ISIS; they are no longer under ISIS.
Returnees – we’ve talked about this in the past. The pace picked up. In Iraq we have returned 2.7 million Iraqis back to their homes. Again, that is a historically unprecedented rate of returns in a conflict like this – 1.4 million of those returnees in this past year. In Syria, for the first time – the Syria situation still remains totally unacceptable.
All the violence and the loss of life is attributable to Bashar al-Assad and his regime. But in Syria, for this – this year, for the first time, we did see significant returns, about 715,000 according to UN data, actually returning to their homes; 50,000 from outside Syria. And I think the focus on de-escalation had a contribution to that.
So based upon all that, I can kind of bring you into the – what we did over the last year and how this really came together. So there’s a number one on the map, which – oh, I guess this doesn’t work with the TV.
There’s a number one – there’s a number one on the map at Tabqa, which I can point to right here.
Tabqa – the battle of Tabqa began on March 21st, but what’s significant about it is kind of how it began. And I happened to be in Syria right around this time, and the force we’re working with, the Syrian Democratic Forces, identified an opportunity, but they had to launch almost immediately. They said, if we can launch within days to hop over a body of water about 10 kilometers and catch ISIS by surprise, they thought that they could seize Tabqa, the Tabqa dam, and the Tabqa airport.
So our commanders, having the delegated authority, wasted no time, put this operation together. It launched on March 21st, ended on May 11th. And I visited Tabqa shortly after the battle, and it wasn’t just the battle; it was the first time we also had State Department personnel working together to kind of help facilitate the humanitarian and stabilization aftermath of the conflict. So they worked to clear landmines, get humanitarian aid into the city. And the population before the war in Tabqa was 70,000; the population today, about 110,000 since ISIS has left. And without Tabqa, had Tabqa not been seized, Raqqa would not have been able to be taken because Tabqa really kind of helped close the noose on Raqqa. So that delegation of authorities made a specific, immediate difference in that very significant battle.
Second was Raqqa. So shortly after the Tabqa battle concluded in May, we looked at, again, all the options for Raqqa. You’ve reported on this, many of you. We looked at every possible way to do Raqqa.
A couple options were presented to the President, and really the option that he determined was the most viable option was the option to use our partner force, the Syrian Democratic Forces. And a couple reasons for that: the other option would have required really tens of thousands of American troops on the ground, and that’s a model that we do not want to return to. So the battle of Raqqa began on June 6, D-Day as it’s known, but it began on June 6, and it concluded about five months later.
Very, very difficult street-by-street fighting. I was in Raqqa about three weeks ago and you could see the aftermath of this battle. Our force that we work with, the Syrian Democratic Forces, about 400 were killed in the battle, about 700 wounded. No Americans were lost in this battle. We did lose one coalition special forces operator from our – one of our coalition partners.
Displacement. In the battle of Raqqa, in the province, about 264,000 people were displaced, and in the early phase of the battle, you could actually see the displacement. We actually really had to catch up. But having our team of experts on the ground, we immediately flooded resources into Syria and were able to manage the humanitarian displaced population from Raqqa fairly well. About 34,000 now have returned.
One reason why it’ll take a while to get people back into their homes of Raqqa is that ISIS has – basically, every single standing structure in Raqqa has an IED in it. We’re finding that as our teams that we have – we’ve trained about 125 Syrians now together with experts to really clear the streets of these areas that have been cleared, and it takes a lot of time. We’re finding an IED in almost every freestanding structure.
So ISIS, as they lose territory, kind of salt the earth to make sure that life cannot return. We do believe the outlying neighborhoods of Raqqa, which are fairly well intact, we will see significant returns to the center of the city. Having seen it with my own eyes, it is fairly well destroyed. I think it’ll be a very long time before people are able to return there.
We are in the business, as we’ve said before, of stabilizing these areas, clearing landmines, humanitarian – basic water, basic health, electricity. We are not engaged in nation-building exercises and long-term reconstruction.
Let me point to number three. This is right here.
And this is where you can see the red on the map, and that is where ISIS still has some small safe havens. I point to it because there is still very significant fighting going on. And I just want to emphasize this point: This isn’t over. The fact that we’ve made a lot of progress this year, nobody who works on these problems would tell you that we’re popping champagne corks or anything. This is not over. This has a long way to go.
Even on the ground in Syria, there’s probably some months of operations left in this area. Heavy fighting is ongoing; 31 airstrikes, coalition airstrikes in the last week alone. And we killed three very, very senior ISIS leaders right in that area in the last week, and we’re capturing, actually, as we speak, a number of fighters trying to flee.
Last week, a significant milestone: The Iraqi Security Forces and the Syrian Democratic Forces linked up at the border, just kind of tightening the noose on ISIS. And this area also has been critical in terms of deconflicting operations with the Russians, something we’ve talked about throughout the year. We’ve kind of drawn some lines on the map with the Russians about where their forces would be, where we would be.
This is a professional military-to-military engagement focused on deconfliction. We’re not coordinating operations but making sure we don’t have any accidents. That’s extremely tense from time to time, but overall that has gone quite well and accelerated the pace of operations. So the engagement with the Russians has actually, I think, contributed to the demise of ISIS at least in the caliphate.
I’m going to go down to the – just southeast Syria. I’ll start moving a little faster. But right here is a garrison called al-Tanf. We have a small U.S. military presence there. We’re working with the local force. There are still ISIS in the area. There was an operation – we actually engaged with a column, our military personnel, with our partner force just last week in a very heavy engagement.
But another reason why our presence is important there is there is an IDP camp right on the Jordanian border. About 40,000 people are there, and we want to get aid to that camp. We want to get aid to that camp from the Syrian side, and we’re working – we’re pushing, particularly through the Russians, to come up with a common plan to get aid to that camp. And we have called on the Russians to be cooperative in that effort, and we were pleased that earlier this week the UN Security Council resolution renewed resolutions known as 2165 that authorizes cross-border assistance into Syria. That was quite an important development as we manage the humanitarian situation in Syria.
So that’s Tanf. We are present at Tanf, and we’re going to be present at Tanf to make sure ISIS cannot return and also to manage this difficult humanitarian situation. We will also remain present in the other areas of Syria to make sure that ISIS cannot return and to make sure that we can help with the stabilization effort so people can return to their homes.
The final point on Syria is in the southwest. It’s number five.
I point to that because this is the southwest – it’s a de-escalation zone that we negotiated with Jordan and with Russia earlier this year. I think I described it as a painstaking negotiation over many months. That was very true, and it was finalized on July 7th in a meeting between President Trump and President Putin. I think it’s been – it’s not without problems, but it has been a – one of the most successful ceasefires to date. I think we’ve saved a significant number of lives, returning Syrians to their homes.
We’re monitoring the ceasefire every day in Amman. About a thousand Syrians are now returning every month, according to UN data, from Jordan, the first time we’ve seen that trend – that’s something positive, we want to keep it moving – and about a thousand every week displaced from Syria returning to their homes in this area. So total, about 5,000 a month.
We worked to re – kind of strengthen the ceasefire earlier this year – or just last month when we finalized what’s called a memorandum of principles, greater definition to the ceasefire. Key principle: The existing arrangements in these areas can remain in place, so opposition structures remain in place pending a long-term political settlement to the civil war through the Geneva process; and also a commitment, very importantly, to remove foreign forces from sensitive areas of this zone. And what that means are Iranian-backed forces, Iranian-backed militias should not be in this area. That’s something that the Russians have signed onto. And also, we need to remove foreign jihadi-like presence from this area, and there remains a persistent ISIS cell, which is the red blotch just on the corner of the map.
And President Trump and President Putin in Da Nang issued a very important joint statement which memorialized that memorandum of principles in the southwest and also the steps going forward on the political process.
Let me jump quickly to Iraq. I’ll go very quickly. Mosul.
When we came in in January, east Mosul was liberated on January 26th. The battle of west Mosul had not even begun, and we knew that would be an enormously daunting task. We have trained a total of 123,000 members of the Iraqi Security Forces. The battle of Mosul, the cooperation between the Iraqi Security Forces and the Peshmerga, was something that was historic, something we still want to build upon even as there’s tension between Baghdad and Erbil, and something that carried over into the battle of west Mosul.
The battle of west Mosul began on February 19th and concluded on July 10th. It really consumed the first half of this year. It was the main focus of Secretary Tillerson’s gathering so many members of our coalition here in March, where we raised about $2.2 billion, and a lot of that money went immediately into the campaign of Mosul. What’s remarkable about the Mosul campaign is that of a million displaced from Mosul, the worst-case scenario that we had planned for, nearly every single Moslawi that was displaced received humanitarian assistance and aid.
So even with a million displaced, we did not have a massive humanitarian crisis because of the planning that went into this, and that meeting in March was quite significant. In Mosul today we have about 500 stabilization projects are ongoing, and we are still working very closely with our coalition to make sure that we have adequate resources for that.
Finally on the map I want to just talk about two developments here in the bottom. This is the Arar border crossing with Saudi Arabia.
I point to the border crossing, but what’s really significant there is that President Trump and the Secretary very early on, within the first weeks, identified an opportunity to really open – reformalize an opening of ties between Iraq and Saudi Arabia.
The Secretary had an important conversation with Foreign Minister Jubeir. Foreign Minister Jubeir visited Baghdad on February 25th, the first visit of a Saudi foreign minister in 30 years, and from there, chipping away, we really kind of really opened up this relationship.
Speaking personally as – I’ve worked in three administrations; I remember President Bush going a number of times directly to King Abdullah to really encourage this, the argument being that we want to re-anchor Iraq in the Arab world, diversify its regional relationships. Very important, something the Iraqis want; we think it’s in our national security interest. And finally, this broke open.
I visited the – I visited that border crossing in August when it opened and it was quite a remarkable scene. And then on October 22nd, Secretary Tillerson met in Riyadh with King Salman and Prime Minister Abadi to formally launch the Iraqi-Saudi Coordinating Committee. We now have, for the first time in 30 years, direct flights moving between Saudi Arabia and Iraq, two border openings, and this continues to move forward. So that was a real significant breakthrough that we saw this year.
I’d just point finally to the other border crossing, the Turaibil border crossing with Jordan. That’s a multi-billion-dollar-a-year commerce route, and we’ve also worked very hard to open that because our ally Jordan is really first and foremost in our minds when we manage this very difficult situation.
Looking forward a little bit into next year, Kuwait will host a very – two very important conferences in February, one together with the World Bank and the EU on a reconstruction event for Iraq to help reconstruct some of these areas; and secondly, our coalition will gather, similar to the event we had here in March, in Kuwait in the February time frame.
Finally, when it comes to ISIS, we’re not just focused on the physical space of the caliphate, though that was the calling card; it was what held the organization together. We are also, as you know – talked about this a number of times from this podium – foreign fighters, counterfinance, countermessaging is a constant, 24/7 effort from here.
On foreign fighters, it – really an incredible effort, global effort, from all members of our coalition. And working with one of our newest members of the coalition, INTERPOL, we now have from 60 countries about 40,000 names in a database of known ISIS-affiliated fighters who try – have tried to travel or did travel to Iraq and Syria. And the UN Security Council today, we believe, will pass a very important resolution, really strengthening the Resolution 2178 that passed a few years ago. And our colleagues here, Nathan Sales and the CT bureau, doing a terrific job on that. So we hope to have more news on that later in the day.
Counter-finance – we’ve completely decimated ISIS finances by targeting their oil and gas reserves, and they really have no ability to raise significant revenue from what used to be their state-like holdings in Iraq and Syria. But they do still find ways to move money around, and Sigal Mandelker and our colleagues at the Treasury Department working constantly to identify these networks, sanction them, and root them out.
In counter-messaging, just a remarkable improvement from what we used to see, and I give the private sector here tremendous credit – Twitter, Facebook, YouTube. Very difficult to start a Twitter account now with an ISIS-affiliated message. You’re taken down really almost instantaneously; almost a million accounts have been taken down. And we’re working closely in the region with Saudi Arabia, UAE, all of our partners, and in East Asia with Malaysia and others to counter ISIS’s ideology.
So ISIS will be around for a while, so this is a – we have a long way to go. But we did make some progress this year, and I wanted to kind of bring you into it a little bit, decisions we made early and then how they played out. And with that, I’m happy to take some questions.
MS NAUERT: Matt, do you want to start?
♦QUESTION: I’m just curious. It sounds to me – well, it doesn’t sound to me – you said it – that changes from the policy of the previous administration are responsible for this success. You were in charge of implementing the policy of the previous administration. Why if – why – was it doomed to fail? And why did you – why did the previous administration continue to do what it was doing when you mention these three or four changes to it that seem to have brought success?
MR MCGURK: Yeah, thanks, Matt. I think I’d answer it this way. I think this isn’t a – it’s not a political statement. It’s the fact that we had to do a lot to get the foundation for our campaign set. A transition in wartime from one party to another – you look historically, it can always be a difficult endeavor. I actually give great credit – think an untold story – the transition actually on these issues was very smooth. The transition team here at State did a great job and we met regularly with the transition team and said look, there’s about three or four key decisions that, if they’re made early – and we did say at the time we think we can actually defeat the physical caliphate – we actually moved faster than we thought – but three or four key decisions.
Some of them were decisions that the former administration didn’t want to take at the end of their time in office so passed forward. But I will just say it takes – it takes focus and attention and prioritization from the top, and that’s what we got on day one from the President, and when the Secretary came in, and from Secretary Mattis. And those decisions were made. The delegations made a difference. The decision on Raqqa – we looked at the entire – we looked at all options. And the decision the President made in May was quite significant and —
♦QUESTION: Are you saying the previous administration, there wasn’t that involvement, that it wasn’t that big a priority for the senior members of the last administration?
MR MCGURK: That’s certainly not what I’m saying. What I’m saying is that decisions that were made early in the new administration to accelerate the campaign – these are big decisions; it’s not something you just go and make. But they were made early and they had a major impact. And I think the – I think it speaks for itself.
QUESTION: Thanks.
MS NAUERT: Next question. Nick.
♦QUESTION: Brett, could you just – I just have a couple of numerical questions and then one sort of bigger question. The first is do you have a current tally for the number of civilian deaths as a result of coalition airstrikes against ISIS in Iraq and Syria?
MR MCGURK: So as you know, we study this quite carefully. I’d really defer you to the – our CJTF colleagues who study this quite carefully. I can’t give you a number here. But let me give you an example on Raqqa. So I’ve read some reports that in Raqqa, at the end of the day, like thousands of ISIS fighters escaped. So I was just in Raqqa, and here’s what ISIS was doing in the final days of that battle. Down to about two neighborhoods, probably about 300 ISIS fighters left. Whenever they would go outside to move from one fighting position for another, they would take a child with them or a bunch of civilians with them, basically using them as human shields. That’s how they fought in Mosul. That’s how they fought in Raqqa. That’s how they fought in al-Qaim. That’s how they fought throughout the campaign.
So this is extremely, extremely difficult. Our Syrian partner forces and Iraqi forces, and particularly the Iraqis, took a number of casualties and Iraqi soldiers died because in Mosul in particular the humanitarian priority was put at the top of the campaign plan. So a number of times we did not do an airstrike, did not do certain military activities, because of the risk to civilians.
In Raqqa, these two neighborhoods saturated with remaining civilians and a limited number of ISIS fighters – it’s when local tribes from the area came and said we have to actually evacuate all of these civilians. And so that local deal was made. We think about 4,000 civilians – and we track this extremely closely – and a very small number, a very small number of foreign fighters, about 300 total, ISIS fighters. But the truth of the matter, these guys are using – they came to Syria and Iraq and they purport to be representing the Sunni population, then they use the Sunni population as human shields.
So I’m sorry I can’t give you a specific figure, but I just wanted to kind of – I’ve been in some of the centers – in Syria I was in one during the Raqqa battle – of how these decisions are being made. And it is extremely difficult when you confront an enemy like this.
♦QUESTION: Just two quick follow-ups. One is you talked about geographically reducing ISIS control. Do you have numbers of fighters who remain, who were able to flee? And then second, the Pentagon today accused Russia of intentionally violating the deconfliction agreements with the U.S., particularly with air forces. Do you have any comment on that?
MR MCGURK: So with deconfliction, I’d have to defer to DOD. There was an incident on December 13th that – again, whether it was accidental, whether it was intentional, don’t know. There have been direct, very high-level senior engagements between our military colleagues and theirs, and we have not had a significant incident like that since, so the deconfliction line overall has held. We had some – in June – look, in June we shot down a Syrian plane just south of Tabqa when they crossed the line that we had agreed upon. So this is serious. This is really, really serious business. But for the most part, the deconfliction lines have held.
In terms of overall fighters, we think there’s about – I hate to put numbers on it, but in some of these areas where they still are, about 3,000 or so. That’s kind of our assessment. In terms of an exodus of ISIS fighters from Syria and Iraq, it’s our best estimate – and all we can do is give our best estimate from our Intelligence Community – but think that there has not been a significant exodus of foreign fighters from Iraq.
QUESTION: (Off-mike.)
MR MCGURK: I hate to – I have it in my head, I just hate to even say. So I’d defer to some of my colleagues on that.
MS NAUERT: Dave Clark from AFP.
♦QUESTION: Hi. Thanks very much for doing this. Beyond the red areas marked on that map, there are lots of other areas in the world – Libya, West Africa, the Philippines, Afghanistan – where groups that have raised the ISIS banner have sprung up. Are these groups in tight communication? Is it a movement? Is it –is there that command and control, or is this just an inspirational kind of branding exercise from local insurgents? And will the campaign continue until you’ve ridded the whole world of people with the ISIS flag?
MR MCGURK: So look, it’s a great question. And it used to be a very well-connected organization being run out of Raqqa, with direct communication to Boko Haram, which then part of it split and became ISIS in Nigeria; direct communication to Libya, direct communication to Sinai, direct communication to Afghanistan. We’ve pretty much severed a lot of that, particularly from Syria. But look, ISIS became a brand, and a lot of pre-existing terrorist groups – you’ve seen this in the Sinai, for example – start to raise the flag of ISIS, mainly to recruit foreign fighters and other things.
But make no doubt that the defeat ISIS strategic plan that I mentioned is not an Iraq-Syria plan, it’s a global campaign plan. So we use different tools in different parts of the world. But certainly in Mindanao and in Philippines, when they popped up and tried to establish themselves, we worked very closely with Australia, with members of the coalition, with the Philippine armed forces, to root them out.
So this is going to go on for some time. And the main priority number one is protecting our homeland; but second, make sure that they cannot have sanctuary to recruit and attract foreign fighters.
♦QUESTION: Now just let me do a follow-up on that. So the Russians are saying that ISIS is defeated in Syria; you’re saying there’s still some 3,000 or so there. Does that reflect different understanding of the intelligence, or is that a political thing and they want to have an excuse to kick you out of Syria now – job’s done, leave us and Assad alone?
MR MCGURK: Well, as I said, look, we’re advancing our own national security interests in Syria. We’re going to stay in Syria to make sure there’s an enduring defeat of ISIS, to make sure we can stabilize these areas. That’s very clear. No, ISIS is not – is not totally defeated in Syria. As I mentioned, I think I gave you the number of airstrikes we’ve done in the last week alone, so that’s very clear.
And another key statistic: Every coalition-enabled – meaning our coalition – enabled operation against ISIS, ISIS has never been able to come back and reclaim a territory that we helped liberate. Frankly, the Russians can’t say that. In Palmyra they did the kind of concert. They got a lot of attention. Then ISIS actually came back and retook Palmyra. We’re having some problems on the south side of the river, in which Syrian armed forces claim to have liberated these areas and we see ISIS trying to come back. It’s not happening in the areas that we helped liberate because we do a lot of extensive planning for what comes afterwards.
So bottom line, to answer your question, no. ISIS is not totally finished in Syria. We still have a lot of work to do.
MS NAUERT: Nick from Fox News.
♦QUESTION: This is somewhat related. But do you see indications that the Russians are now eager to get out of Syria? And do you think – and maybe this is premature, but if so, do you think that could fast-track the Geneva process?
MR MCGURK: So we have agreed with the Russians that the only way – the only way – to bring an end to this conflict is through Geneva, through 2254. We’ve also made clear as a coalition that there will be no international reconstruction assistance for regime-controlled areas of Syria absent that political process really moving ahead in a credible way that can ultimately lead to a political transition. We also happen to believe that the end point of that political process, which is UN-sponsored parliamentary and presidential elections, so it’s all Syrians vote – that means the entire diaspora votes. The 5 million people who were displaced from Syria can vote and the Russians have now signed up to that. We believe that if you get to that point – and that’ll take some time – that Bashar al-Assad will no longer be in power in Damascus. The Russians might have a different view.
I’ve seen the announcement that they – okay, ISIS has wrapped up and they’re going to withdraw from Syria, but that really remains to be seen. I think they will retain a fairly significant presence. And again, we will engage with them where our interests align and we will make very clear to them where our interests don’t align. So when it comes to Syria, you have to have some engagement with the Russians. There’s a military-to-military deconfliction channel. And on the diplomatic side, we’re engaged with them regularly.
MS NAUERT: Just a couple more questions. (Inaudible). Thanks, (inaudible).
♦QUESTION: I’m curious about the relationship between the U.S. and the YPG because obviously, that’s a major sticking point here, and I think a few weeks ago, Jonathan Cohen said that the relationship was temporary and tactical. We’ve seen Trump tell Erdogan that there are going to be adjustments made to that relationship. So can you give us – shine some light as to what those adjustments are going to be going forward?
MR MCGURK: So after the battle of Raqqa – so Raqqa, again, such an intense urban, like, assault – that’s why it required a presidential decision because we had to give some equipment – and it’s limited, extremely limited – all of which was very transparent to our NATO ally, Turkey – but that decision had to be made if we were going to do Raqqa, and it was. Now that that major phase of operations is over, there will be adjustments in the level of military support.
We will continue to remain in Syria and to work with local hold forces. The Raqqa internal security force is a force that we’re training to make sure that we can hold the ground and continue to work with the Syrian Democratic Forces. But as the years goes on, there will be adjustments to the type of support, just given the way the campaign is proceeding. I think that’s very natural. That was always part of the plan. That was what we briefed to the Turks before Raqqa and that’s what we’ve told them now. So that’ll kind of continue throughout the year.
But as we remain in Syria, we’ll continue to work with local actors. We want local people to be in charge of their areas and we will retain our policy of full transparency with Turkey.
MS NAUERT: Okay. And the last question, Robbie from Foreign Policy.
♦QUESTION: Yeah. I was wondering if you could give your thoughts on the peace process Russia is attempting to open up in Sochi. How will that impact the negotiations in Geneva? Is there any conditions in which the U.S. would support those talks?
MR MCGURK: So it kind of remains to be seen. We’ve heard Sochi was going to happen last month, then it was going to happen this month, now it might happen in January, now it might happen in February. We’ve engaged with the Russians on this about exactly what they have in mind and they have said that Sochi would be kind of a gathering of Syrian figures, and then what happens in Sochi would feed directly into Geneva. If that’s the case, that’s something that might actually support the Geneva process. What we would not support and what would have absolutely no legitimacy would be a parallel process that’s parallel entirely to Geneva.
Geneva is the locus of where the political settlement has to be struck. That’s not only U.S. policy; that’s now something the Russians have very clearly signed up to in the Da Nang statement. So I would just have to say it really remains to be seen.
We also have, I have to say, some real skepticism of anything in which the Iranians are a guarantor of a process. So the Astana process, for example, in which the Iranians play a guarantor role for de-escalation zones – one reason we’ve not participated in Astana, we observe, is because that just kind of lacks credibility. So we’ll continue to remain engaged with the Russians and we want to settle the Syrian civil war through a constitutional reform process leading to UN-supervised elections in Geneva. And that is the key to unlocking reconstruction assistance in Syria writ large. So we’ve been very consistent with the Russians on this. In Da Nang, they signed up to the overall roadmap, and so we’ll have to see. This will be a key focus here over the coming year.
Final point, just to sum up. When we looked at the situation in January, it was hard to see how you could have a really credible political process until you remove the physical caliphate and you bring the overall levels of violence down. And that’s why over 2017, we were so focused on defeating the caliphate and de-escalating the overall civil war. And that sets the conditions now for a more meaningful political process in Geneva. Staffan de Mistura was just here yesterday. We met with him about the next steps. And this will be a very intense focus of ours over the course of the next year, so we look forward to briefing you on that. Okay.
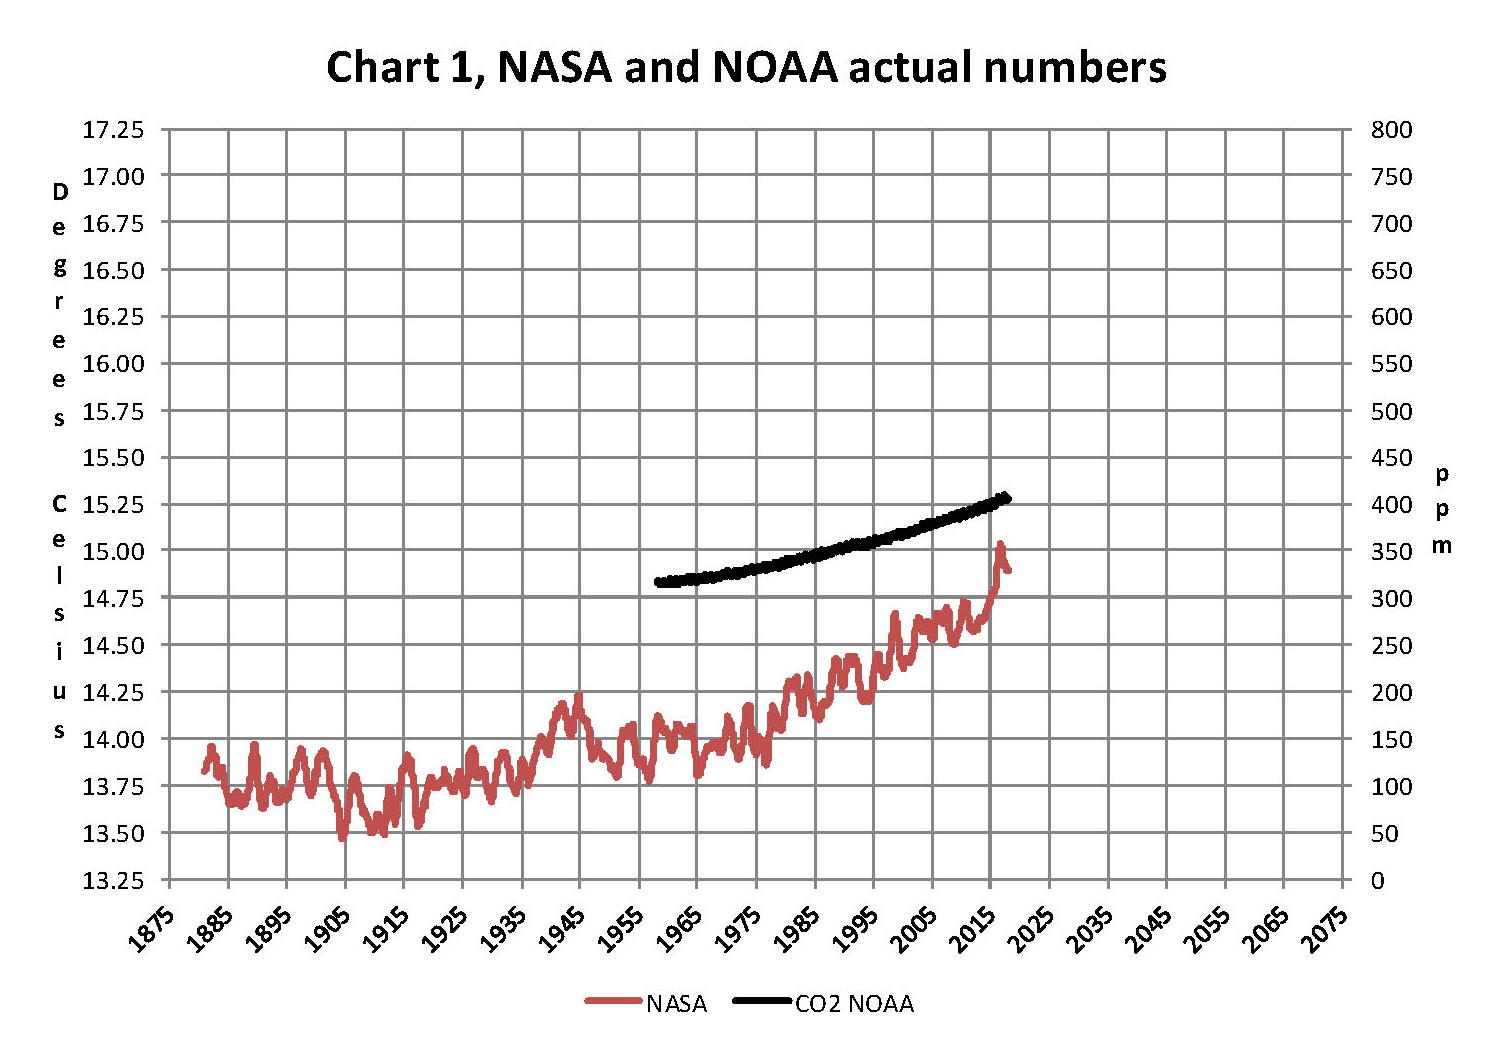
The analysis and plots shown here are based on the following two data series. First NASA-GISS estimates of a global temperature shown as an anomaly (converted to degrees Celsius) as shown in their table Land Ocean Temperature Index (LOTI) and shown in Chart 1 as the red plot labeled NASA the scale for the temperatures is on the left. The NASA LOTI temperatures are shown as a 12 month moving average because of the large monthly variation. Second NOAA-ESRL Carbon Dioxide (CO2) values in Parts Per Million (PPM) which are shown in Chart 1 as a black plot labeled NOAA the scale for CO2 is shown on the right.
NASA published data as stated in the first paragraph is shown as an anomaly, but what is a temperature anomaly? An anomaly is a deviation from some base value normally an average that is fixed. There were two problems with the system that NASA picked which were number one there is no “actual” global temperature and two since climate is a variable there cannot be a real base to measure from. NASA known for its science and engineering expertise back in the day thought it could get around these issues and created a system to do so. First they developed a computer model which took readings from all over the planet and made required adjustments to them which they called homogenization and came up with the estimated global temperature. Second they picked the period 1950 to 1980 (30 years) and averaged the values found in that period and came up with 14.00 degrees Celsius and make that their base. Then they took the calculated monthly temperature and subtracted the base from it which gave them the anomaly. The problem is that both are arbitrary.
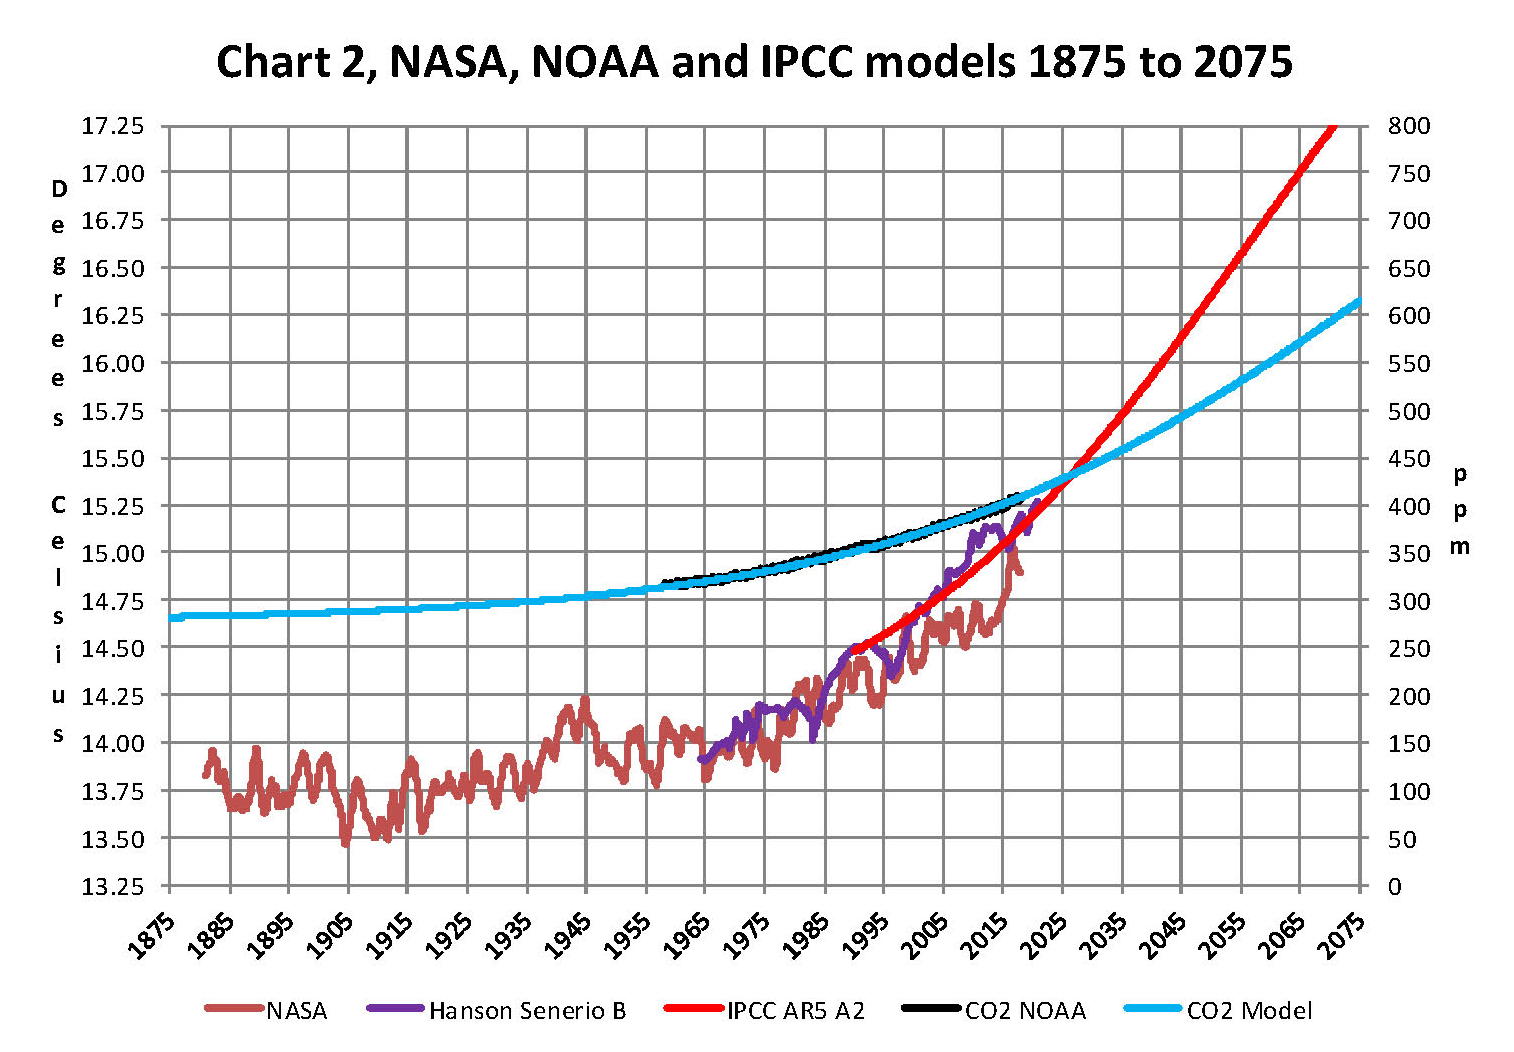
Now that we have a base to work with we are going to add to Chart 1 three things. The first is a trend line of the growth in CO2 since that is according to the government through NASA and NOAA the entire basis for climate change. That plot is superimposed over the black plot of the actual NOAA CO2 values as the cyan line labeled as the CO2 Model and one can see there is a very good fit to the actual NOAA values so there should be no dispute about its validity, and its historically accurate. This plot allows us to make projections to future global temperatures according to the projected level of CO2 . The second added item is James E. Hansen’s Scenario B data, which is the very core of the IPCC Global Climate models (GCM’s) and which was based on a CO2 sensitivity value of 3.0O Celsius per doubling of CO2. This plot is shown here in lavender and is part of a presentation that Hansen showed to congress in 1988 when the UN was about to set up the International Panel on Climate Change (IPCC) and this plot is labeled as Hansen Scenario B which Hansen stated was the most likely to happen based on his 1979 climate theories’. The third item is the current plot of the most likely temperature of the planet based on the growth of CO2 published by the IPCC. This plot is shown in Red and is labeled as IPCC AR5 A2 as that is the table where the data was found. This plot is a GCM computer projection of the planets temperature based on the complex relationships developed on the levels of CO2 by the IPCC primarily though NASS and NOAA.
It can be seen in Chart 2 that the lavender plot and the Hansen plot are very close from 1965 to around 2000 after that, from 2000 to 2014, there is a very large and deviation reaching close to .5 degrees Celsius in 2015, which is not an insubstantial number. Also of note is that there doesn’t seem to be a good correlation between the growth in CO2 and the increase in the planets temperature. The CO2 is going up in a log function and the Temperature was going down until 2015 and then there was a mysterious spike up. That unexplained change in temperature direction appeared to have occurred between 2013 and 2014 and is the subject of this monthly paper.
Next we have Chart 3 which is developed from the raw data from NASS and NOAA as shown in Chart 1. This plot was made first by adding ten years blocks of temperature and CO2 as indicated in the Chart 1 and diving by 120 to give an average for each. Then the average Temperature was divided by the average CO2 to give degrees of temperature increase per PPM of CO2. After that was plotted it appeared that there were two different curves. The first was from block 1965-1974 through block 2004-2014 shown as Black Dots and the second was from block 1995-2004 through block 2005-2017 shown as Black Dashes. When trend lines were added they were both almost perfect fits to the raw data and so you cannot see the data points very well on Chart 2. These blocks were picked to represent the entire period of time where we had both NASA temperature data and NOAA CO2 levels.
On Chart 3 there are two sets of color coded information. The first is Cyan plot and the Cyan box with the equation in it along with the R2 value of 1.0 are for the first series from block 1965-1974 through block 2004-2014. The other is the Red plot and the Red box with the equation in it along with the R2 value of 1.0 which are for the first series from block 1965-1974 through block 2004-2017. We can speculate on how this change happened but it can’t be said that the plot change is not real; however additional data will be required to actually prove that something has changed.
In summary the Cyan data set indicates a diminishing effect of CO2 on global temperature for about 54 years and the Red data set represents an increasing effect of CO2 on global temperature for the past 3 years. Since both data sets have an R2 value of 1.00 the trend lines cannot be in question.
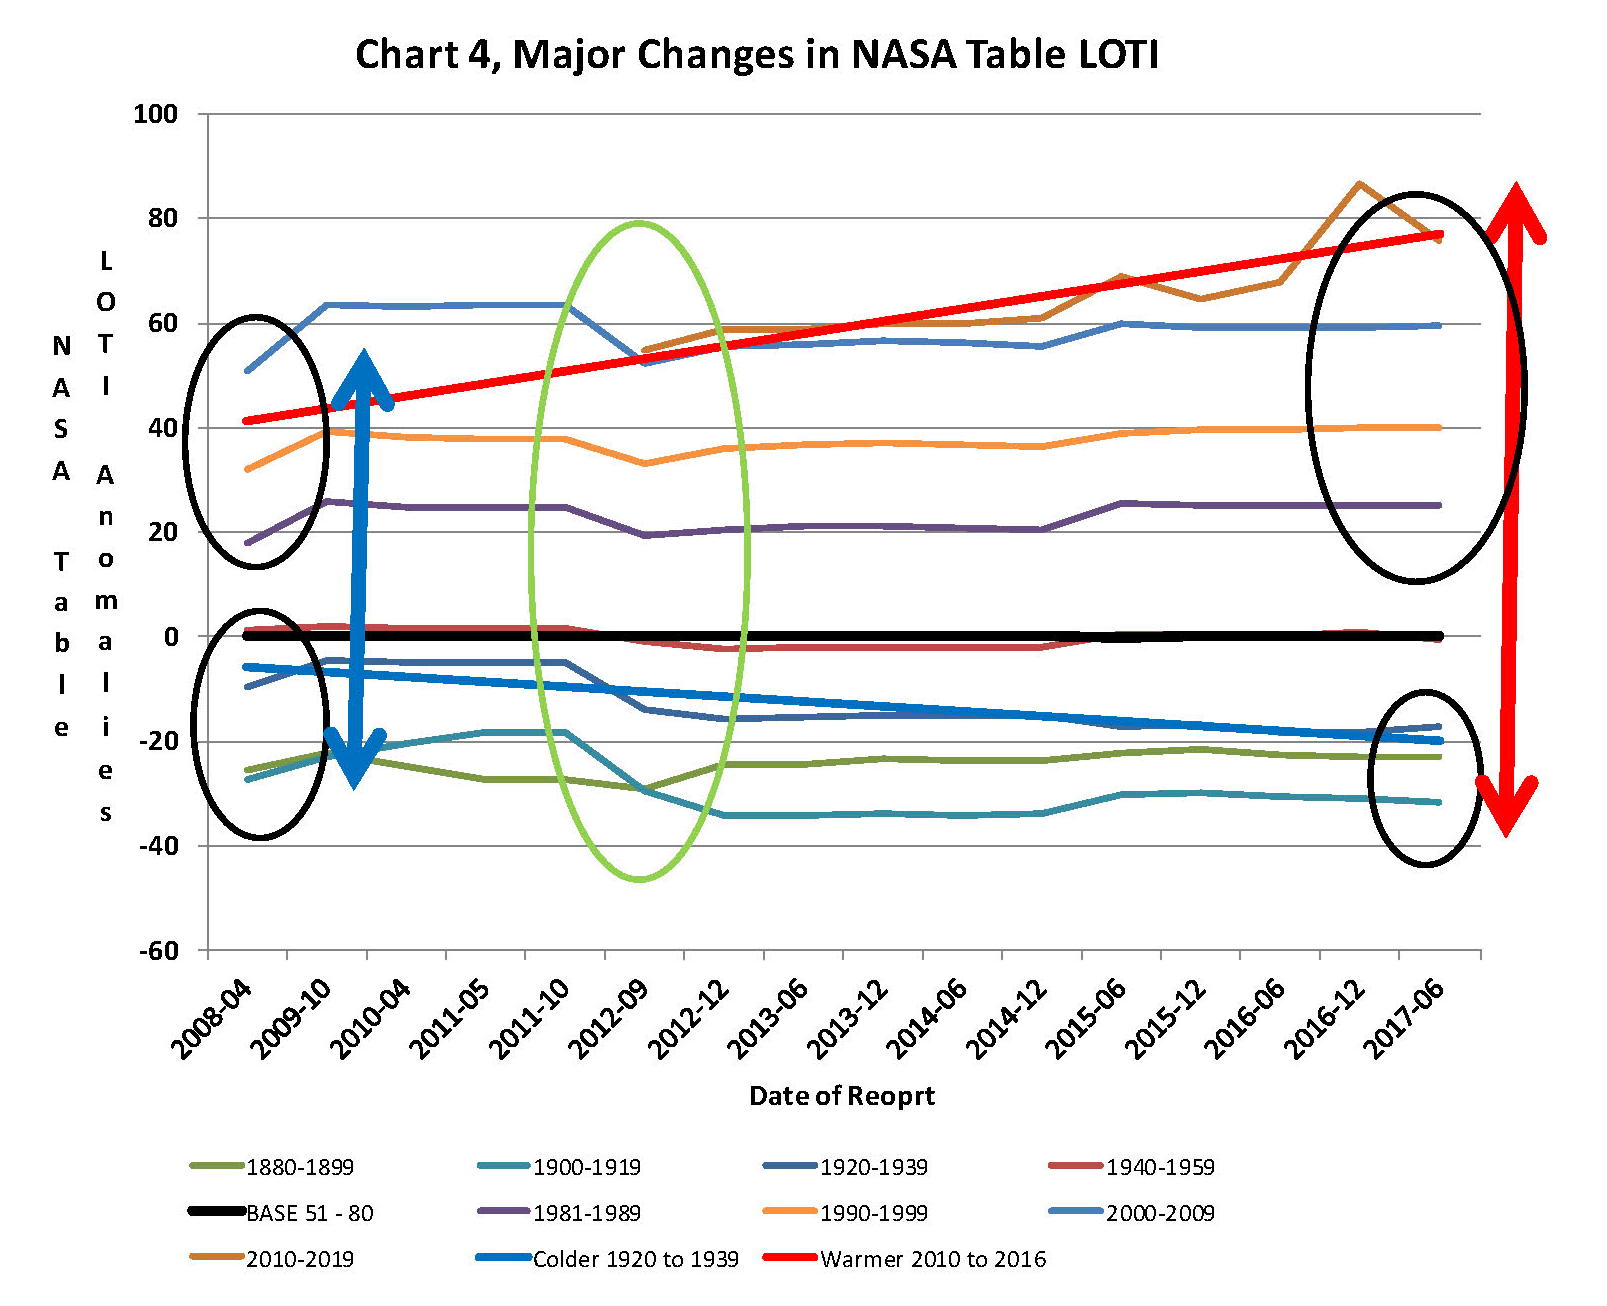
Continuing the analysis of what happened to the NASA data in table LOTI from Chart 3, the following Chart 4 was constructed from the same NASA data. It’s very sad to say but it seems to prove without much doubt that the global temperatures have been manipulated by NASA probably at the request of the federal government such that a case could be made for supporting the COP21 Paris climate conference in December 2015 by showing that the earth was much hotter than it actually was. The dates on the x axis are the date of the NASA LOTI download file. The plots for specific date groupings are set such that one can see what that date range did in each separate NASA download. The proof is shown in Chart 4 below and a discussion will follow below Chart 4 on how Chart 4 was constructed.
At the bottom of Chart 4 is a blue trend line of NASA LOTI temperatures prior to 1950 and starting in2012 the values started going down, getting colder. At the same time the NASA LOTI temperatures from 2012 to the present went up as shown in the red line. There was no change in the base period, black line. This cannot happen with random variables they will cancel each other out; this could only be caused by specific program changes in the process that NASA and NOAA use, in other words it is intentional. So there can be no other reason but an attempt to support the adoption of the Climate accord agreement by the administration, and they were successful as it was agreed to in Paris at COP21.
How this table was constructed is important so a discussion is needed. As stated in the opening paragraph of this paper NASA publishes a table of the estimated global temperature each month as anomalies from a base of 14 degrees Celsius. This table starts with January 1880 and runs to the current date. The new table typical comes out mid-month with the values for the previous month and for November 2017 there were 1,655 values. The process that is used to create this Table is very complex and is called homogenization. What that means is that the entire table is recreated each month and what that also means is that the temperature value for any given month is a variable.
When I realized the extent of that in 2012 I started to save the printouts of the NASA LOTI tables and I went back and found a few of them from when I started this project in 2007. When I started this project what I did is type in all the values from the NASA table into a spreadsheet each month which was a daunting task and I was very happy when NASA started to publish a csv file along with the text of the LOTI data. Then all I had to do is create a routine in excel that would turn the table format into a column format. There are now 65 months in the spreadsheet, when I started this method in 2012 there were maybe only a dozen. The values are residing in the spreadsheet as columns going from left to right so that the individual months are lined up side by side. This makes comparison of months very easy. One note is required here, when I started this model in 07 and for several years thereafter all I was doing is adding the current NASA LOTI current months number to the existing file, a single column, and it never occurred to me that the prior numbers were changing. The past was fixed, so I thought. This was also the way I was entering the NOAA CO2 data which doesn’t change over time.
The original goal was to see if the changes were just random or rounding errors. If that was so then they would wash out over time especially if I grouped the monthly data into blocks. I’ve used both 10 year (120 values) and 20 year (240 values) blocks which would be enough to maintain a fixed number if it was random or rounding. What I found was something quite different after I had a dozen or so columns in the spreadsheet, it appeared that NASA was making the past colder and the present warmer. And the purpose of the previous two Charts 3 and 4 is to show the result. Chart 4 is a bit complex but I have not found a better way to show what happened.
From 1880 to 1960 I used four 20 year blocks. Then I needed the base so there is a 30 year block from 1950 to 1980 and lastly four 10 year blocks from 1980 to the present. The last block is not yet complete as it will run to December 2019. Because the 30 year base block is fixed at 14.0 degrees Celsius there wasn’t much point in charting those individual yearly values even though there was some minor movement in those numbers. That raises an interesting issue for how can the base numbers not change and all the other numbers from 1880 to 2017 can change each month? A note, for each data set of years the plot on Chart 4 should be a straight line from left to right; very minor fluctuation would be OK. For example the plot for 1930 to 1949 (hidden behind the black plot) is what would be normally expected. This is the only plot that doesn’t show major manipulation.
In the four data sets in the 1880 to 1940 blocks in Chart 4 all have moved down probably about a .25 degree Celsius which is not insgnificant. So the bottom line is that NASA made all the values from 1880 to 1940 colder by an average of a quarter of a degree Celsius. So that alone accounts for a high percentage of the supposed global warming that NASA shows. From 1980 to 2009 the data change appears to add another .1 degrees Celsius making the apparent differential between data from early 00’s to the present about .35 degrees greater than it was before 2009. That is not random that is a major change and clearly shows manipulation. I would probably never had caught this is if I hadn’t put the values in column format. Looking at all the data from 2008 to 2014 we find that around 2008 NASA showed that the planet had warmed about .75 degrees, Blue double arrow, from the 19th century. Then in 2014, four years later NASA showed that the planet had warmed about .95 degrees Red double arrow from the 19th century. However it gets a worse after that.
The change started in 2012, Green Oval, and Global temperature jumped almost a quarter of a degree by December 2015 just as the COP21 conference was in session. The temperatures kept going up with an eventual increase in global temperature of about 1.2 degrees Celsius in late 2016. At that point with the pressure off NASA appears to be erasing what they did as the global temperatures have now started back down. I’m not sure how many know of this blatant manipulation but it is serious. This is not science.
Now we need to consider other factors than CO2 on Climate change. The fault that occurred in the work that was done in the 1980’s was in assuming that there was an optimum or constant global temperature and therefore any change that was being observed was from the increasing amount of CO2 in the atmosphere. There may have been correlation but it was never proved that there was causation (high R2 value) between CO2 and global temperatures; Chart 3 clearly shows there is not. With that assumption, which limited options, we moved from true science into the realm of political science. True science has an open mind and finds relationships that work in matching observations with predictions. Political science changes history and/or facts to match the desires of the politicians. Since the politicians control the money political science is what we get; which means that what we get may not be technically correct.
A decade ago when I started looking at “climate” change the first thing I did was look at geological temperature changes since it is well known that the climate is not a constant; I learned that 53 years ago in my undergrad geology and climatology courses in 1964. The next paragraph explains currently observed patterns in climate related to this subject and is historical accurate.
Ignoring the last Ice Age which ended some 11,000 years ago when a good portion of the Northern hemisphere was under miles of ice the following observations give a starting point to any serious study on the subject of climate. First, there is a clear up and down movement in global temperatures with a 1,000 some year cycle going back at least 3,000 to 4,000 years; probably because of the apsidal precession of the earth’s orbit of about 20,000 years for a complete cycle. However about every 10,000 years the seasons are reversed making the winter colder and the summer warmer in the northern hemisphere. 10,000 years from now the seasons will be reversed again. Secondly, there are also 60 to 70 year cycles in the Pacific and the Atlantic oceans that are well documented. These are known as the Atlantic Multi Decadal Oscillations (AMO) in the Atlantic and as La Nina and El Nino in the Pacific. Thirdly, we also know that there are greenhouse gases such as carbon dioxide that can affect global temperatures. Lastly the National Academy of Sciences (NAS) estimated that carbon dioxide had a doubling rate of 3.0O Celsius plus or minus 1.5O Celsius in 1979 when there were only two studies available and one for sure and maybe both were not peer reviewed.
The result of looking objectively at the three possible sources of global temperature changes was a series of equations based on these observations that when added together produced a sinusoidal curve that seemed to follow NASA published temperatures very closely when first developed in 2007, and modified a few years later when it was found the short and long cycles were related to multiples of Pi. Since this curve was based on observed temperature patterns it was called a Pattern Climate Model (PCM) which has been described in previous papers and posts on my blog and since it is generated by “equations” many assume it is some form of least squares curve fitting, which it is not. It does seem to be related to ocean currents where the bulk of the planet’s surface heat is stored.
Chart 5 shows the PCM a composite of two cycles and CO2. There is a long trend, 1036.7 years with an up and down of 1.65O Celsius (.00396O C per year) we in the up portion of that trend. Then there is a 69.1 year cycle that moves the trend line up and then down a total of 0.29O Celsius and we are now in the downward portion of that trend (-.01491O C per year), which will continue until around ~2035. Lastly, there is CO2 currently adding about .0079O Celsius per year so together they all basically wash out at -.0039O C per year, which matches the current holding pattern we were experiencing until 2014. After about 2035 the short cycle will have bottomed and turn up and all three will be on the upswing again duplicating what was observed in the 1980’s. Note: the values shown here are only representative from what is in the model.
When using a 12 month running average for global temperatures up until 2014 the PCM model was within +/- .01 degrees of what NASA was publishing in their LOTI table since the early 1960’s as shown in Chart 5. Further the back projection of the PCM plot matched historical records and global temperatures going back past the time of Christ. It should also be considered that geologically CO2 levels have reached levels many times that of the current 400 ppm without destroying the planet so the current hysteria over the current very small numbers can only be explained by political science not real science.
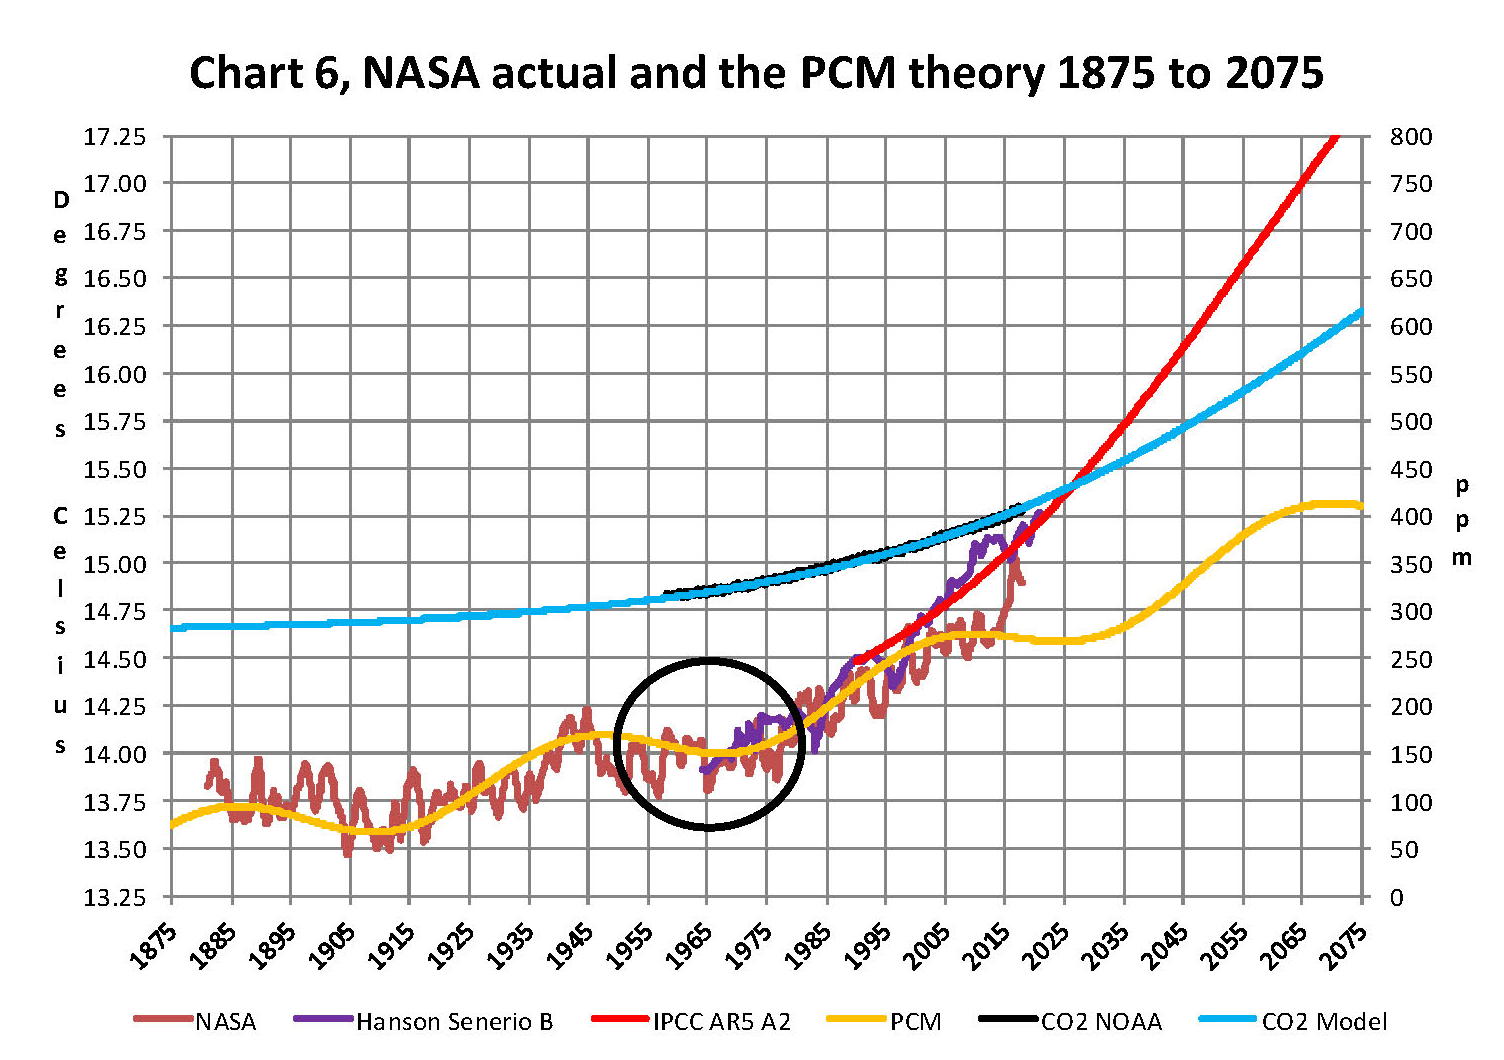
The nest step in this analysis is to put all of the known data and projections into Chart 6 which contains: NASA’s temperatures plot, NOAA’s CO2 plot, the CO2 model plot, the PCM model plot, Hansen’s Scenario B plot, and lastly the IPCC AR5 A2 global temperature plot. With that done we can look at the results and try to make some sense of what is going on with the various arms of the federal government that are promoting that we tax carbon based fuels to eliminate them since they are responsible for the global temperature level going up. As previously stated when the government pours money into the sciences the sciences respond with technical papers the support the governments views, this is what I call political science verses real science as was done prior to the 1980’s; money talks and BS walks as everyone on the street knows.
Chart 6 shows a good overview and contains no data manipulation and the only change that was made was to convert the NASA anomalies back to degrees Celsius to make it more readable to lay people. This is only a change in units and has no bearing on the look. We also need to understand the NASA homogenization process and its relationship to the 30 year base period. The portion in the black circle contains the NASA base period of 14.00 degrees Celsius and the reason it’s brought up here is that the Homogenization process causes the global temperatures to move around since the entire data base all the way back to 1880 is recalculated each month. But since the base has to stay at 14.00 degrees Celsius the program must be set to not allow changes in that period of time. I’m sure the programmers have fun with that. Prior work here has shown how this creates a teeter totter effect with the data plots, some of which have recently been significant.
Next Chart 7 looks at the period from 2010 to 2020 so we can see where a change in CO2 of only a few ppm has caused a major change in the global temperature way beyond anything previously shown in any published NASA data. There are two black ovals on Chart 7 one at the top of Chart 7 which is a black oval around the CO2 levels from 2012 to 2016 and part of 2017 and it’s very obvious that there has been very little change, maybe 7 ppm or about 1.9%. Then at the bottom of Chart 7 is another black oval around the NASA global temperature levels for the same period and its very obvious that there has been a large change, almost .50 degrees Celsius or about 3.1%. There has never been such a large increase in temperature from such a small increase in CO2. By contrast the previous comparable period of the last part of 2010 through 2013 shows about the same increase for CO2 at 1.1% but no increase for global temperature but actually small decrease.
Clarification is needed here as the plot seems to show the jump in temperature in 2016 not 2015; this is a result of the large jump in temperature shown by NASA. Since we are using a 12 month moving average and the increase occurred in only a few months it actually shifted the curve into 2016. The raw data for December 2015 showed the temperature at 15.12 degrees Celsius compared to December 2014 where it was 14.78 degrees Celsius. The actual peak was in February 2016 at 15.35 degrees Celsius. With the global temperature over 15.0 Celsius at COP21 the climate accord was approved and the manipulation was a success. After COP21 the need for Fake Warming was no longer needed and so we are now seeing a downward trend developing.
In summary, the IPCC models were designed before a true picture of the world’s climate was understood. During the 1980’s and 1990’s CO2 levels were going up and the world temperature was also going up so there appeared to be correlation and causation. The mistake that was made was looking at only a ~20 year period when the real variations in climate all move in much longer cycles of decades and centuries. Those other cycles can be observed in the NASA data but they were ignored for some reason. By ignoring those actual geological trends and focusing only on CO2 the Global Climate Models will be unable to correctly plot global temperatures until they are fixed. Also the temperature data from 1850 to 1880 was dropped for some reason as it showed a lower temperature that supported the PCM cycle shown in this paper.
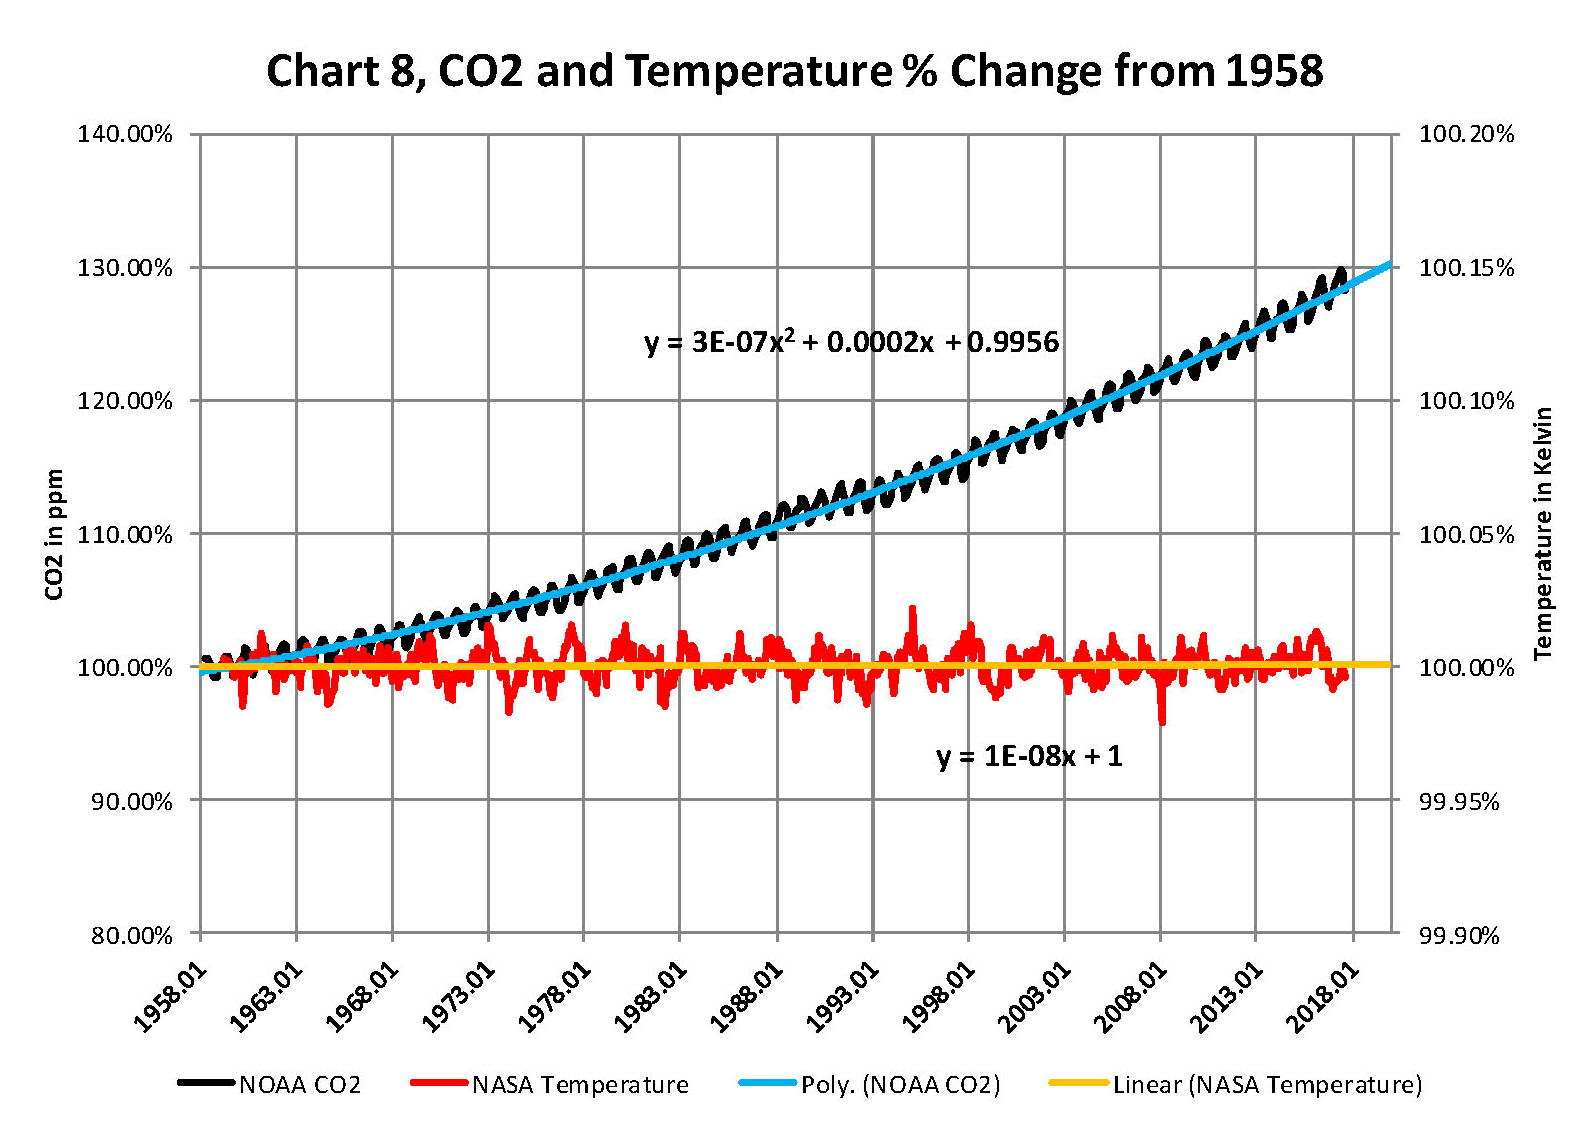
In summary we have Chart 8 which shows why CO2 is not increasing the temperature of the planet by any meaningful amount. The problem, intentional or not, goes back to physics and how we show information. It’s critical that when we talk to nonscientists that information is properly displayed. And nowhere is this more important than when we are discussing temperature. When we talk about weather and local temperatures its going be in Celsius (C) in the EU or degrees Fahrenheit (F) in America e.g. for the base temperature that NASA uses it’s 14.00 C or 57.20 F; but these are both relative measures and do not tell us how much heat (thermal energy) is there. To know that we must use Kelvin (K) and that would be 287.150 K and all three of those numbers 14.00 C, 57.20 F, and 287.150 K are exactly the same temperature, just using a different base. But if the current temperature is 15.00 C that is a 7.1% increase in C, a 3.1% increase in F and a .35% increase in K; so which one is real? The answer is .35% because Kelvin is the only one that measures the total energy!
To show this graphically Chart 8 was constructed by plotting CO2 as a percentage increase from when it was first measured in 1958 the Black plot, the scale is on the left and it shows CO2 going up about 28.5% by November of 2017. That is a large change as anyone would agree. Now how about temperature, well when we look at the percentage change in temperature using the proper units Kelvin we find that the changes in global temperature are almost unmeasurable. The red plot, also starting in 1958, shows that the thermal energy in the earth’s atmosphere has varied by less than +/- .17%; while CO2 has increased by 28.3% which is over 80 times that of increase in temperature. So is there really a problem here?
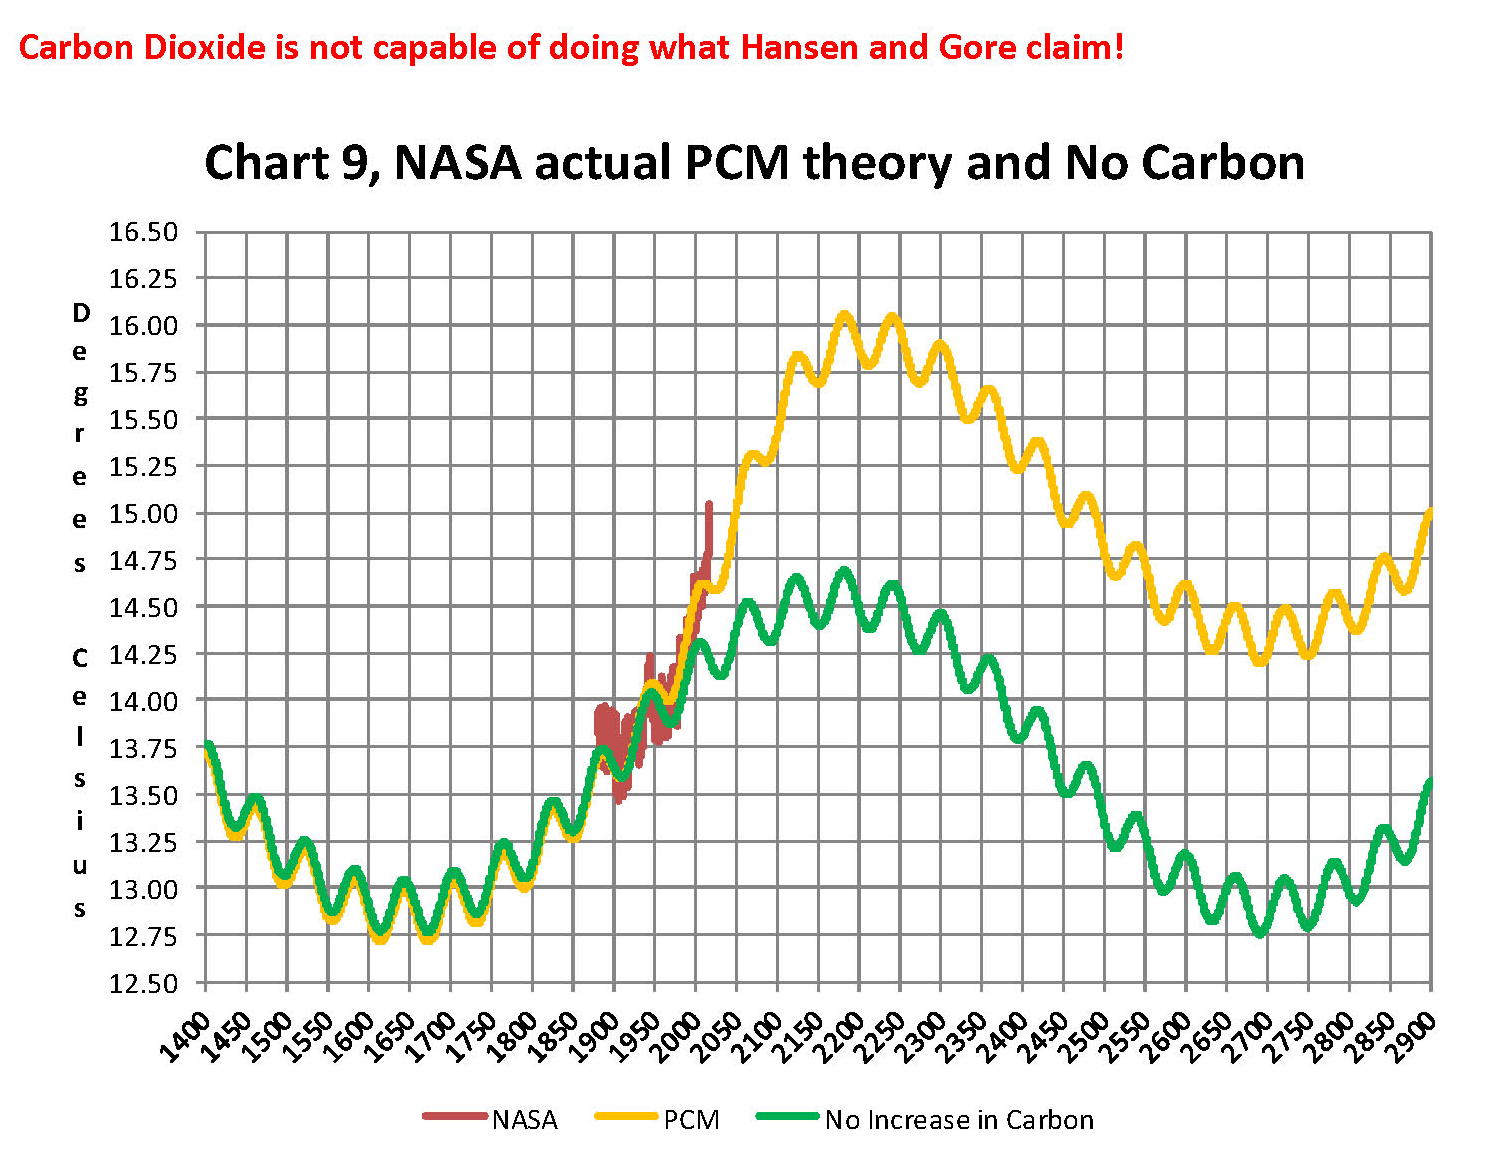
Lastly, Chart 9 shows what a plot of the PCM model, in yellow, would look like from the year 1400 to the year 2900. This plot matches reasonably well with recorded history and fits the current NASA-GISS table LOTI data, in red, very closely, despite homogenization. I do understand that this PCM model is not based on physics but it is also not some statistical curve fitting. It’s based on observed reoccurring patterns in the climate. These patterns can be modeled and when they are, you get a plot that works better than any of the IPCC’s GCM’s. If the real conditions that create these patterns do not change and CO2 continues to increase to 800 ppm or even 1000 ppm then this model will work well into the foreseeable future. 150 years from now global temperatures will peak at around 15.750 to 16.000 C and then will be on the downside of the long cycle for the next ~500 years.
The overall effect of CO2 reaching levels of 1000 ppm or even higher will be about 1.50 C which is about the same as that of the long cycle. The Green plot on Chart 9 shows the observed pattern with no change in CO2 from the pre-industrial era of ~280 ppm. CO2 cannot affect global temperatures more than 1.500 C +/- no matter what the ppm level of CO2 is. The reason being that the CO2 sensitivity value is not 3.00 per doubling of CO2 but less than 1.00 C per doubling of CO2 as shown in more current scientific work and it’s a logistics curve not a log curve.
The purpose of this post is to make people aware of the errors inherent in the IPCC models so that they can be corrected.
The Obama administration’s “need” for a binding UN climate treaty with mandated CO2 reductions in Europe and America was achieved as predicted at the COP12 conference in Paris in December 2015. To support this endeavor NASA was forced to show ever increasing global temperatures that will make less and less sense based on observations and satellite data which will all be dismissed or ignored. Within a few years the manipulation will be obvious even to those without knowledge in the subject, but by then it will be to late the damage to the reputation of science will have been done.
In closing keep this in mind. The current panic generated by the government using political science is that the current global temperature of around 15.0O Celsius is an increase of 7.14% from the 1960’s when the global temperature was 14.0O Celsius; and that does seem like a lot. However those views would be in error as the actual increase in thermal energy, as measured by temperature, would be only .35% because we must use Kelvin not Celsius when working with heat energy. When we use kelvin the temperature goes from 287.15O K to 288.15O K which is only .35% not 7.14% about 1/20 of what is implied by the IPCC. What the IPCC shows is not technically wrong as much as it is extremely misleading to anyone without a very strong science background.
Sir Karl Raimund Popper (28 July 1902 – 17 September 1994) was an Austrian and British philosopher and a professor at the London School of Economics. He is considered one of the most influential philosophers for science of the 20th century, and he also wrote extensively on social and political philosophy. The following quotes of his apply to this subject.
If we are uncritical we shall always find what we want: we shall look for, and find, confirmations, and we shall look away from, and not see, whatever might be dangerous to our pet theories.
Whenever a theory appears to you as the only possible one, take this as a sign that you have neither understood the theory nor the problem which it was intended to solve.
… (S)cience is one of the very few human activities — perhaps the only one — in which errors are systematically criticized and fairly often, in time, corrected.
In stark contrast to the USA which is heading for LOWER taxes which you say will invigorate the economy,the SNP Government in Scotland has announced HIGHER income taxes “to protect public services from the cuts being imposed by the Tories.”
Clearly the SNP Government is unconcerned that its tax policies make Scotland the highest taxed part of the UK.
Interestingly the SNP approach to taxation confirms three of your views:
1.Politicians keep lowering the definition of “the rich.”Earlier this year Derek Mackay,SNP Finance Secretary,an apparatchik with no financial background,described people in Scotland earning £43,000 a year as “rich.”However in his December Budget ,higher taxes start to take effect on people earning over £33,000 a year, according to the SNP, while The Telegraph claims that people in Scotland earning as little as £26,000 a year will pay more income tax than in the rest of the UK.
2.Faced with a choice of cutting public spending or increasing taxes politicians will invariably choose the latter.The annual cost to the Scottish Government of subsidizing free prescriptions is £1 billion.Of course means testing could substantially reduce the cost but this expenditure is regarded as sacrosanct because it is an SNP flagship policy.
3.The economic illiteracy of politicians.The SNP Government has pushed through these tax increases despite the fragile state of the Scottish economy where retail spending growth over the past eight years has averaged only 0.5% against a UK average of 2.2%.Scottish economic growth has also lagged the UK in recent years.It is transparently obvious to anyone with common sense that these tax increases will have serious consequences for the Scottish economy.
REPLY: Yes, the SNP does not get it. They are headed for a major political disaster. They fail to get what they are doing is not limited to transferring the wealth from the rich to the poor, but from the people to government employees. They will pay the price at the next election.
QUESTION: Mr. Armstrong; What about the Chinese housing bubble. Why has this been so different in many ways?
IX
ANSWER: The primary difference is the simple fact that Chinese cannot take their money out of the country under the capital controls. Consequently, the property market has become their bank account. They have been moving from public to private assets in China as well. This is starkly different from housing bubbles in the West where it was not a capital shelter due to capital controls
COMMENT: I think the danger for Canada is not Quebec leaving because they get 11 billion dollars a year given to them by the federal government, it is the provinces paying the bills that are more likely to leave, western Canada in general but especially Alberta which has been getting hosed. As you noted before resentment is what is produced by giving billions of mostly western Canadian dollars to eastern Canada each year. Now Trudeau is attacking the oil industry that pays the bills, the man is insane and destroying Canada.
RB
REPLY: I am fully aware that the Separatist movement is rising very rapidly in Canada and it is the West v East. Trudeau’s socialist agenda is again imposing the philosophy of class warfare upon the whole of Canada. This only inspires uprising and discontent as we are seeing in Europe. The very same issues were behind the Trump Revolution. The media keeps desperately trying to overthrow Trump as president to save the socialist agenda in the USA.
Understand that this is the death of socialism. As it declines as an economic philosophy, those who are diehard leftists will do whatever they can to take power back.
To put a fine point on the anticipatory fireworks for mid-January, let us remind ourselves of what can be anticipated when everyone gets back to DC from the holiday break.
Following a week of growing pressure and sunlight, last week Asst. FBI Director Andrew “Andy” McCabe used The Washington Post -the PR transmission media of the Deep State Intelligence Community- to announce his career saving terms. Essentially McCabe presented the deal that he would leave office in March, in exchange for no returning fire.
President Trump, immediately spotting the intent of the public resignation announcement, responded by saying on Twitter: “NO DEAL“.
On January 15th, 2018, the Department of Justice Office of Inspector General Michael Horowitz will deliver approximately 1.2 million pages of documentation and evidence gathered in the year-long investigation into the politicization of the DOJ and FBI, by senior leadership and upper-level career leadership lawyers and bureaucrats.
IG Horowitz, having utilized the OIG’s vast 500+ investigative agents, is giving that preliminary evidence -in advance of pending full report- to the congressional committee in charge of DOJ/FBI oversight: House Judiciary Chairman Bob Goodlatte. –OUTLINED HERE–
So by mid-January the House Judiciary Committee will have massive investigative documentation surrounding Andrew McCabe, James Comey, Loretta Lynch, Sally Yates, and all of the top-tier team members around them for all of their principle activity throughout the past few years; with emphasis on 2016.
Put another way, Andrew McCabe, is going to be in FULL SUNLIGHT on or around January 15th, 2018, for any misconduct.
That explains the transparent reason for McCabe offering terms. However, the content of that year-long investigation is also the transparent reason for President Trump refusing McCabe’s terms.
In addition to McCabe, and depending on how well they have covered their political tracks, James Comey, Loretta Lynch, Sally Yates, and all of the top officials -lawyers mostly- within the FBI and DOJ will be part of that investigative release.
Depending on IG release content, there will also be downstream officials who will have likely taken action, or positioned themselves with prior public releases of intelligence information (ie. narratives), containing historic support toward the actions taken by those top-tier FBI and DOJ officials.
Those downstream Deep State positions include CIA John Brennan, DNI James Clapper, and all of the officials contained in known communication therein:
In addition to Horowitz, and generally overlooked by media, there has been another internal FBI and DOJ task force quietly gathering information over the Intelligence Community, including those qualified to receive “classified intelligence” within congress, since July/August 2016.
There’s no doubt the “Leak Task Force” has been monitoring all of the committee actions and releases by people they are suspecting of leaks. There’s a solid argument to be made that several leaks that led to false media reporting were actually part of task-force sting operations intended to expose those leakers.
Thankfully, no-one was paying much attention to either the IG investigation or the leak task-force until recently. The MSM completely overlooked their existence until early December reports on FBI conduct indicated the IG had not only collected information, but the investigative discoveries actually led to damage-control reactions by the DOJ and FBI.
Examples of damage-control include reassignments of: FBI counterintelligence agent Peter Strzok; FBI/DOJ lawyer, Lisa Page; DOJ Deputy Attorney, Bruce Ohr; and FBI Chief Legal Counsel James Baker.
These moves, especially the reassignment of FBI’s top lawyer James Baker, indicate the severity of the information gathered by the Inspector General. These are not insignificant personnel shifts. They indicate a much bigger issue is within the IG investigation that currently visible. Hence, current reactions from former officials begin to make sense.
♦Release #2 outlined the depth of FBI Agent Strzok and FBI Attorney Page’s specific history in the 2016 investigation into Hillary Clinton to include the changing of the wording [“grossly negligent” to “extremely careless”] of the probe outcome delivered by FBI Director James Comey.
♦Release #3 was the information about DOJ Deputy Bruce Ohr being in contact with Fusion GPS at the same time as the FISA application was submitted and granted by the FISA court; which authorized surveillance and wiretapping of candidate Donald Trump; that release also attached Bruce Ohr and Agent Strzok directly to the Steele Dossier.
♦Release #4 was information that Deputy Bruce Ohr’s wife, Nellie Ohr, was an actual contract employee of Fusion GPS, and was hired by F-GPS specifically to work on opposition research against candidate Donald Trump. Both Bruce Ohr and Nellie Ohr are attached to the origin of the Christopher Steele Russian Dossier.
♦Release #5 was the specific communication between FBI Agent Strzok and FBI Attorney Page. The 10,000 text messages that included evidence of them both meeting with Asst. FBI Director Andrew McCabe to discuss the “insurance policy” against candidate Donald Trump in August of 2016.
Inspector General Michael Horowitz Revenge Motive – Outlined Here
I have created this site to help people have fun in the kitchen. I write about enjoying life both in and out of my kitchen. Life is short! Make the most of it and enjoy!
This is a library of News Events not reported by the Main Stream Media documenting & connecting the dots on How the Obama Marxist Liberal agenda is destroying America

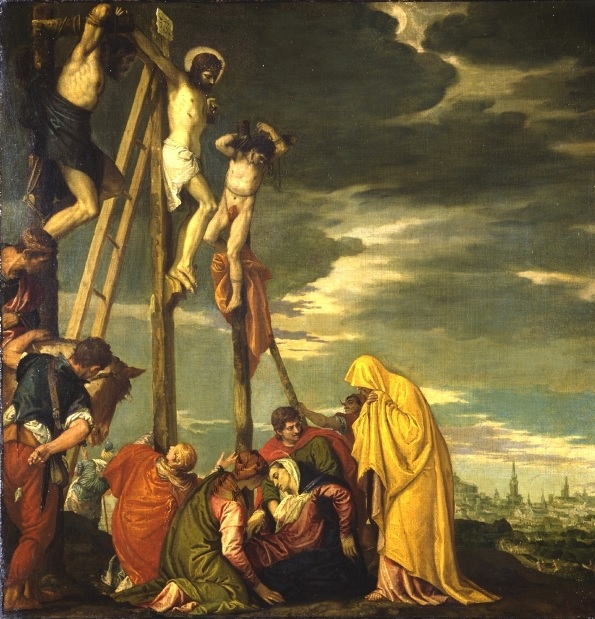
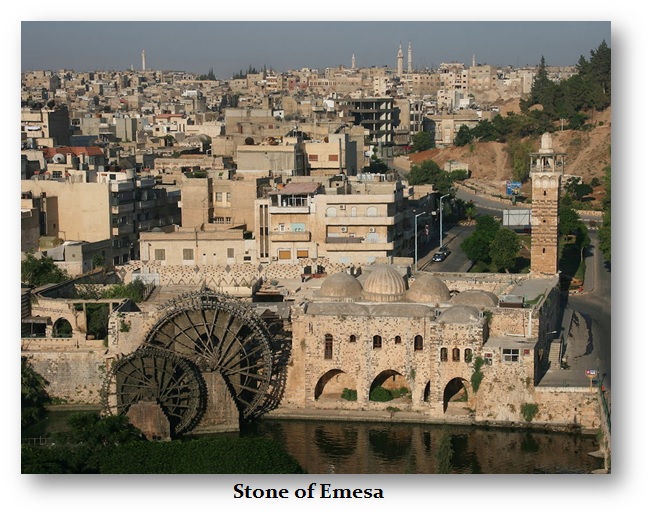
 ANSWER: Jesus’ crime was really sedition and not blasphemy. The high priests may have seen this as blasphemy, but Jesus would never have been put to death by the Romans for such a local issue. The Romans practiced freedom or religion. They allowed the provinces that they had conquered to retain their own gods. Even the Roman Emperor Elagabalus (218-222AD) was an heir to the throne being of the Severian House. He had been a priest in Emesa of the sun god, which is the modern city of Homs in Syria today. He worshiped a black meteor that had fallen from the sky and a temple had been built for this stone of god (see above). When Elagabalus became emperor, he carried the Stone of Emesa to Rome and built a temple there. After he was murdered, the Romans respectfully returned the stone to Syria as to not offend any god. As for the Black Stone of Emesa is concerned, it was most likely smashed to pieces when the temple was converted into a Christian church at some point during the 4th Century AD by the Byzantines.
 Crucifixion was an execution that was severe and reserved for political crimes, not common thieves. The more common method of execution in the Roman Empire was by strangling. Even the leader of the Gauls, Vercingetorix, who was an adversary was put on display in a triumph of Julius Caesar and then strangled – not crucified. This was simply a captive of a conquered nation or group who had not been under Roman rule and thus did not warrant crucifixion.