The U.S. media are in ideological alignment with blue state governors and congressional democrats to hype COVID-19 panic as a method to keep the economy from reopening. To advance this narrative the crowds during mass protects they approve of are ignored; but any crowd at an event they do not align with is used to push panic. Everyone can see this.
The New York manufacturing index shocked everyone earlier today showing a strong rebound. The index “unexpectedly” surged 48 points in June surprising all economic forecasters. Meanwhile, National Economic Council Chairman Larry Kudlow appears on Fox News to discuss the dynamics.
.
As Kudlow notes, President Trump is looking to use any potential phase-4 legislative package to inject a massive ‘America First’ boost, via tax incentives for manufacturing business interests to return to the U.S. The administration does not see a need for additional direct spending, bailouts, or continued payments; however, this is an opportunity to provide tax incentives to boost U.S-centric economic activity.
It’s important to remember the dynamic of U.S. multinationals (Wall St), and how many of them align with Democrat and media efforts to hold down the U.S. economy. There are trillions at stake.
Wall Street multinationals are attempting to retain their prior investments in China and southeast Asia; the last thing they want is an incentive program (expensing, tax relief etc) putting pressure on them to return jobs and manufacturing to the United States. The multinationals prefer their decades-long built globalist supply chains that they paid congress to create.
Because of the specific interests, and the ideology, the multinationals, U.S. media, the resistance movement and democrat politicians are in alignment to support Wall Street against President Trump’s America-First agenda.
The singular force fighting for the benefit of Main Street USA is President Trump and his economic war council. In essence the Trump administration is in a battle against all the global interests, foreign and domestic, who are determined to keep the U.S. economy from expanding and getting stronger.
These are all simply different battles, with varying levels of escalation, in an economic policy war that has been waged for over three years. President Trump is fighting to deconstruct a globalist system created over decades. We are now at the apex of the battle where no political weapons are out-of-bounds… including the weaponization of viruses; and the political deployment of highly controlled racial reserve units.
NEW YORK (Reuters) – Manufacturing activity in New York State stabilized unexpectedly in June after three months of broad weakness brought on by coronavirus-related business shutdowns, and companies’ six-month outlook shot to a decade high, the New York Federal Reserve said on Monday.
The regional Fed bank’s Empire State Manufacturing Index surged 48 points to a reading of negative 0.2 from negative 48.5 in May. Economists polled by Reuters were looking for a reading of negative 29.8, according to the survey median. (link)
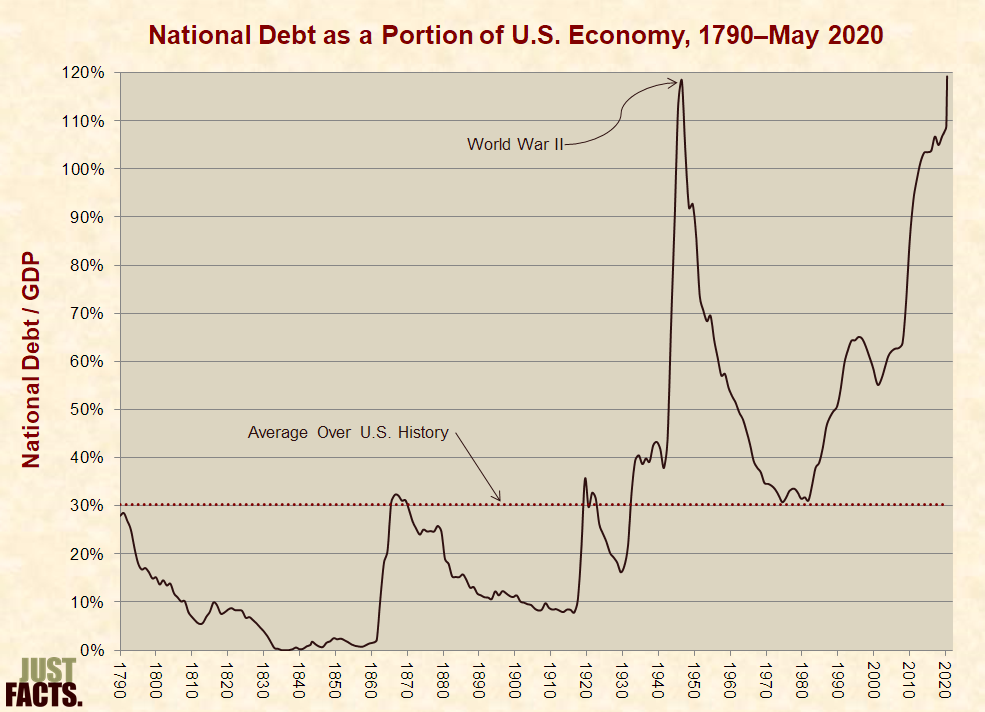
The U.S. national debt has just reached 120.5% of the nation’s annual economic output, breaking a record set in 1946 for the highest debt level in the history of the United States. The previous extreme of 118.4% stemmed from World War II, the deadliest and most widespread conflict in world history.
Today’s unprecedented debt-to-economy ratio—which is economists’ primary measure of government debt—includes $2.5 trillion in new debt since the outset of the Covid-19 pandemic. However, it doesn’t account for the vast bulk of economic damage inflicted by government-mandated business shutdowns, which will soon make the debt ratio significantly larger by decreasing its denominator. Although this decline has already begun, most of it is not yet reflected in the official data on the size of the U.S. economy.
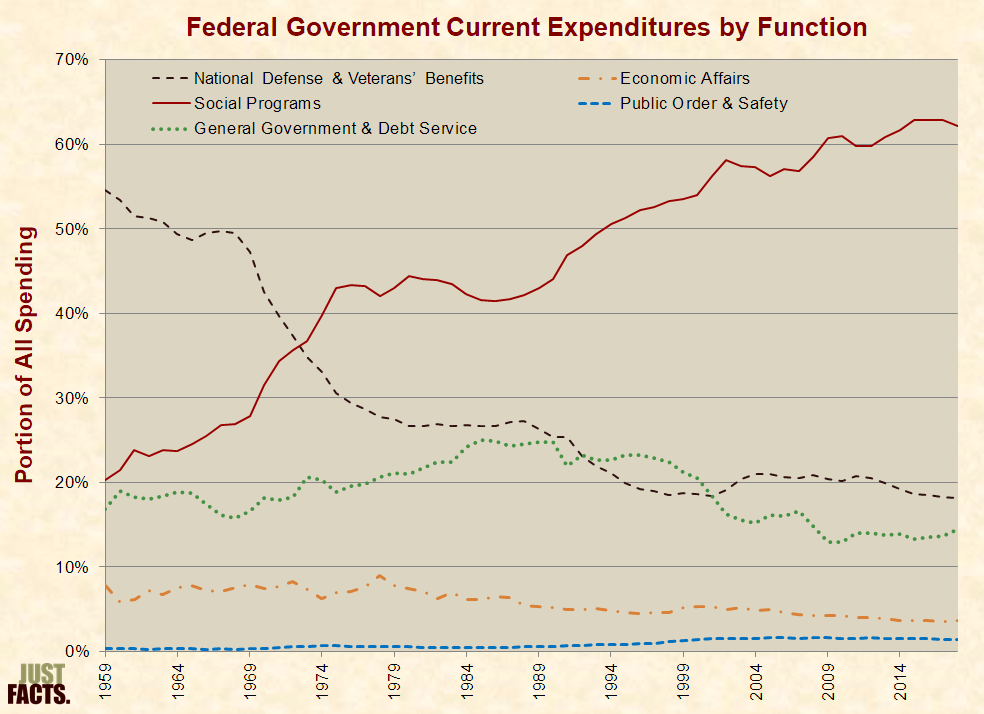
Unlike the debt from World War II—which rapidly fell once the war ended—the modern national debt has been on a steep upward path for decades. The main driver of this has been increased government spending on social programs, which grew from 20% of federal expenses in 1959 to 62% in 2018. Without substantial reforms, social spending will increase furtherand drive the debt to levels that dwarf the debt from World War II.
Contrary to claims that government debt isn’t a major problem, a broad range of facts show that it can have serious negative consequences, such as lower wages, weak economic growth, increased inflation, higher taxes, reduced government benefits, or combinations of such results. These, in turn, impair people’s quality of life and can reduce their life expectancy. Some of these impacts may have already begun.
Measuring the National Debt
The U.S. Treasury’s official figure for the debt of the federal government on June 8, 2020 is $25,960,547,920,986. This measure of raw debt has grown through most of the nation’s history, but it overstates the scale of debt over time because it doesn’t account for inflation, population increases, or economic growth. These factors allow governments to carry more debt with less harm than if their economies were smaller.
To adjust for such factors across nations and over time, economists and government agencies commonly measure government debt as a portion of each nation’s annual economic output, or gross domestic product (GDP). This accounts for varying population sizes, some effects of inflation, and the capacity of governments to service their debts.
Over the course of U.S. history, the government’s debt-to-GDP ratio has averaged 30.3% and has stayed around or below this level except for a massive spike from World War II and during the modern era. The WWII record of 118.4% held for the past 74 years but was toppled on May 22, 2020 when it reached 118.5%. By the end of May, it had reached 119.5%, or four times its average over the nation’s history:
The debt continued growing in early June and reached 120.5% by the 8th day of the month. These debt-to-GDP figures are based on the latest available yearly data from the U.S. Treasury and the U.S. Bureau of Economic Analysis, the federal agency that calculates official GDP figures.
Covid-19 Responses & Impacts
From the day that the World Health Organization declared Covid-19 a pandemic (March 11) through June 8th, the U.S. national debt rose by $2.5 trillion or 11.5 percentage points of GDP. This was mainly due to:
fourfederalbillspassed to address the pandemic and buffer the economic fallouts of business shutdowns imposed by state governments. These will cost about $2.5 trillion, or an average of $19,000 for every household in the nation.
lost tax revenue from business shutdowns.
debt increases that were already baked into the federal budget for 2020.
Because the latest available GDP data is for the first quarter of 2020, and the business shutdowns didn’t begin until mid-March, they affect only half a month out of a year of data. Thus, the shutdowns have a relatively small effect on the latest annual GDP figure, reducing it by about 0.4%.
Also in response to Covid-19 and the shutdowns, the Federal Reserve created trillions of dollars in new money to purchase federal government debt and other financial assets. The effects of such policies don’t necessarily manifest in the national debt but can impact people in other ways.
Systemic Drivers
As with the recent debt increases from the Covid-19-related laws, the national debt has been mainly driven for the past 60 years by social spending, or government programs that provide healthcare, income security, education, nutrition, housing, and cultural services. These programs have grown from 20% of all federal spending in 1959 to 62% in 2018:
Under current laws and policies, the Congressional Budget Office projects that almost all future growth in debt will be due to increased spending on social programs and interest on the national debt.
Nonetheless, many media outlets and politicians have blamed the skyrocketing debt on military spending. In reality, however, military spending has plummeted from 55% of all federal expenses in 1959 to 18% in 2018. These are comprehensive figures that include standard military expenses, supplemental appropriations like those enacted for the wars in Iraq and Afghanistan, and veteran’s benefits.
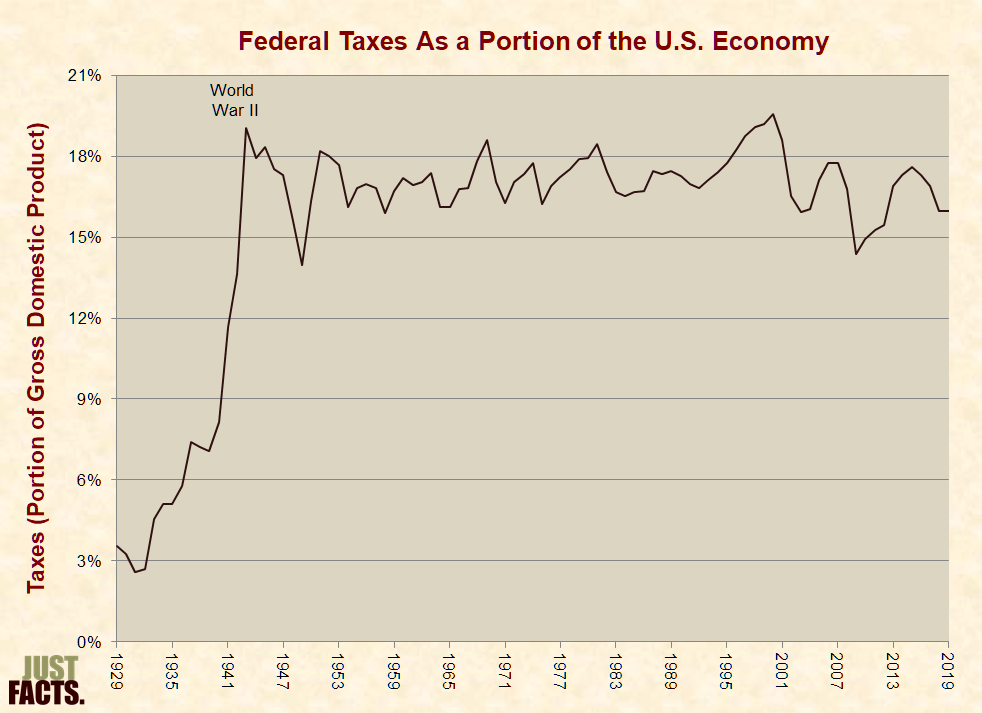
Another commonly blamed cause of debt increases is tax cuts, but the fact is that federal tax revenues have stayed roughly level as a portion of GDP for the past 80 years. They commonly declined during recessions and rebounded during recoveries, but the long-term trend has been flat since the 1940s. Before that, tax levels rose dramatically during the Great Depression/New Deal and World War II:
From the era of John F. Kennedy in the 1960s up through Donald Trump, various Congresses and Presidents have enacted a range of tax cuts. However, tax levels have stayed generally stable due to tax increases and a phenomenon called “bracket creep.” This automatically raises people’s tax rates over time because many tax laws are not indexed for income growth and/or inflation. Thus, if tax cuts are not periodically implemented, taxes consume a continually greater share of people’s incomes and the nation’s economy.
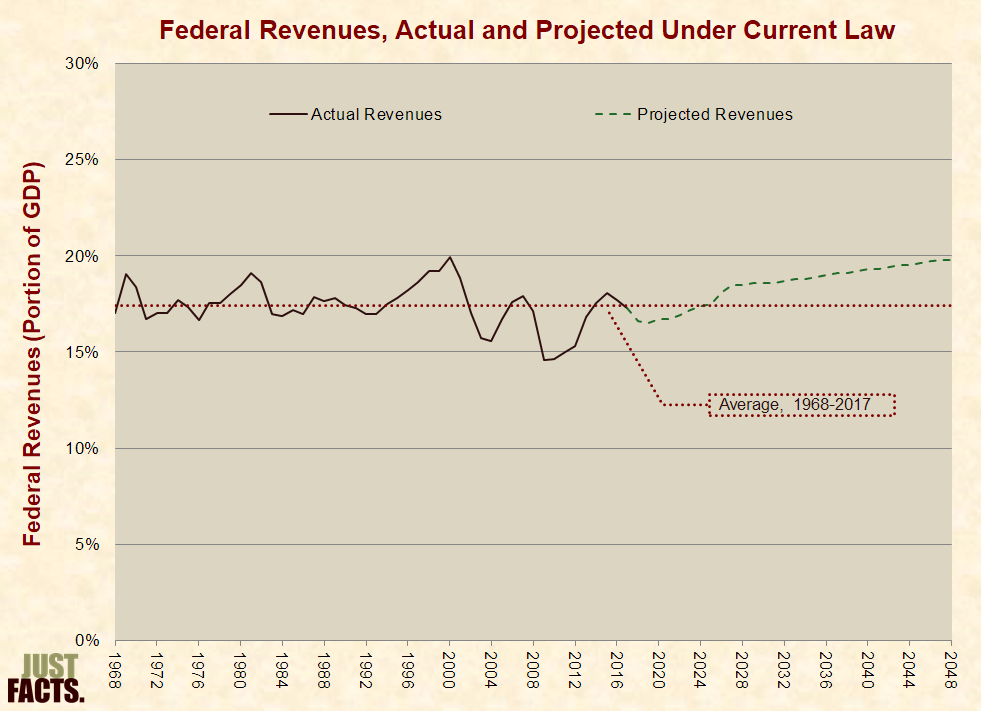
For instance, after the Trump tax cuts of 2017 took effect, the Congressional Budget Office projected in 2018 that the portion of the nation’s economy consumed by taxes would rise above its long-term average in several years and then continue on an upward trajectory. Part of this increase is due to the certain expiring provisions of the tax cut in 2026, but the general trend is due to bracket creep:
This comprehensive data reveals that many “tax cuts” were actually “tax evens” because they kept taxes on a relatively flat trend for more than half a century.
Failures to Consider Trajectories
Given that the debt from World War II was by a large margin the highest U.S. debt for more than 220 years, many people have pointed to it as evidence that large national debts don’t harm economies. For example, Douglas J. Amy, professor of politics at Mount Holyoke College, wrote in 2011:
“Conservatives are also wrong when they argue that deficit spending and a large national debt will inevitably undermine economic growth.”
“The best example is World War II when the national debt soared to 120% of GDP—nearly twice the size of today’s debt.”
“This spending not only got us out of the Great Depression but set the stage for a prolonged period of sustained economic growth in the 50s and 60s.”
Forebodingly, the debt exceeded that of WWII in less than a decade, but even before the Covid-19 pandemic, it was on trackto grow to more than double the WWII level in the coming three decades. These facts expose the fatal flaw in Amy’s argument—the failure to consider that the WWII debt was a passing spike that plunged after the war, while the modern debt is growing rapidly due to structural issues.
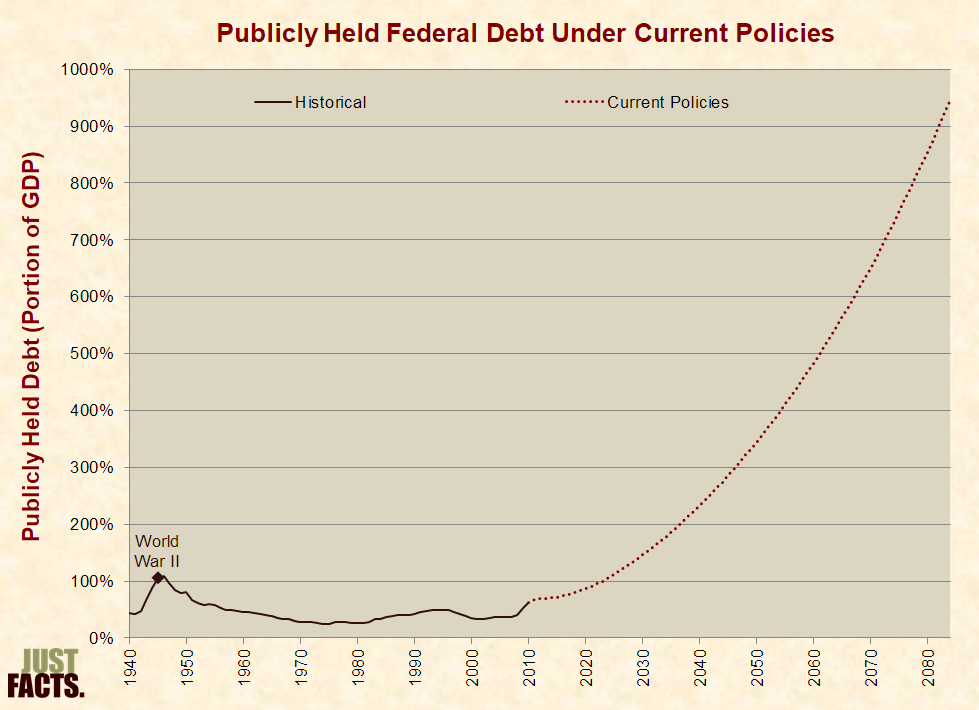
The primary difference between the post-WWII era and today is again, spending. After WWII, federal spending as a portion of GDP fell by 50% within two years and averaged 41% lower than the last year of the war over the next four decades. In contrast, when Amy wrote the above, the Congressional Budget Office was projecting that under current policies and a sustained economic recovery over the next four decades:
federal spending would average 72% higher than in the four decades that followed WWII.
the publicly held debt—a partial measure of the national debt often used by the Congressional Budget Office—would rise by 277 percentage points and grow thereafter to about nine times the peak of WWII:
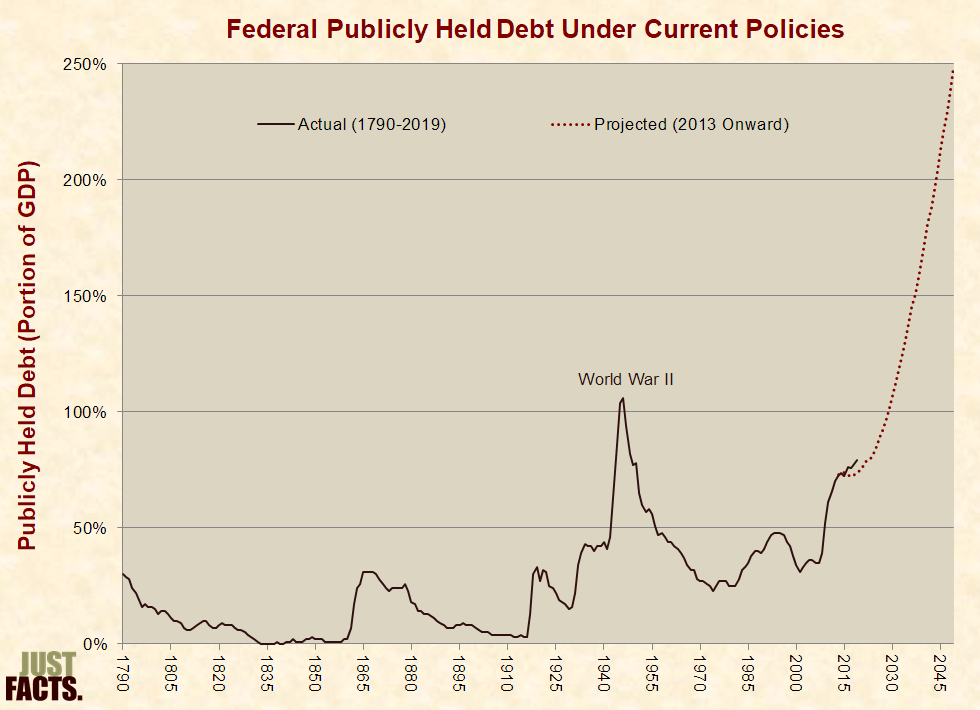
In the years following that projection, both debt and GDP outcomes were worse than predicted, and the Congressional Budget Office released a more dire projection in 2013. At that time, Barack Obama and Paul Krugman were dismissingconcerns about the national debt, and David Lauter and Michael Hiltzik of the Los Angeles Times were falsely reporting that debt was falling. Six years later in 2019, the outcome was even worse than projected:
Since 2019, the debt from government responses to Covid-19 has been adding to this, thus steepening its upward trajectory.
All of this has placed the U.S. in a debt situation that is far more critical than at any time in its history. Unlike the WWII era, this is not a passing anomaly but a systemic, escalating problem driven by ongoing federal policies.
Consequences
Contrary to those who downplay the dangers of government debt, a broad range of scholarly research has documented the harm it can do:
Writing for the Brookings Institution, Alan J. Auerbach and William G. Gale explain that “sustained large deficits will reduce future national income and living standards.”
The U.S. Government Accountability Office warns that “the costs of federal borrowing will be borne by tomorrow’s workers and taxpayers,” which “may reduce or slow the growth of the living standards of future generations.”
The Congressional Budget Office reports: “Large budget deficits would reduce national saving, leading to higher interest rates, more borrowing from abroad, and less domestic investment—which in turn would lower income growth in the United States.”
In a book published by Princeton University Press, Carmen Reinhart and Kenneth Rogoff explain: “Governments can also default on domestic public debt through high and unanticipated inflation, as the United States and many European countries famously did in the 1970s.”
A 2012 paper in the Journal of Economic Perspectives documents a strong association and a likely cause-and-effect relationship between high levels of government debt and poor economic growth.
Misinforming people about those matters, numerous media outlets publicized a study said to disprove the connection between high debt and weak economic growth, but the study actually shows what previous studies had found: GDP growth decreases by an average of about 30% when government debt exceeds 90% of GDP. The authors of the study, however, buried this data on the 10th page of their paper and wrote a deceitful overview, which the media parroted.
The consequences of government debt are not merely potential dangers that might occur at some point in the future. They may, in fact, have already begun. Although association does not prove causation, the national debt has risen dramatically over past decades, and with this, the U.S. has experienced episodes of historically poor growth in GDP, productivity, and household income. These could cause a host of negative impacts on human welfare in areas like education, nutrition, healthcare, and life expectancy.
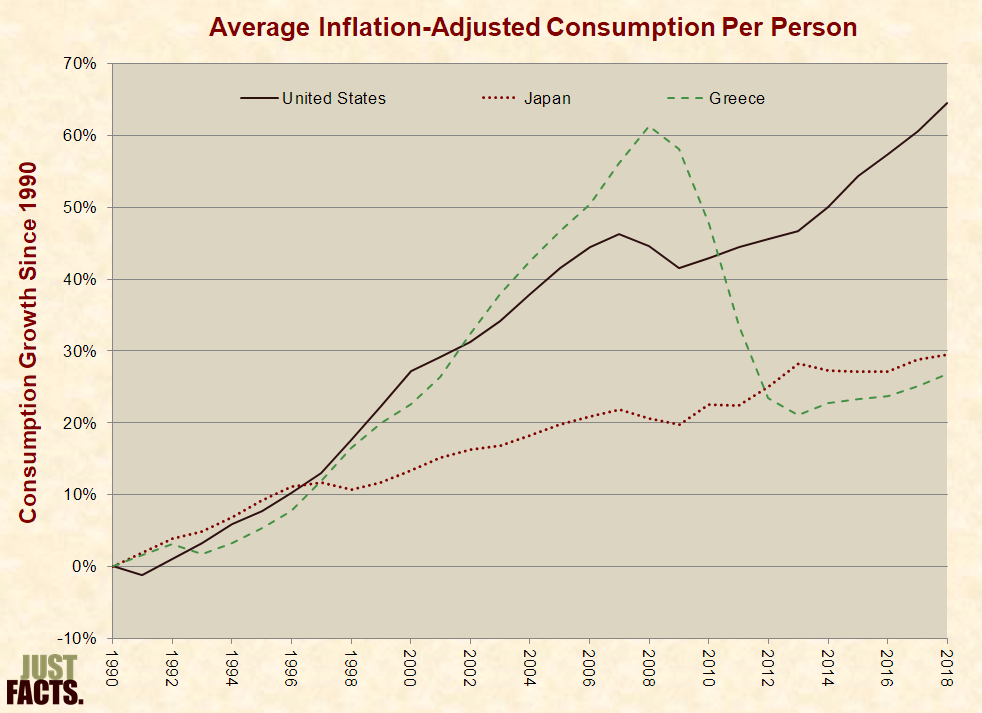
Some people point to Japan, which has a debt-to-GDP ratio of around 200%, as evidence that high national debts are harmless. They claim that Japan has not suffered like Greece (which underwent a debt crisis in 2009) because Japan and other nations that have their own currencies “can never run out of money to pay back what they owe, since they can always print what they need as a last resort.”
In reality, Japan has fared as poorly as Greece when measured by the World Bank’s “preferred“ indicator of human welfare, which is people’s consumption of goods and services. The difference is that Japan has experienced long-term sluggish growth in its living standards as its debt has surged, while Greece endured a sudden collapse in living standards when its debt bubble burst. Ultimately, they ended up in about the same place:
Again, association does not prove causation, so these data don’t prove that Japan’s or Greece’s economic woes were caused by debt, but they do debunk the notion that Japan hasn’t suffered like Greece. Japan’s situation may even be worse than Greece’s, for if debt has played a role in Japan’s long-running slump, it is more difficult for citizens to understand this and hold politicians accountable for their actions. Hence, the harmful effects continue.
While some people imagine that governments can borrow with abandon without hurting people, one of the most established laws of economics is that there is no such thing as a free lunch. The prolific economist William A. McEachern explains why this is so:
There is no free lunch because all goods and services involve a cost to someone. The lunch may seem free to you, but it draws scarce resources away from the production of other goods and services, and whoever provides a free lunch often expects something in return. A Russian proverb makes a similar point but with a bit more bite: “The only place you find free cheese is in a mousetrap.”
Illinois became the first entity to borrow from the Fed’s new facility known as the “Municipal Liquidity Facility” for state and local governments. The Fed’s legal authority lies in section 13(3) of the Federal Reserve Act. This authorizes the Fed to directly lend to “individuals, partnerships and corporations” in “unusual and exigent circumstances.” Section 13(3) is titled “Discounts for individuals, partnerships, and corporations,” raising questions whether the Municipal Liquidity Facility is actually authorized under Section 13(3). This has been capped at $500 billion.
To qualify they need a credit rating which is always up for sale to the highest bidder as we saw in 2007. Illinois is already insolvent and its debt is trading at junk bond status. However, as long as they pay the fee, one of the credit agencies can certify a rating which is arbitrary so they get the funds for a kick-back. Welcome to the wonderful world of corrupt credit ratings. This proves that Illinois cannot hope to raise money to borrow. Someone should just turn out the lights.
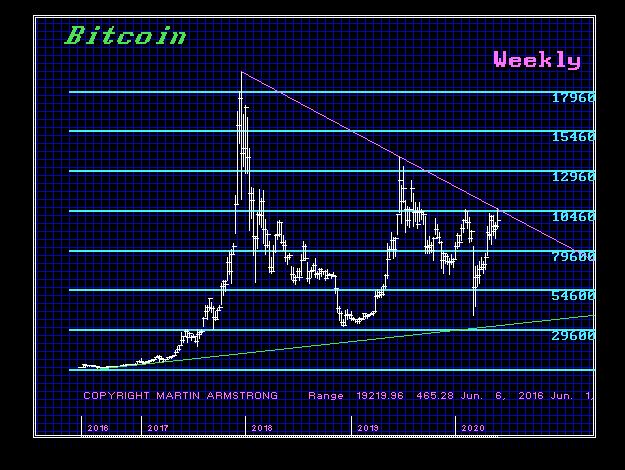
Chinese police have frozen several thousand accounts of Bitcoin traders during an extensive crackdown on illicit activities, which includes transferring money out of the country as well as tax evasion. We must realize that the PRESUMPTION that we have free markets and that somehow a cryptocurrency is outside of the government fiat system is all the nice fluff used to sell them. But the closer we get to 2032, government will NOT tolerate competition. Europe is already planning to eliminate all paper money. Do you really think they will allow people to have alternative accounts using cryptocurrencies when their objective is to force all money into the banking system with their Marxist agenda?
Any assumption that you have any rights whatsoever is wrong. You have noting including property. It all belongs to the government in the depths of their mind. All they are looking for is the excuse to justify their actions. Politicians no longer represent the people. That is the first this you need to understand.
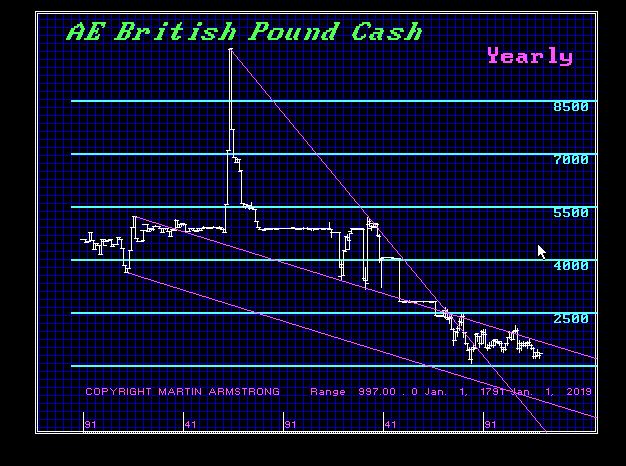
I have received a lot of emails from Britain asking if Boris is the new reason for the collapse of the pound. Fundamentals always emerge to support the projected trend. Boris is approving contract tracing which will undermine the economy dramatically. This is a plot by the socialists to realize their Marxist dreams. The press is so intensely keen on keeping COVID as a national security threat that it is really hopeless.
The British pound appears to be still destined to break the 1985 low. However, we first need the false move with the dollar down to trap everyone into short-dollars and then this will flip around. Contact tracing and certificates to prove you do not have COVID will end tourism for Europe. No Americans will be traveling there if they have their way. The stupidity of Boris and other European world leaders is beyond description. I think I have seen London for the last time already.
We are in a battle with the socialists on an unprecedented scale. They are deliberately destroying businesses under the pretense of the New Green Deal.
QUESTION: Marty, I was there at your 1987 conference on the weekend of the crash. I was amazed, with many others, that you were able to say the futures would drop 10,000bp and bottom with the ECM and then make new highs. I don’t have to say many did not believe that forecast. What is the difference you see this time since it does feel different?
Your loyal follower on this quest for knowledge.
PGD
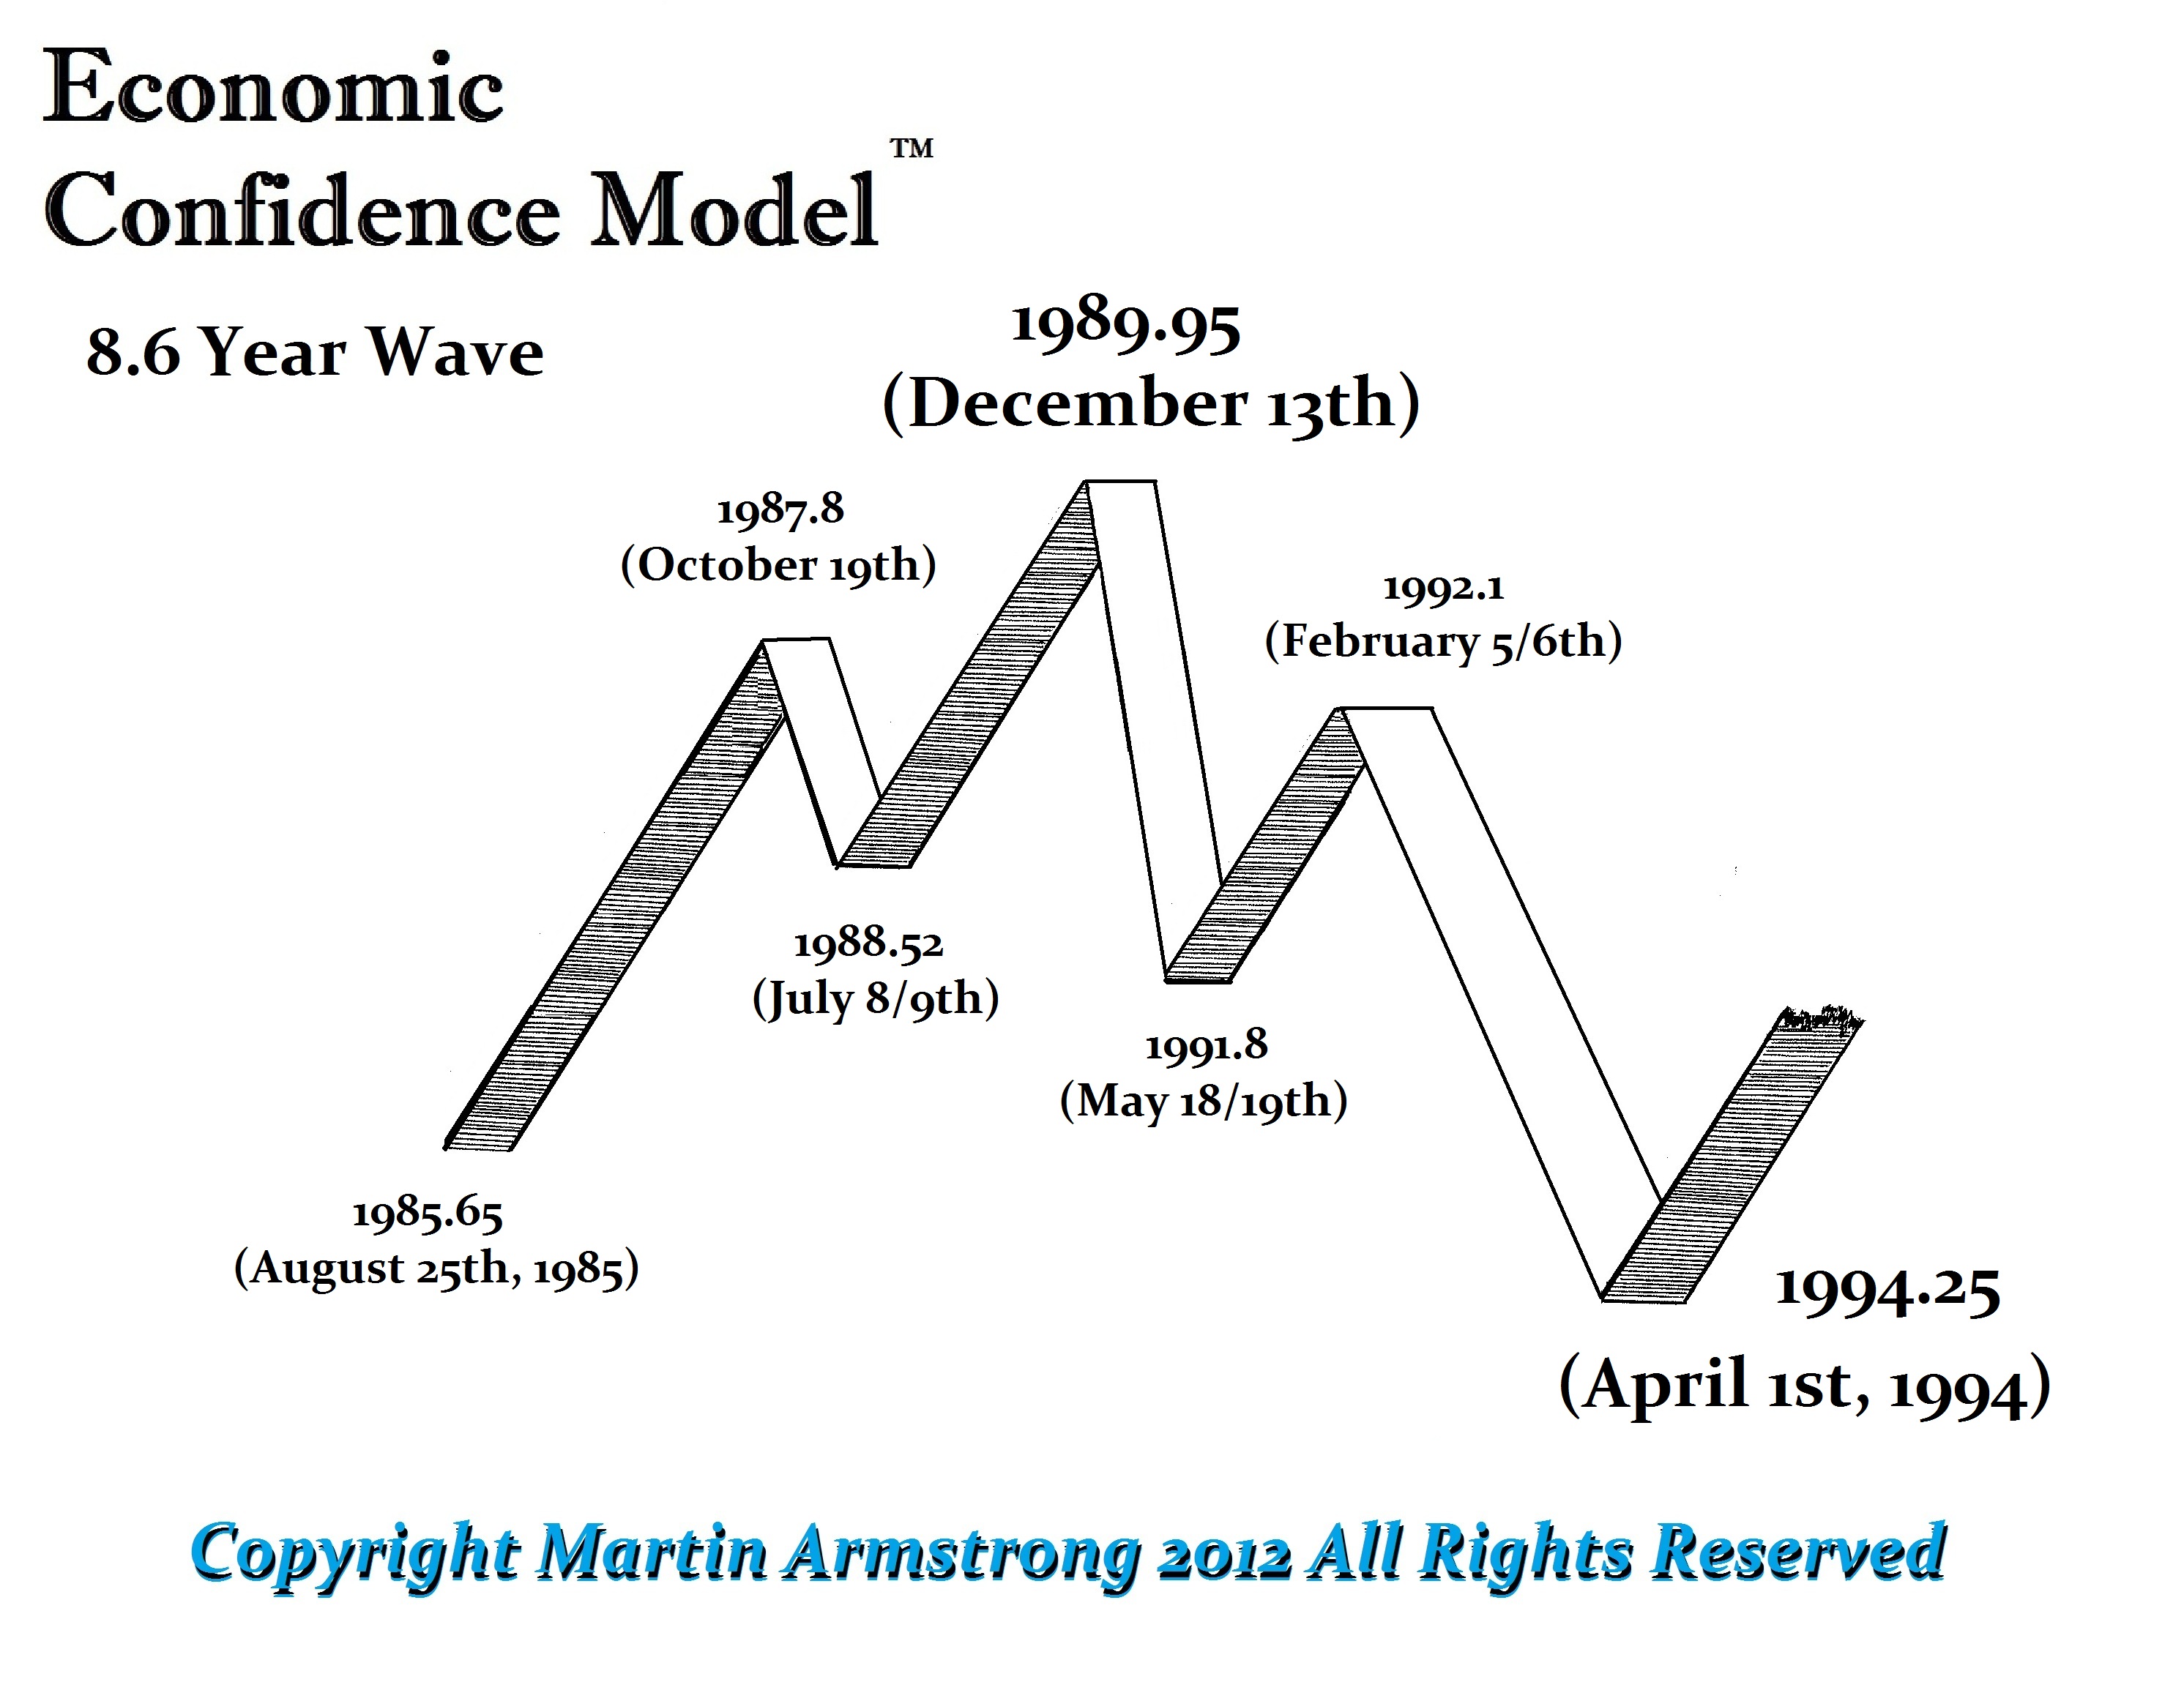
ANSWER: The 1987 Crash took place on the day of the ECM on October 19, 1987. So we have the low on the turning point, which confirmed that we should make new highs by the next turning point 1989.95.
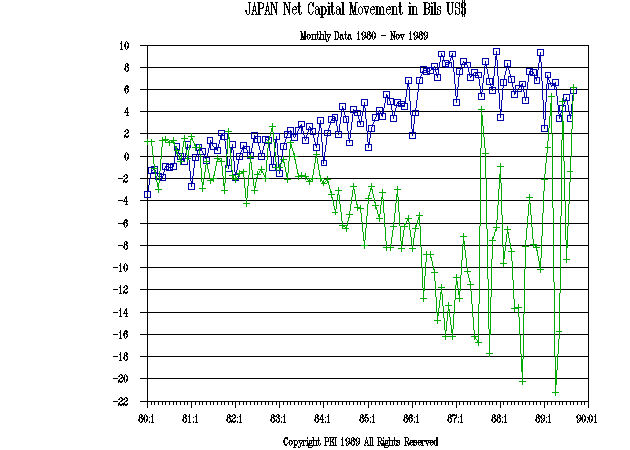
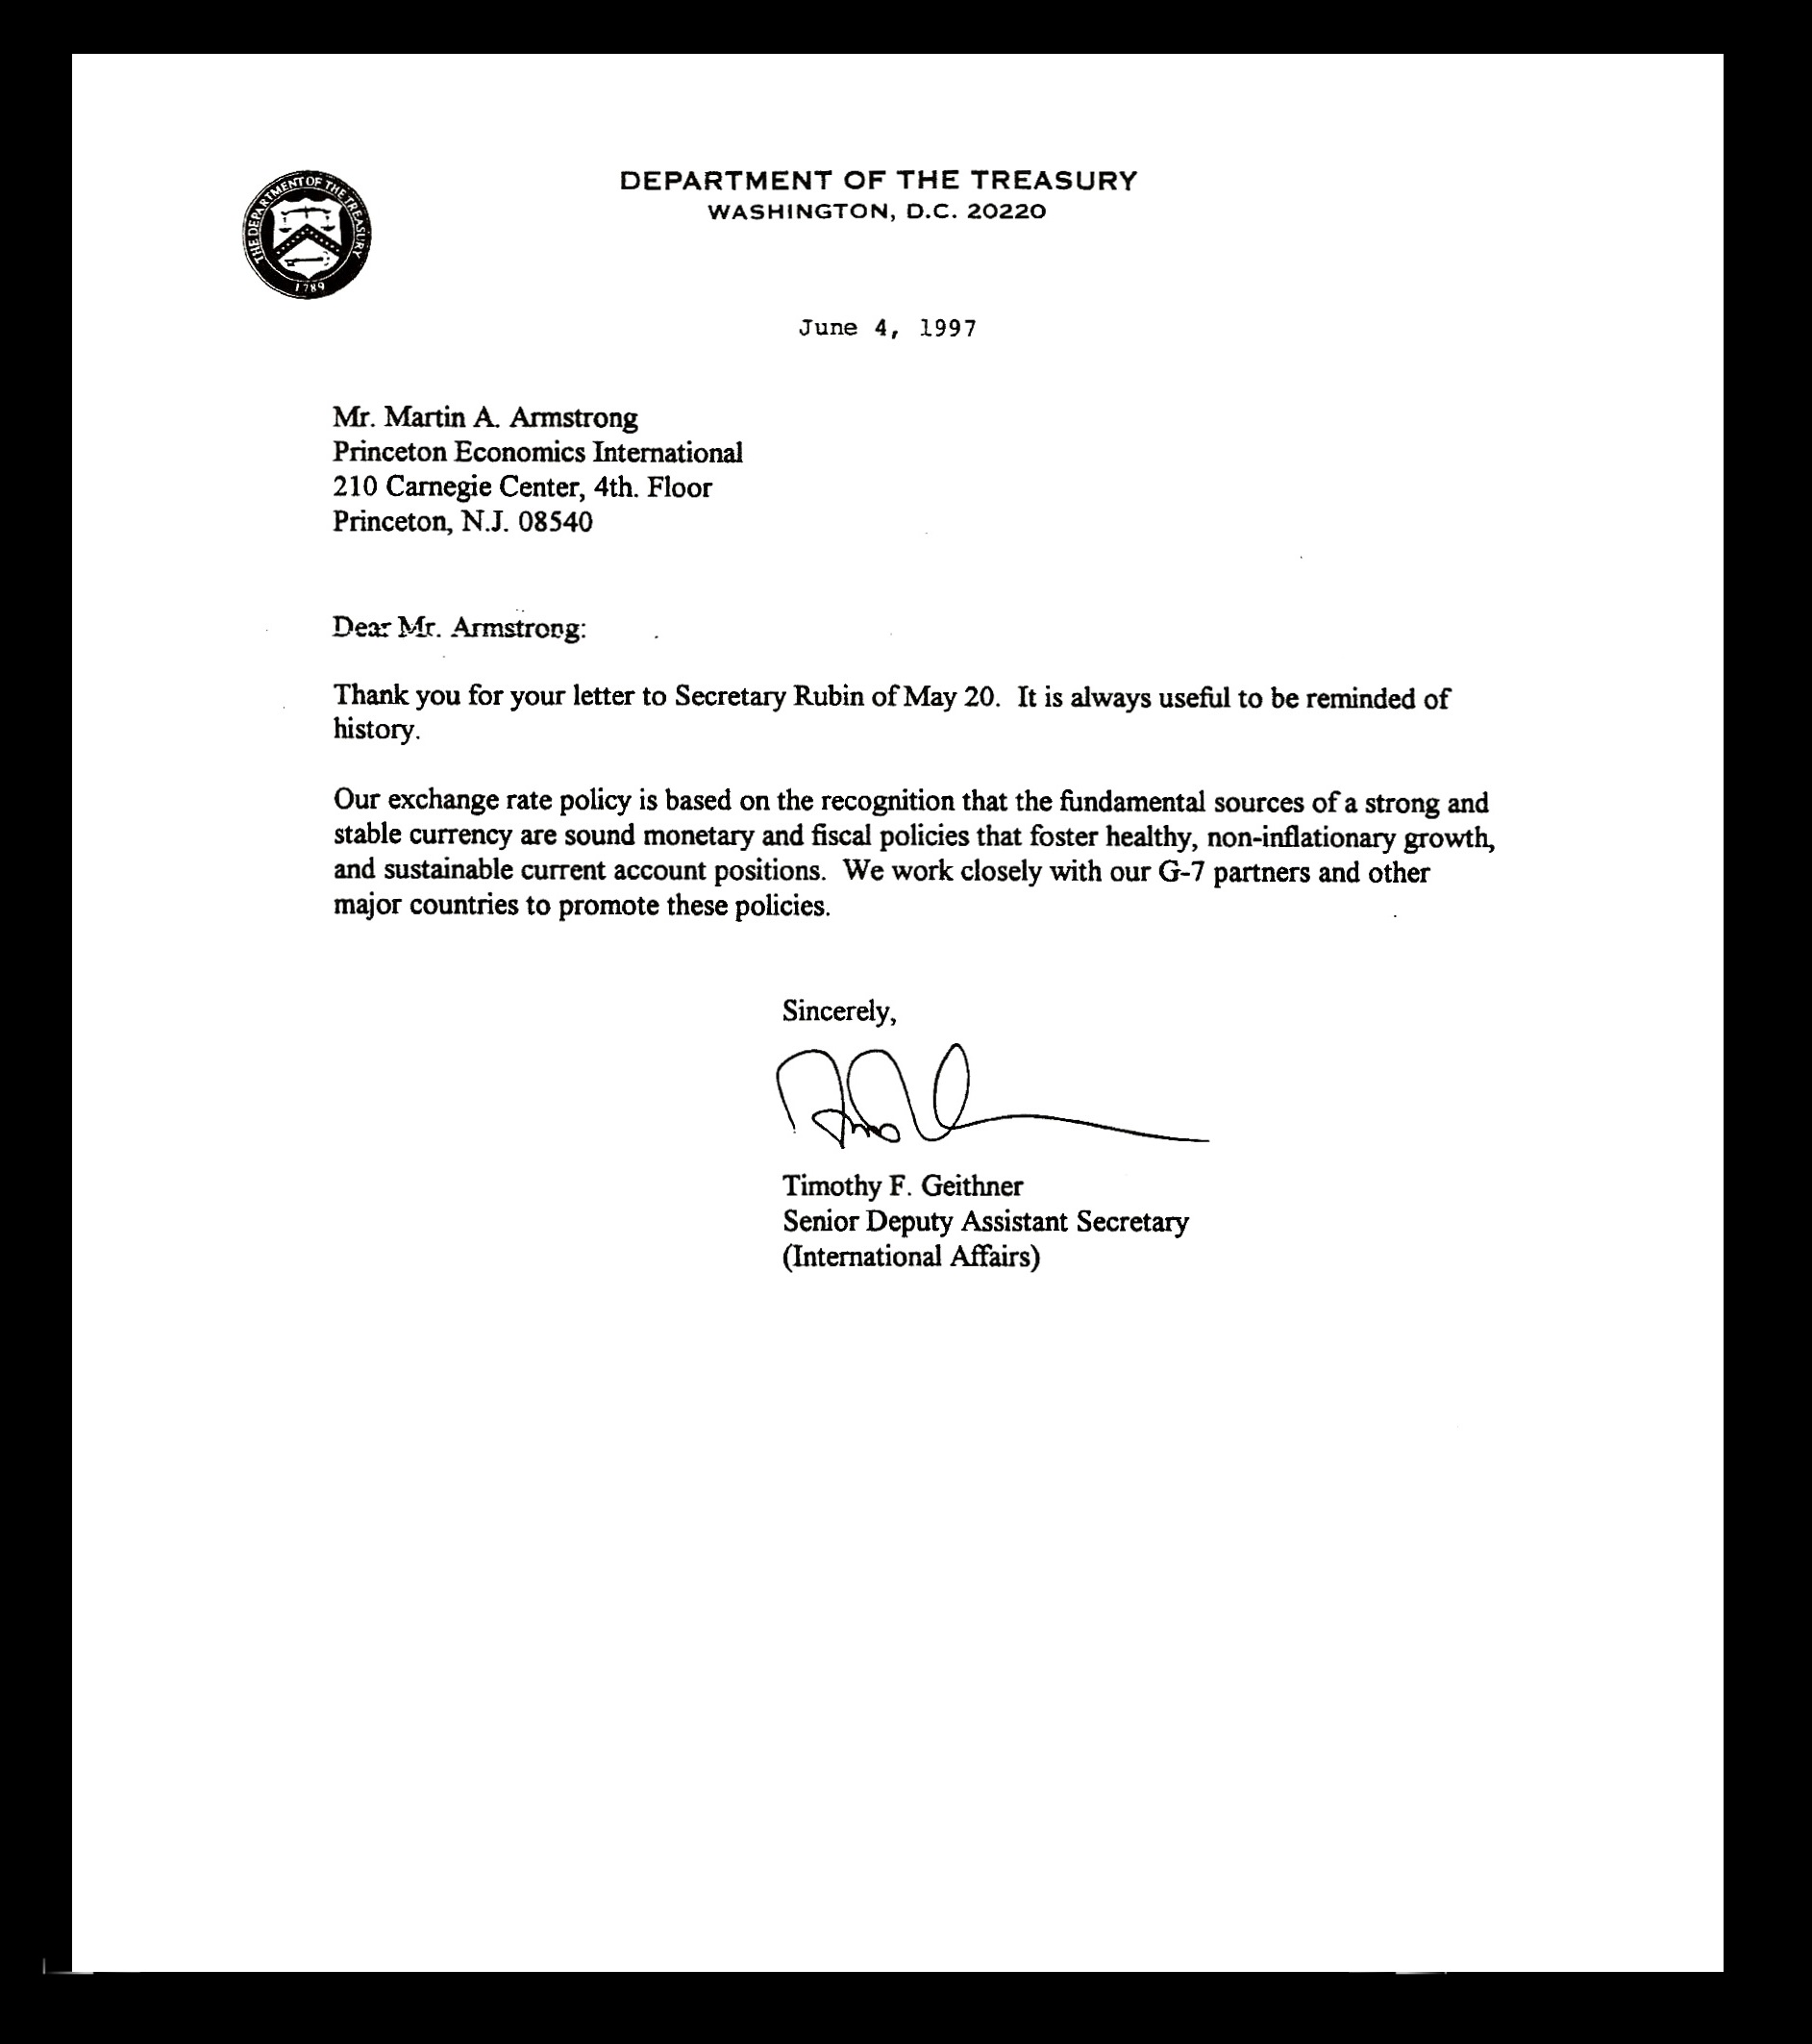
The cause was termination from the foreign exchange markets set in motion by the stupidity of the G5 in trying to manipulate the dollar lower for trade AFTER they sold 1/3 of the US national debt to the Japanese.
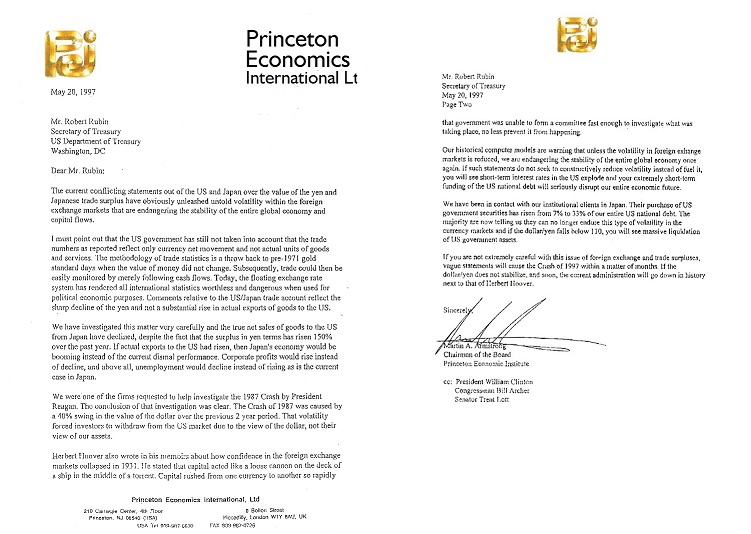
By attempting to manipulate the dollar lower to gain trade benefits, they fail to understand that foreign investment in the US would also be repelled. You cannot lower the value of a currency by 40% to help trade without causing losses to foreign investors. So the 1987 Crash was currency driven and not economic. When Rubin was trying the same stupid nonsense in 1997, 10 years later, that is when I warned them this was a stupid idea that created the 1987 Crash. They responded, but more importantly, they backed off.
This time we have brain-dead epidemiologists who are as corrupt as a $3 bill and should be thrown in prison for the global damage they have done deliberately without regard to the people. They have sold their souls to the Bill & Melinda Gates Foundation, which should be investigated for covert activities. The economic patterns are distinctly different and reflect the actions of a terrorist organization. This was not the mere stupidity of unqualified people in government. We have billionaires acting like usurpers, seizing power to force their vision of the future upon the rest of society.
This has been a direct assault to destroy and redesign the economy from the ground up. The patterns are completely different and display a frontal attack upon the economy. This is not a result of an unintended consequence of manipulating one market without comprehending the interconnectivity throughout the entire system. This has been a deliberate attempt to destroy the economy and our way of life as we have known it. Therefore, the stark difference has been the collapse of many sectors that have been set in motion deliberately. We then see European politicians gleefully looking at this as an opportunity to rebuild the economy from a green perspective. You have Spain introducing basic income which is all designed to move Europe into a full-blown Marxist state by eliminating paper currency. Soon, they will default on all debt by transforming all government debt to perpetual bonds when they realize they cannot sell debt anymore.
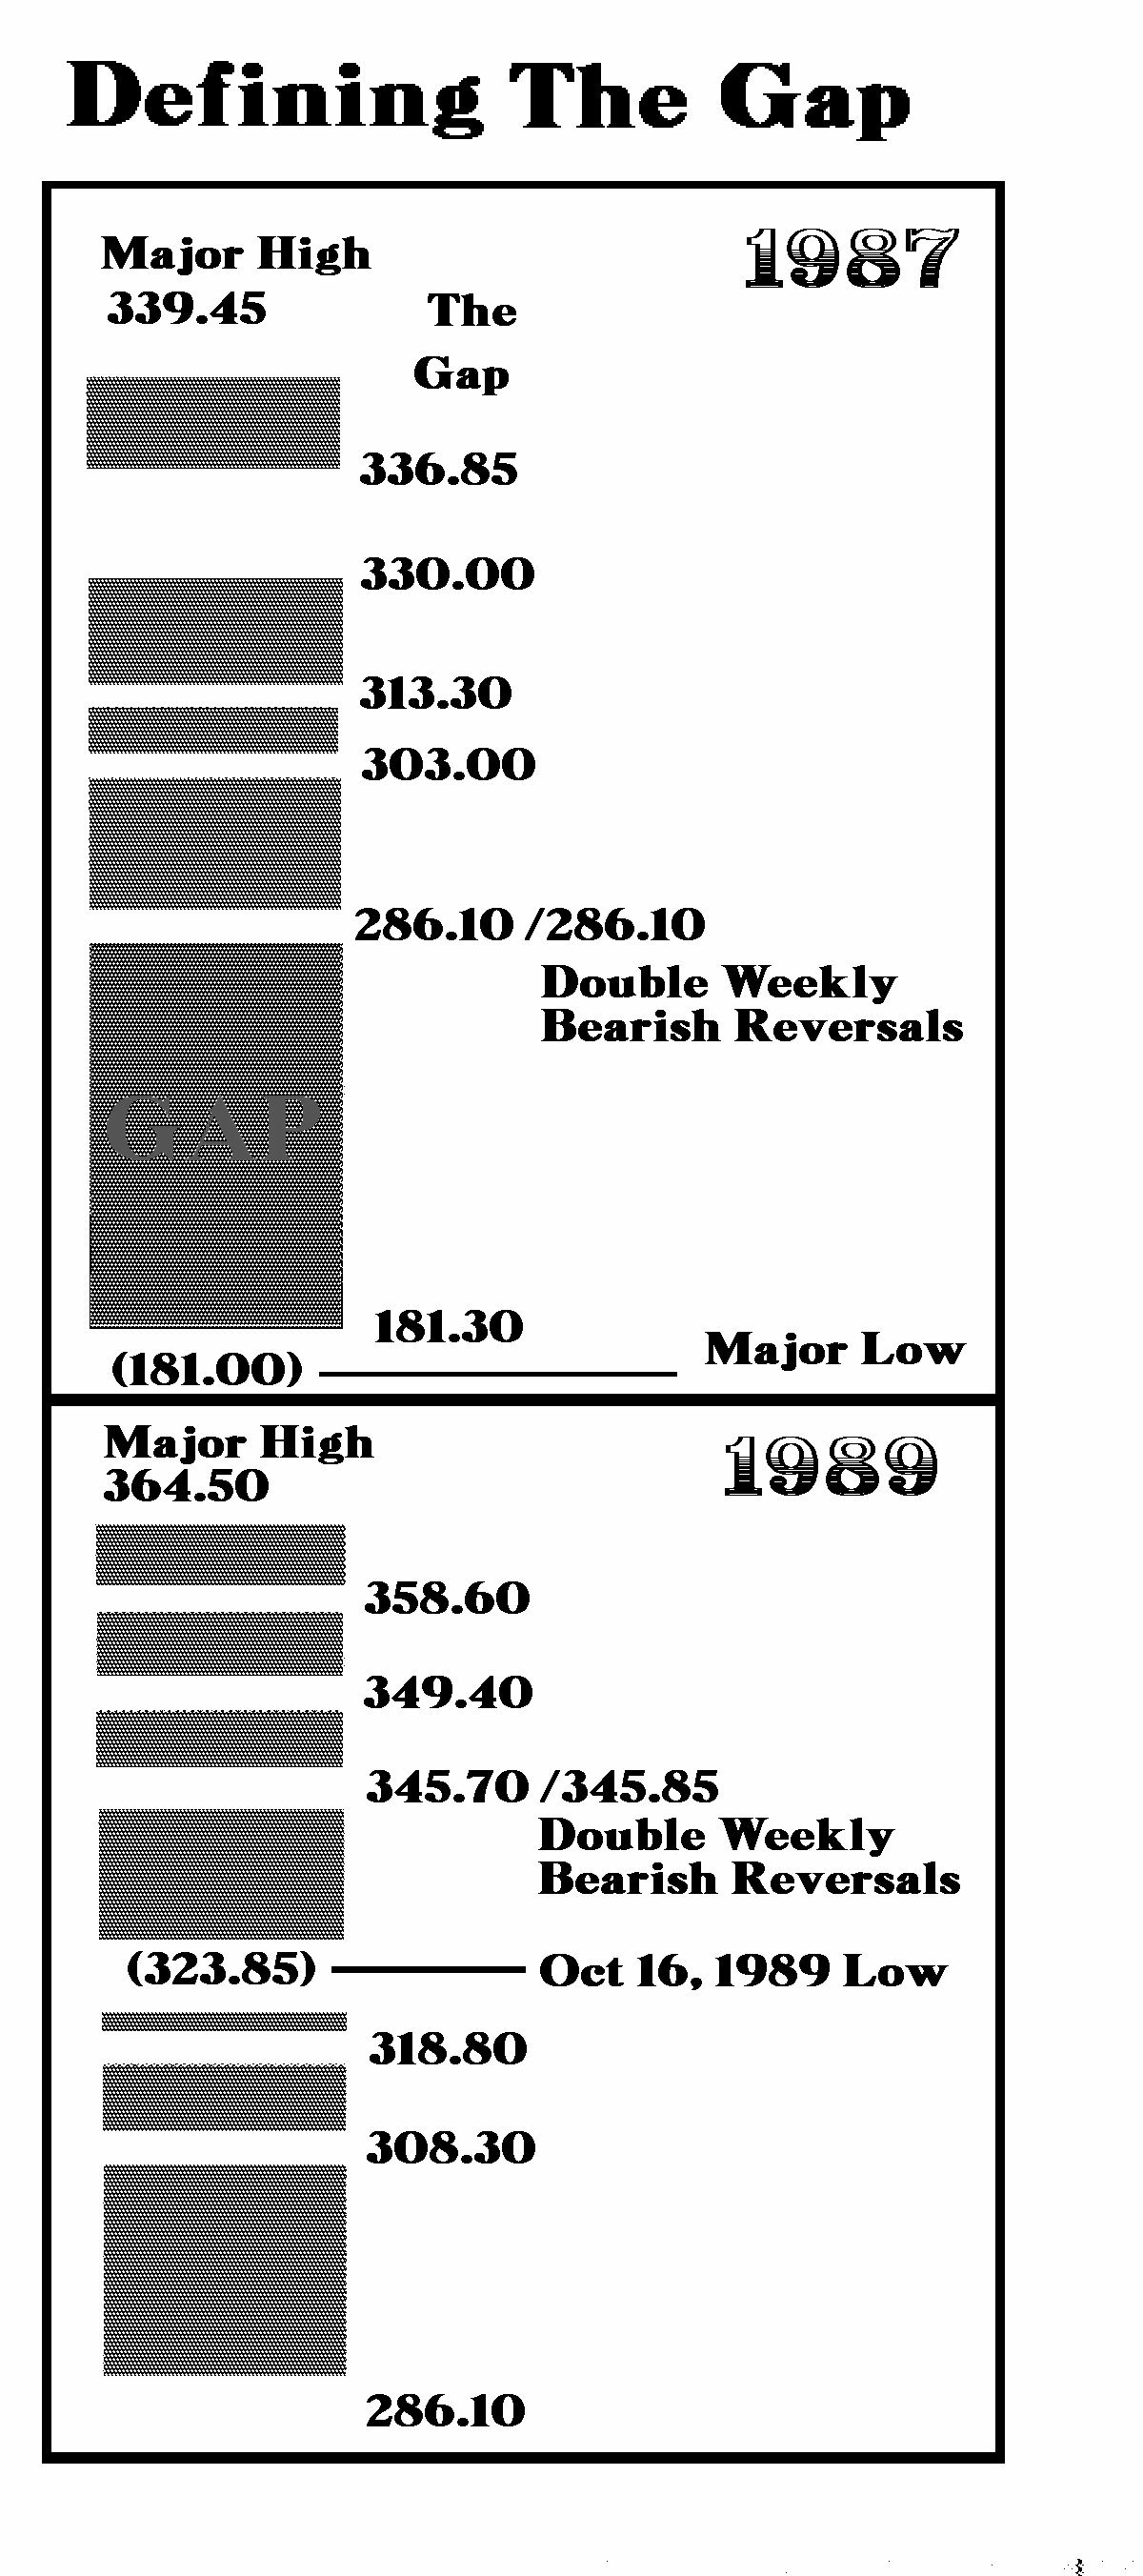
When we look at the 1987 Crash, the entire event was 8.6 weeks. It bottomed with the ECM, which was not the case this time. Moreover, there was a set of Double Weekly Bearish Reversals at 286.10. Once they were elected, there was nothing on our system models, including technical, that would reflect any support until we reached the Monthly Bearish Reversal. Hence, the forecast we would drop 10,000 points and then bottom wit the ECM.
The Monthly Bearish Reversal was 180.30 and the low was 180.00. That met all our criteria perfectly. But look at the pattern for the recovery. We do not see the strong immediate bounce as we have seen this time. In fact, it took 41 weeks to elect the first Weekly Bullish Reversal. There was a slow but steady advance which was reflecting the underlying strength within the economy. There was no Paradigm Shift, but a disruption to the foreign exchange markets which is the foundation of international capital investment.
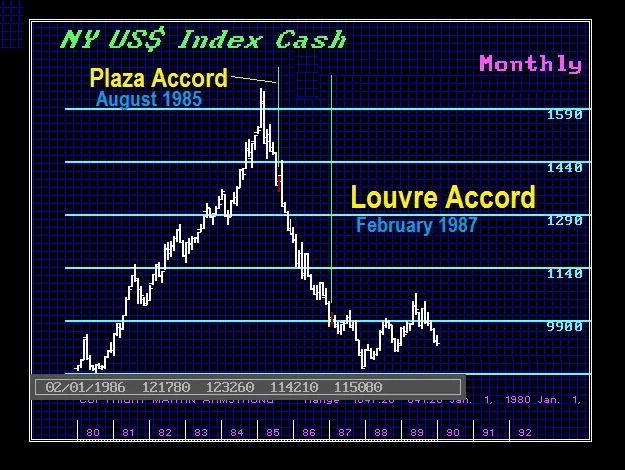
The G5 was created at the Plaza Accord in 1985, calling for the dollar to decline by 40% to reduce the US trade deficit. As the dollar fell too far, other members complained and this led to the Louvre Accord in February 1987, when they declared the dollar had declined far enough. The dollar kept falling, the sentiment shifted, and everyone began to question if the central banks were capable of doing anything. Hence, by October 1987, there was a massive panic selling in the dollar which led to selling dollar assets.
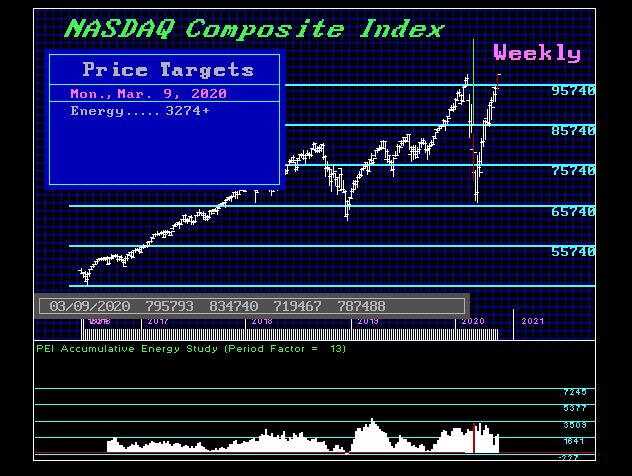
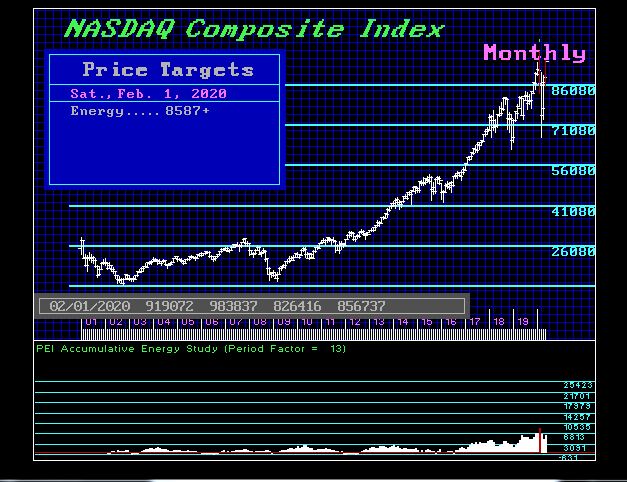
QUESTION: Marty; Your energy model seems to be warning that the bounce is not going to last. I have followed the reversals and they have been great for the bounce. What I have noticed is your energy model peaked two weeks before the low but as the market has rallied, energy has been declining. The 2018 December low your energy bottomed with the low and that was a good rally. This seems to be the opposite. Is my interpretation correct?
DF
ANSWER: Yes. We have a divergence on the weekly level with the typical novice rushing in to buy based upon the fact the market has simply rallied. They will always judge the next 5 years by a few weeks of price action. When we look at the monthly level, the peak in price was very high in energy which has been declining ever since. This also warns of caution. Keep in mind that we had a nice 11-year rally in the Dow & S&P500 from the 2009 low. That is a traditional bull market. But the NASDAQ bottomed in 2002, not 2009, so that was an 18-year rally, which is significantly different.
White House trade and manufacturing policy advisor Peter Navarro appears for an interview with Maria Bartiromo to discuss the strong data for jobs amid the effort to reopen all facets of the U.S. economy. Navarro highlights the recent visit to Maine where he accompanied President Trump to celebrate U.S. critical manufacturing.
Within the interview Navarro reminds the audience of the larger strategic confrontation against China that involves multiple geopolitical aspects to the U.S. economy.
.
The media apoplexy over positive economic news is directly related to how much damage a positive economy does to the Antifa/BLM strategy to divide our nation through class warfare. A thriving Main Street economy is antithetical to the objective.
Prior to the Wuhan virus President Trump was positioning the confrontation between the U.S. and China based on economics and trade. Within that dynamic Beijing had a weak hand and President Trump exploited their vulnerabilities with a geopolitical strategy to dismantle China’s one-belt/one-road expansion plan.
President Trump used access to the strong U.S. market to leverage multinational companies away from Chinese manufacturing. Trump’s tariffs against China were extremely effective; and led to Beijing’s initial acquiescence. However, it was soon evident that China would not accept their diminished economic outcome.
President Trump has been creating a dual position for several years; this is very unique because it is the same strategy used by China. By expressing a panda mask, yet concealing the underlying dragon, President Trump’s policy to China is a mirror of themselves.
Historic Chinese geopolitical policy, vis-a-vis their totalitarian control over political sentiment (action) and diplomacy through silence, is evident in the strategic use of the space between carefully chosen words, not just the words themselves.
Each time China takes aggressive action (red dragon) China projects a panda face through silence and non-response to opinion of that action;…. and the action continues. The red dragon has a tendency to say one necessary thing publicly, while manipulating another necessary thing privately. The Art of War.
President Trump is the first U.S. President to understand how the red dragon hides behind the panda mask.
First he got their attention with tariffs. Then… On one hand President Trump has engaged in very public and friendly trade negotiations with China (panda approach); yet on the other hand, long before the Wuhan virus, Trump fractured their global supply chains, influenced the movement of industrial goods to alternate nations, and incentivized an exodus of manufacturing (dragon result).
It is specifically because he understands that Panda is a mask that President Trump messages warmth toward the Chinese people, and pours vociferous praise upon Xi Jinping, while simultaneously confronting the geopolitical doctrine of the Xi regime.
In essence Trump is mirroring the behavior of China while confronting their economic duplicity.
There is no doubt in my mind that President Trump has a very well thought out long-term strategy regarding China. President Trump takes strategic messaging toward the people of china very importantly. President Trump has, very publicly, complimented the friendship he feels toward President Xi Jinping; and praises Chairman Xi for his character, strength and purposeful leadership.
To build upon that projected and strategic message – President Trump seeded the background by appointing Ambassador Terry Branstad, a 30-year personal friend of President Xi Jinping.
To enhance and amplify the message – and broadcast cultural respect – President Trump used Mar-a-Lago as the venue for their first visit, not the White House. And President Trump’s beautiful granddaughter, Arabella, sweetly serenaded the Chinese First Familytwice in Mandarin Chinese song showing the utmost respect for the guests and later for the hosts.
All of this activity mirrors the duplicity of China. From the November 2017 tour of Asia to the January 2020 China phase-1 trade deal, President Trump has been positioning for an economic decoupling and a complete realignment of global trade and manufacturing.
Much of the UniParty opposition, arguably almost all of it, is specifically because the America-First economic agenda wipes out the control elements within Washington DC who are paid to retain the status quo.
Part of the reason why limo-liberal elites have been successful politicians through the years is the outcome of their economic policy inherently creates a wider gap between the haves and have-nots. This divide allows politicians to control apportioning.
Exploiting the gap, essentially exploiting class warfare as a political strategy, is the fuel that drives identity politics. Ergo all progressive economic policies, the offshoring of jobs; the policies that support Wall Street and globalism etc; are designed to weaken the U.S. middle-class while making rich people more affluent, and poor people more dependent.
The ruling elites deny this fundamental truth, but the rust-belt did not create itself. The erosion of the U.S. manufacturing base -and Main Street- was an outcome of policy. Republicans and Democrats participated in this process. Democrats claim, falsely, to be champions of the middle-class; but their narrative is refuted by the actual results of their policy. Both parties are deep in the pockets of Wall St multinationals.
Many people call for a third party in politics without realizing President Trump represents the first second party DC has seen in decades. That’s why he is opposed by both wings of the same legislative bird.
Through dependency the political elites begin their role to decide who gets what part of their limited and controlled economic pie. Economic intervention, supported by both wings, in the spending process is what has allowed political interests to retain control.
Main Street and the freedom within the free market is a problem for command and control economic systems. Wall St global financial systems, controlled by a limited number of large institutional multinationals, are much easier to control.
Remember the catch phrase “too big to fail” in the banking system? The DC ruling class said a small group of banks controlled too much wealth. So they instituted ‘banking reform’. The result was even fewer banks that were even bigger. The outcome was the exact opposite of what they said was the purpose. Their policy made the problem worse.
President Trump’s America First agenda is specifically a benefit to Main Street and the middle class. In the banking sector treasury policy and targeted deregulation focused on creating more community banks and credit unions to benefit Main Street. That’s exactly what happened. By focusing on Main Street, Trump and Mnuchin fixed what the uniparty congress did not. [Arguably, congress purposefully and willfully did not.] Smaller, more nimble, banks are now positioned to assist small and medium Main Street businesses.
President Trump’s domestic and global political opposition recognize that his trade and economic policies have reversed much of their control. There are trillions at stake, that’s the financial motive for the opposition. However, a lack of control over the economic outcome; meaning President Trump creating more pies; means not only do they lose control over the money, they also lose control through diminished political power.
America-First is a program focused on Main Street and it expands the middle class. That is why during President Trump’s first term the wealth gap actually started to narrow for the first time in decades. The wage growth for line-level or blue collar workers was/is rising faster than the supervisory wages. This is a uniquely trumpian effect from a return to economic policies that benefit Main Street USA workers.
More jobs means the value of labor to do those jobs increases. This economic path is against the interests of coastal elites and the politicians they pay to retain the wealth gap.
It is much harder to create outrage over a wealth gap when the workforce is seeing increased wage growth. In that scenario, the voices who live on the fuel of class warfare are ignored.
All of the current U.S. antagonism is dependent on the class struggle. If the police are defunded only the wealthy will have access to police.
The same process is true for healthcare, housing and a host of economic measures. If a person can independently afford to access these sectors, those who construct the system of controlling, dividing and apportioning the benefits become irrelevant.
The media outrage over the positive economic data today is indicative of their concern the economy will quickly rebound; and that means diminished influence for the politicians the media are in position to support.
The current protest movement is reliant upon the class struggle as the primary narrative underpinning the need for protest leadership. Abundance is against their interests.
When the economy was shut-down by the COVID virus, it was an unnatural economic event. Everything inside the U.S. economy including: the number of workers; the growth in wage rates; the availability of jobs; the lack of inflation; the expansion of investment, was the strongest in our history. However, when everything was stalled all of that positive architecture, the policy that created the outcome, did not go away.
U.S. economic conditions were being driven by internal economic activity that was no longer as dependent on global drivers. When the underlying economic strength is domestic, it makes sense the economy can restart much faster because the activity is not dependent on outside global stimulus. In essence, the USA can rebound much faster because we are NOT dependent on the restart of other global economies. Again, another uniquely positive attribute that is enhanced by ‘America-First’ policies.
China, Obama, Pelosi and Schumer can, and did, attempt to throw a COVID wrench in the expanding U.S. economy. However, they cannot undo the foundation President Trump had already established. Those America-First policies will again work in our favor; and yes, when President Trump says he “can do it again” his confidence is based on that underlying foundation.
Trump may not articulate it, but he knows the U.S. economic independence he has already achieved through three years of advanced policy to benefit Main Street. He knows the trade agreements, the cutting of regulation, the unleashing of energy development and the weight of tariffs on imports all mean the best place for investment is inside the U.S.A.
That fundamental structure did not change, and is not going to change.
A recent example – Remember the previously mentioned policy focus on deregulated community banks and credit unions to assist Main Street? The success and efficiency of the Paycheck Protection Program for small and medium business was a direct result of that earlier policy. Even in crisis the America-First foresight pays dividends.
The far left is hoping to curtail the strength of the economy; that’s why the blue state governors are fighting against reopening. However, the organized protests of thousands of people gathering together have made their best COVID shutdown arguments moot.
The professional grievance operators have a very narrow window to achieve their objective, and that desperation is starting to show in how severe they are pushing to create division before the economy restarts. Every social justice protest movement has been activated and Antifa footsoldiers are attempting to sow chaos.
The next funeral for George Floyd is being held in Texas with a full day viewing on Monday, and final funeral on Tuesday. With the COVID nonsense collapsing at the same time the currency of the race-card is exhausting, what are they going to do after that?
A classic Alinsky agitator, President Obama and his global allies have a goal to exploit the current economic conditions to once again push divisive class warfare. However, the economic conditions are rebounding faster than he/they are able to exploit…
…There is a collective desperation showing amid their 2020 alliance.
According to a recent survey conducted by the Institute for Economic Research (Ifo), German companies plan to reduce investments by 50% this year due to the lingering effects of the coronavirus. In fact, 28% of companies reportedly already canceled investments. The manufacturing sector, the heart of the German economy and therefore the entire Eurozone, purportedly plans to cut back projects and future investments by 64%, and 32% reported that they have already canceled business ventures entirely.
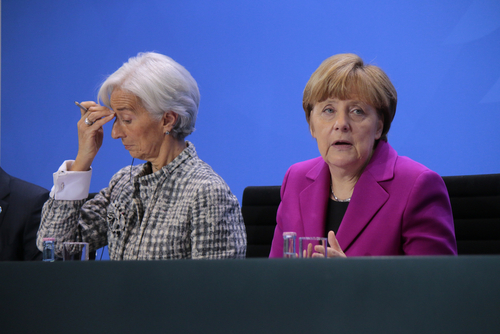
The coronavirus cannot account for the toll on German manufacturing, as 2019 was the worst year for that sector in a decade. In February of this year, the Financial Times reported that ECB President Christine Lagarde said low rates and inflation “significantly reduced the scope for the ECB and other central banks worldwide to ease monetary policy.” This was in February when the main concern was the US-China trade war, as Germany imports 9.4% of intermediate goods from China.
Chancellor Angela Merkel wants to pump $146 billion USD ($130 billion euros) into a stimulus package, while of course designating $56 billion USD of those funds to further the climate change agenda. The German economy already shrank by 2.2% in the first quarter. Merkel recently announced that she will “absolutely not” run for a fifth term, meaning she will leave her mess for the next person to clean up.
QUESTION: Hi, Martin
You have referenced the three different types of inflation in previous posts. Please speak to what we can expect to see manifest from this record money printing/stimulus from the Fed.
Thanks,
MD
ANSWER: This cycle will be on the back of shortages in commodities. This has been what the computer is forecasting all along. We have been witnessing shortages in food. But this coronavirus has also disrupted the supply chain in may areas. Then we have the Monetary Crisis Cycle coming for 2021 into 2022. With Europe planning to cancel its paper currency and try to force everyone into banks, you have the punters looking at this as bullish short-term for a trade.
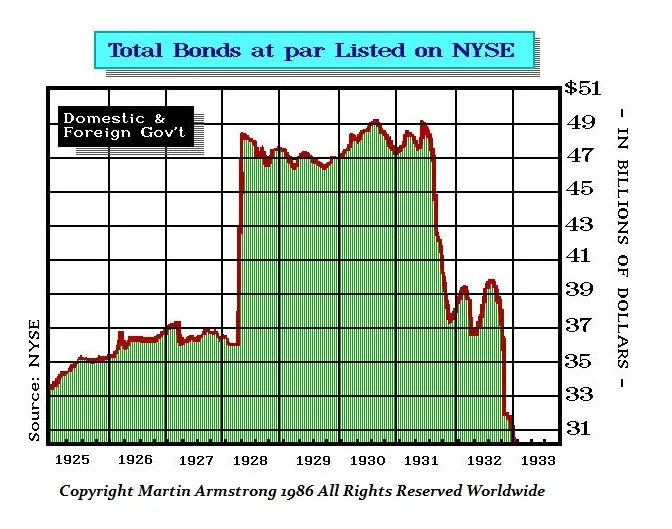
The European and Japanese Governments will have little choice moving forward for they have destroyed their bond markets and are UNABLE to issue bonds that institutions will buy at these crazy rates. It is more than a simplistic printing of money. We are looking at the bond market is collapsing. This is the DESTRUCTION of Capital Formation so in the end, capital must flee anything connected with governments and seek shelter in primarily the stock markets.
So far, we are into a 3-month reactionary bounce with the NASDAQ taking the lead and the Dow lagging. This is very disquieting for it warns we are going to see much higher volatility into the next two years perhaps more so than anyone has ever witnessed in their life or for the past 300 years.
I have created this site to help people have fun in the kitchen. I write about enjoying life both in and out of my kitchen. Life is short! Make the most of it and enjoy!
This is a library of News Events not reported by the Main Stream Media documenting & connecting the dots on How the Obama Marxist Liberal agenda is destroying America