Greater Fool Theory: Financial and Political Markets


Financial expectations have become over-inflated and can suffer a profound deflation. Exhausted, the Left could lose its fever which would favor the Republicans on the November 3rd election

Bob Hoye image

Re-Posted from the Canada Free Press By  —— Bio and ArchivesSeptember 8, 2020

Greater Fool Theory

Along-standing observation in wild stock markets is the “Greater Fool Theory”, which is a practical explanation of compulsively buying a soaring market. At excessive valuations, buying the hot stock today assumes that another fool will bid it higher tomorrow. And beyond. Such recklessness typically marks the buying climax that completes a bull market.

Intense political action also seems to be reaching a mania. This and the consequent reversals have happened before.

Of course, in retrospect the buying frenzy can be widely seen as foolishness. Chagrin, dismay and sometimes insolvency follows. Like clockwork.

The intensity of the activists (Antifa, BLM and Democrats) is approaching that seen early in the Russian and French Revolutions

And also of course, extreme passions have been expressed in the political markets. Foolishness, chagrin and dismay are likely to follow. Are Dems running on the “Greater Fool Theory” now? Don’t have to decide for yourself. Here’s what Bernie Sanders stated recently “Many of the ideas we fought for, that just a few years ago were considered radical, are now mainstream”. 

It is fascinating that a “straight up” market has been accompanied by virtually the same thing in politics.

Participants in both financial and political arenas have been compulsively outbidding each other.

The intensity of the activists (Antifa, BLM and Democrats) is approaching that seen early in the Russian and French Revolutions. Both occurred during highly speculative action in stocks and commodities.

Another example was the “Sturm und Drang” movement that roiled Europe. The final huge surge in the financial side of it completed in 1825 and consequent asset deflation was accompanied by deflating political ambitions and agitations.

The turmoil of the Revolution and Napoleon finally ended.

However, one of England’s greatest bankers in the 1860s dryly observed “No warning can save people determined to grow suddenly rich”. 

Political and financial markets also became wild in the early 1900s

In the case of the ambitious Left, “suddenly rich” now means advancing your political quest for position and power. Everyone must be controlled and “you must listen” to the experts. And always for “your own good”.

Political and financial markets also became wild in the early 1900s. Under the guidance of neurotic intellectuals Russia had their murderous revolution. The Webbs in England promoted “Fabian Socialism”, as a fashionable alternative to Soviet mayhem. Also, possibly their enthusiasm for violence was tempered by the obvious poor manners and tailors of the Bolsheviks.

Even American policymakers were nationalizing railroads until the financial and political violence completed in 1920. Wall Street was bombed on that September 6.

Russia went from full Communism to a softer socialism. The US changed to privatizing railroads. And late in the “Roaring Twenties” John Moody explained that it was a unique era based upon the change to practical politics creating more retail consumption in America and even in Europe.

Now, every left-wing politician, operator or media star seems crazed in trying to outdo each other with reckless intrusions upon the normal order of society. Obviously, a frenzy to impose control.

Similar volatility occurred in the late 1960s and was followed by deflating financial assets and political ambition. “Reagan Democrats” found a home in the GOP.

During the preceding troubles, stocks were flying, commodities soaring, and inflation was becoming concerning. Then, and it seemed suddenly, students were protesting with “What about the people?” which sounded like socialists in England. But without the accents.

Today’s vandals have spared colleges; probably because most faculty are revolutionaries, at heart

However, there are differences. Then, rioters trashed and even burned campus offices. Most faculty were not revolutionaries. Today’s vandals have spared colleges; probably because most faculty are revolutionaries, at heart.

Radicals then funded themselves sometimes through bank robberies. The so-called Symbionese Liberation Army murdered bystanders while robbing banks.

Glaringly obvious is that the SLA was not professionally funded as today’s domestic terrorist groups are. Without sugar daddies, agitators could not afford months of rioting.

The equally aggressive Black Panthers were more widespread and dedicated to Marxist demands.  Capitalism was bad and everything should be free. Ironically, fund raising included buying bulk-discounted volumes of Mao’s Little Red Book and selling them at triple the price. Often in a manner that could not be refused.

And they had a chant that today’s MSM would herald “The Revolution has Come, it’s time to pick up the gun. Off the pigs!”

Beyond today’s funding and food trucks for the night-shift pros, there has been remarkable organization in spreading and arming the violence. Bricks and shields staged at convenient corners. Organized mayhem perhaps unseen since the street disorders in Germany in the early 1930s. Those conflicts involved two sets of professionals. Each with a distinguishing uniform, both desperate to impose their totalitarian visions.

The domestic team was the National Socialists who were contending against the visiting International Socialists, and the world eventually understood the horrors that go with experiments in unlimited government.

This writer’s independent research notes that the early 1900s started a long experiment in authoritarian government and the current attempt to corrupt the US Constitution is extraordinary but seems to be ending action. Indeed, ordinary voters or Hillary’s “deplorables”, or the “petit bourgeois” as deplored by legions of European intellectuals, are beginning to say “enough”.

Indeed, the recession is emphasizing the differences between the governing classes and those who are ruled. In-your-face and in-your-wallet government is becoming altogether too much.  And the financial markets are suffering a whack that typically precedes a severe contraction.

Financial expectations have become over-inflated and can suffer a profound deflation. Exhausted, the Left could lose its fever which would favor the Republicans on the November 3rd election.

Every successful reform has been conducted by ordinary folk.

ECB Thinking of Buying Bank Stocks


QUESTION: Buongiorno signor martin anche se mi piacerebbe chiamarla professore, è la Bce sta comprando azioni delle banche europee grz

AP

ANSWER: The ECB is looking into buying bank stocks because nobody else will. It is the only way to pretend they are meeting their capitalization. They are floating the idea of buying stocks, but they are not expressly saying bank stocks. It is another attempt to desperately try to hold on to this fiction. It will not succeed. They are buying stocks rather than doing bailouts. It amounts to the same thing, but they can claim it is not a bailout politically.

President Trump Press Conference – 5:00pm ET Livestream


President Trump is scheduled to hold a press conference at 5:00pm ET.

White House Livestream – Fox News Livestream Link – Alternate Livestream Link


.

.

“Peace is The Prize” – President Trump Negotiates Beginning of Historic Cooperation Between Serbia and Kosovo…


Once again showcasing the strategic success of the Trump Doctrine: focusing on economic security as a tool for national security – President Vučić of Serbia and Prime Minister Hoti of Kosovo joined President Trump in the oval office today to sign a joint statement of economic cooperation between the two nations. Truly a remarkable accomplishment.

.

[White House] – Statement by the President Regarding Economic Normalization between Serbia and Kosovo

Today, I am pleased to announce yet another historic commitment. Serbia and Kosovo have each committed to economic normalization. After a violent and tragic history and years of failed negotiations, my Administration proposed a new way of bridging the divide. By focusing on job creation and economic growth, the two countries were able to reach a real breakthrough on economic cooperation across a broad range of issues.


We have also made additional progress on reaching peace in the Middle East. Kosovo and Israel have agreed to normalization of ties and the establishment of diplomatic relations. Serbia has committed to opening a commercial office in Jerusalem this month and to move its embassy to Jerusalem by July.

It has taken tremendous bravery by President Vučić of Serbia and Prime Minister Hoti of Kosovo to embark on these talks and to come to Washington to finalize these commitments. By doing so, they have made their countries, the Balkans, and the world safer. I look forward to seeing Serbia and Kosovo prosper as we work together on economic cooperation in the region going forward.

President Trump has been executing a foreign policy, a clear doctrine of sorts, where national security is achieved by leveraging U.S. economic power. It is a fundamental shift in approaching both allies and adversaries; summarized within the oft repeated phrase: “economic security is national security.”

The Trump Doctrine of using economics to achieve national security objectives is a fundamental paradigm shift. Modern U.S. history provides no easy reference.

Peace is the prize” ~ President Donald Trump

The nature of the Trump foreign policy doctrine, as it has become visible, is to hold manipulative influence agents accountable for regional impact(s); and simultaneously work to stop any corrupted influence from oppressing free expression of national values held by the subservient, dis-empowered, people within the nation being influenced.

There have been clear examples of this doctrine at work. When President Trump first visited the Middle-East he confronted the international audience with a message about dealing with extremist influence agents. President Trump simply said: “drive them out.”

Toward that end, as Qatar was identified as a financier of extremist ideology, President Trump placed the goal of confrontation upon the Gulf Cooperation Council, not the U.S.

The U.S. role was clearly outlined as supporting the confrontation. Saudi Arabia, Kuwait, Egypt, Bahrain and the United Arab Emirates needed to confront the toxic regional influence; the U.S. would support their objective. That’s what happened.

Another example: To confront the extremism creating the turmoil in Afghanistan, President Trump placed the burden of bringing the Taliban to the table of governance upon primary influence agent Pakistan. Here again, with U.S. support. Pakistan is the leading influence agent over the Taliban in Afghanistan; the Trump administration correctly established the responsibility and gives clear expectations for U.S. support.

If Pakistan doesn’t change their influence objective toward a more constructive alignment with a nationally representative Afghanistan government, it is Pakistan who will be held accountable. Again, the correct and effective appropriation of responsibility upon the influence agent who can initiate the solution, Pakistan.

The process of accurate regional assignment of influence comes with disconcerting sunlight. Often these influences are not discussed openly. However, for President Trump the lack of honesty is only a crutch to continue enabling poor actors. This is a consistent theme throughout all of President Trump’s foreign policy engagements.

The European Union is a collective co-dependent enabler to the corrupt influences of Iran. Therefore the assignment of responsibility to change the status is placed upon the EU.

The U.S. will fully support the EU effort, but as seen in the withdrawal from the Iran Deal, the U.S. will not enable growth of toxic behavior. The U.S. stands with the people of Iran, but the U.S. will not support the enabling of Iranian oppression, terrorism and/or dangerous military expansion that will ultimately destabilize the region. Trump holds the EU accountable for influencing change. Again, we see the Trump Doctrine at work.

Perhaps the most obvious application of the Trump Doctrine is found in how the U.S. administration approached the challenging behavior of North Korea. Rather than continuing a decades-long policy of ignoring the influence of China, President Trump directly assigned primary responsibility for a reset to Beijing.

China held, and holds, all influence upon North Korea and has long-treated the DPRK as a proxy province to do the bidding of Beijing’s communist old guard. By directly confronting the influence agent, and admitting openly for the world to see (albeit with jaw-dropping tactical sanction diplomacy) President Trump positioned the U.S. to support a peace objective on the entire Korean peninsula and simultaneously forced China to openly display their closely-guarded influence.

While the Red Dragon -vs- Panda influence dynamic is still ongoing, the benefit of this new and strategic approach has brought the possibility of peace closer than ever in recent history.

No longer is it outlandish to think of North Korea joining with the rest of the world in achieving a better quality of life for its people.

Not only is President Trump openly sharing a willingness to engage in a new and dynamic future for North Korea, but his approach is removing the toxic influences that have held down the possibility for generations. By leveraging China (through economics) to stop manipulating North Korea, President Trump is opening up a door of possibilities for the North Korean people. This is what I mean when I say Trump is providing North Korea with an opportunity to create an authentic version of itself.

♦The commonality in these foreign policy engagements is the strategic placement of responsibility upon the primary influence agent; and a clear understanding upon those nation(s) of influence, that all forward efforts must ultimately provide positive results for people impacted who lack the ability to create positive influence themselves.

One of the reasons President Trump is able to take this approach is specifically because he is beholden to no outside influence himself. It is only from the position of complete independence that accurate assignments based on the underlying truth can be made; and that takes us to the ultimate confrontations – the trillion dollar confrontations.

A U.S. foreign policy that provides the opportunity for fully-realized national authenticity is a paradigm shift amid a world that has grown accustomed to corrupt globalists, bankers and financial elites who have established a business model by dictating terms to national leaders they control and influence. We have our own frame of reference with K-Street lobbyists in Washington DC. Much of President Trump’s global trade reset is based on confronting these multinational influence agents.

When you take the influence of corporate/financial brokers out of foreign policy, all of a sudden those global influence peddlers are worthless. Absent of their ability to provide any benefit, nations no longer purchase these brokered services.

As soon as influence brokers are dispatched, national politicians become accountable to the voices of their citizens. When representing the voices of citizens becomes the primary political driver of national policy, the authentic image of the nation is allowed to surface.

Fortunately we are living in a time of great history, and we have multiple examples surfacing around the world. National elections in Poland, Hungary, Italy, Brazil and right here in the U.S. via Donald Trump highlight responses to dysfunctional multiculturalism and financial influences from corrupt elites within the institutions of globalist advocacy: The International Monetary Fund (IMF), the World Bank, and the World Trade Organization (WTO).

Globalism can only thrive amid a class structure where the elites, though few in number, have more controlling power over the direction of government. It is not accidental the EU has appointed officials and unelected bureaucrats in Brussels as the primary decision-making authority.

As the Trump Doctrine clashes with the European global elite, the withdrawal of the U.S. financial underwriting creates a natural problem. Subsidies are needed to retain multiculturalism.

If a national citizenry has to pay for the indulgent decisions of the influence class, a crisis becomes only a matter of time.

Wealth distribution requires a host.

Since the end of World War II the U.S. has been a bottomless treasury for EU subsidy. The payments have been direct and indirect. The indirect have been via U.S. military bases providing security, the NATO alliance, and also by U.S. trade policy permitting one-way tariff systems. Both forms of indirect payment are now being reversed as part of the modern Trump Doctrine.

We are living in historic times….


August Jobs Report: 1.4 Million Jobs Recovered, Unemployment Rate Drops to 8.4 Percent…


The Bureau of Labor Statistics (BLS) highlights the August jobs report today and both measures (Household Survey and Establishment survey) show a remarkable recovery underway from the COVID-19 crisis.   Overall, 1.4 million jobs were recovered and the national unemployment rate drops to 8.4%.

Most economists did not predict the unemployment rate would drop into single digits until next year.  However, the historically accurate household survey shows 3.8 million people recalled, returned or found jobs; with 2.8 million saying they were no longer unemployed.

.

Despite the ongoing challenges there is good news for the most heavily impacted sectors of the economy: leisure and hospitality. Well over half of those jobs lost have been recovered. In the past four months 3.6 million jobs have been gained in this sector. Employment in food services and drinking places is still down by down by 2.5 million since the peak in February but the gain is significant and reflects a “V-shaped” recovery ongoing.

All sectors of the economy are gaining jobs back at a remarkable rate; and the key demographics are benefiting in proportion to the initial COVID-19 impact. [BLS Report HERE]  With the expiration of the “extra” federal unemployment benefits at the end of July, the negative incentive has been removed; more people are stepping back into the workforce.

“This was a strong report that shows the recovery remains on track,” said Joel Naroff of Naroff Economic Advisors. “The labor market has come back faster than expected and we are seeing improvement in all segments of the economy and the workforce.”  (MSM Link)


President Trump MAGA Rally in Latrobe Pennsylvania – 7:00pm ET Livestream…


Back in rally mode, tonight President Donald J. Trump will be holding a campaign rally at Arnold Palmer Regional Airport in Latrobe, Pennsylvania. President Trump is expected to speak at 7:00pm ET with pre-rally speakers beforehand.

Donald Trump Campaign Livestream – RSBN Livestream Link – Fox News Livestream


.

.

Australian Tyranny – Is Revolution Coming?


This video shows the tyranny in Australia as they arrested a pregnant woman for posting about a protest against the lockdowns. We have warned that the War Cycle, which includes Civil Unrest, turned up in 2014 and will build into intensity by 2022. This is not a forecast that has ever given me any pleasure. The two components are international war and civil unrest which leads to revolution. The worst seems to be on schedule for the Pi Target after 2024 and the peak of this 8.6-year business cycle wave of the Economic Confidence Model.

On January 1, 1901, the six colonies joined together forming the Commonwealth of Australia. The Revolutionary Cycle in Australia turned up in 2013, just slightly before the global War Cycle which turned up in 2014. The actions of the Australian government have completely turned toward an absolute authoritarian reign. Here you see that they are indeed monitoring all social media arresting a pregnant woman for merely posting on Facebook that a protest would take place. Even the German high court ruled that the government could not stop the protest on August 29th, 2020. Here in Australia, you see that the government has rejected every principle of a free society. Typically, the West would impose sanctions against Australia blocking all trade for they are treating their people no different than Russia invading Crimea as the West alleges, Syria, or Iran. Don’t forget the allegations against Iraq that it was a dictatorship.

The Australian Civil Unrest Cycle should begin to pop next year in 2021 and build into intensity by 2026. These politicians will be voted out of office so there will most likely be claims that in the middle of such a crisis, elections will be suspended. These politicians cannot now allow a free election for anyone who would then side with the people would be moved to arrest these politicians and prosecute them. Therefore, as long as Australian police act like the ones in this video, there will eventually be blood in the streets.


After the previous turning point of August 7th, 1964 which picked the Gulf of Tonkin Resolution incident to the day, there were massive protests against the Vietnam War. This is also the era when the Beatles wrote the song Revolution. Today, they would probably be thrown in prison for daring to even sing it. In Britain, the BBC is banning a song Rule Britania because it says they will never be slaves.

Never in my wildest imagination did I ever expect such a wholesale coup against our freedoms. This is what the rest of us face from 2021 on. Politicians no longer represent the people. They have simply gone mad. There are elections coming in 2021 around many places globally. I would expect them to be rigged, or even suspended for those in power doing this sort of oppression will surely not be re-elected. This is a global coup because the socialistic systems are failures which include the pensions for government workers.

Fundamentals & Confidence – Which is More Important in Markets?


QUESTION: Mr. Armstrong, You have said that fundamentals really mean nothing because the market runs on confidence. What about the fundamentals during the 2008 crash? Didn’t the bankruptcy of Lehman Brothers send the market down and then it was supported by TARP and the central banks?

Thank you;

GD

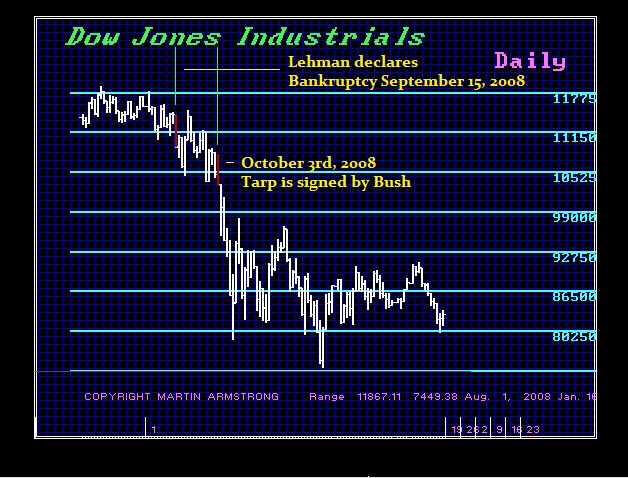
ANSWER: The entire economy is built upon CONFIDENCE and then that moves in ANTICIPATION of events which often may never even take place. Here is a chart of the Crash of 2008. You can easily see that the bankruptcy of Lehman was not really that devastating. Then you look at when the government passed TARP on October 3rd, 2008. The Dow fell from over 10,000 to mid 7000 levels in 5 days after TARP.  It consolidated briefly but continued lower into the week 0of March 2nd, 2009. Obviously, the market continued to collapse as CONFIDENCE declined and there was NO INDICATION that the government intervention ever worked including the monetization by the Fed.

I have made it very clear that LOWERING interest rates has NEVER saved the day. The $700 billion they handed banks saved the banks, but they NEVER lent the money out. They lacked the CONFIDENCE that the crisis would end soon so they would not lend money and simultaneously people are NOT going to borrow to “stimulate” the economy when they too fear the future is just unknown. These theories are made up by academics who have NEVER traded in their lives. It is impossible to understand these concepts without hands-on experience.

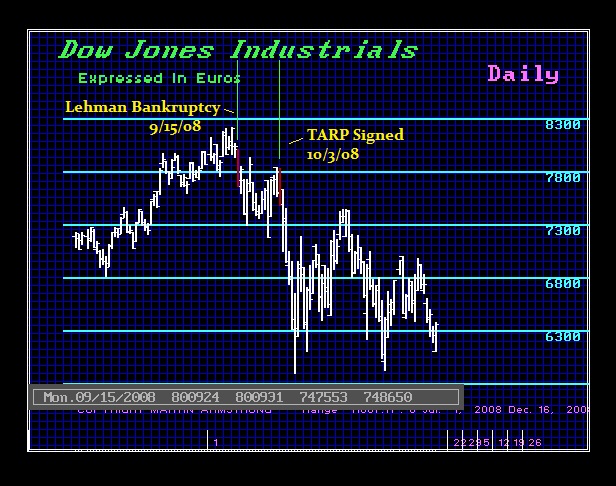
This is what Socrates writes for each day during the crash. You have to approach this objectively. There are more than 70 independent models correlating together to produce these results. Then everything must be looked at also from an international perspective. Internationally, Lehman had more of a bearish impact whereas TARP was seen as more positive internationally. What a difference currency makes.


Friday October 3, 2008

The Dow Jones Industrials made a new low penetrating the previous session’s low and then closed below that level plunging significantly again by 4.75% which strongly suggests we are entering a potential crash mode position. A break of today’s low of 1031025 during the next trading session will warn of a potentially serious decline ahead especially if it closes below today’s low again. The last important high was formed on Monday August 11th at trading days ago. Our projected support for tomorrow lies at 1018098 and a break of that level can set in motion a panic to the downside. Hence, pay close attention at this time.

We did close above the previous session’s Intraday Crash Mode technical support indicator which was 997310 settling at 1048285. The current crash mode support for this session was 999652 which we still closed above implying the market is holding for now. The Intraday Crash indicator for the next session will be 1002412. Now we have been holding above this indicator in the current trading session, and it resides lower for the next session. If the market opens above this number and holds above it intraday, then we are consolidating. Prevailing above this session’s low will be important to indicate the market is in fact holding. The Secondary Intraday Crash Mode technical support lies at 943412 which we are trading above at this time. A breach of this level with a closing below will signal a sharp decline is possible.

Intraday Projected Crash Mode Points

Today……            999652

Previous…          997310

Tomorrow…       1002412

This market has declined for 2 trading days which has been a sharp decline of 5.25%. However, we have not elected any bearish Reversals to date from the high of Wed. 1st.

The Uptrend Line from the last low created at 1036545 tied to the secondary low made on 10/02 remains as resistance standing at 1046421. Only getting above this level on a sustained closing basis will signal a rally to the upside.

Currently, the market remains quite bearish below all our system support indicators with resistance starting at 1037142. The broader cyclical system indicators are also in a bearish position while the long-term trend and cyclical strength are bearish. This market has technically been trading beneath our projected envelope of support at 1050088 warning this decline has been rather reasonable down 10% from the high made 09/19. We have elected all four Bearish Reversals from that high showing weakness.


Monday October 6, 2008

The Dow Jones Industrials made a new low penetrating the previous session’s low and then closed below that level collapsing substantially again by 11% warning this market is entering a Panic Sell-Off. Penetrating today’s low 952532 and closing beneath it will tend to confirm that warning. The projected support for the next session lies at 907292. Penetrating this level intraday would warn of a panic to the downside becomes possible which strongly suggests we are entering a potential crash mode position. A break of today’s low of 952532 during the next trading session will warn of a potentially serious decline ahead especially if it closes below today’s low again. The last important high was formed on Monday August 11th at trading days ago.

Our projected support for tomorrow lies at 935730 and a break of that level can set in motion a panic to the downside. Hence, pay close attention at this time.

We did close above the previous session’s Intraday Crash Mode technical support indicator which was 999652 settling at 1032538. The current crash mode support for this session was 1002412 which we penetrated intraday and closed below warning this market is in a panic type sell-off. The Intraday Crash indicator for the next session will be 907292. Normally, when you open back above this pivot number or closed back above it then the sell-off is subsiding. So, watch this number which is dynamic for it changes with each session.

Intraday Projected Crash Mode Points

Today……            1002412

Previous…          999652

Tomorrow…       907292

This market has declined for 3 trading days which has been a sharp decline of 12%. However, the overall decline has been more pronounced falling for 11 trading days. In the process, we have elected all four Daily Bearish Reversals from the high of 09/19.

Our projected pivot point remains as resistance standing at 1029645. Only getting above this level on a sustained closing basis will signal a rally to the upside.

As of now, the market remains quite bearish below all our system support indicators with resistance starting at 1036545. The broader cyclical system indicators are also in a bearish position while the long-term trend and cyclical strength are bearish. This market has technically been trading beneath our projected envelope of support at 1045207 warning this decline has been rather a spectacular crash down where emotions run high 17% from the high made 09/19. We have elected all four Bearish Reversals from that high showing weakness.


Tuesday October 7, 2008

The Dow Jones Industrials made a new low penetrating the previous session’s low and then closed below that level plunging significantly again by 8.58% which strongly suggests we are entering a potential crash mode position. A break of today’s low of 943667 during the next trading session will warn of a potentially serious decline ahead especially if it closes below today’s low again. The last important high was formed on Monday August 11th at 1186711 which was 41 trading days ago. Our projected support for tomorrow lies at 928188 and a break of that level can set in motion a continued panic to the downside where extreme support lies at 907521. Hence, pay close attention at this time.

We did close below the previous session’s Intraday Crash Mode technical support indicator at 1002412 settling at 995550 which alerted us to a further decline was likely going into the instant session. The immediate crash mode support for this current session was 907292 which we have now closed back above suggesting the crash is subsiding. The Intraday Crash indicator for the next session will be 907521. Now since we closed back above this indicator in the current trading session, then holding above this indicator for the next session will imply the decline is subsiding. The Secondary Intraday Crash Mode technical support lies at 906159 which we are trading above at this time. A breach of this level with a closing below will signal a sharp decline is possible.

Intraday Projected Crash Mode Points

Today……            907292

Previous…          1002412

Tomorrow…       907521


This market has declined for 4 trading days since the last high established at 1088252 from which we have witnessed a decline of 13%. However, the overall decline has been more pronounced falling for 12 trading days which has been a decline of 17%.

Granted, this decline has penetrated the previous key cycle low established at 1045944 and it is sharply lower by 18% from the last high made 09/19. Most importantly, this market entered Crash Mode 3 days ago. This type of pattern warns we are in the throes of a near-term correction which is rather serious at this moment.

Interestingly, this market has fallen down for 5 days from highest close closed below the previous low warning that the market is still vulnerable. The next projected target support lies at 990658 and we have already broken below two extreme projected technical support levels. Naturally, any short position should include a protective intraday stop above the previous high for now.


Wednesday October 8, 2008

The Dow Jones Industrials made a new low penetrating the previous session’s low and then closed below that level plunging significantly in panic mode for the fifth consecutive time by 9.17%. This does warn that this market is in crash mode position right now. A break of today’s low of 919478 during the next trading session will warn of a potentially serious decline ahead especially if it closes below today’s low again. The last important high was formed on Monday August 11th at 1186711 which was 42 trading days ago. Our projected support for tomorrow lies at 902755 and a break of that level can set in motion a continued panic to the downside where extreme support lies at 885724. Hence, pay close attention at this time.

We did close above the previous session’s Intraday Crash Mode technical support indicator which was 907292 settling at 944711. The current Crash Mode support for this session was 907521 which we closed above at this time. The Intraday Crash indicator for the next session will be 885724. Up to now, the market has been holding above this Crash Mode indicator in the current trading session, but it is still declining sharply. Granted, it is also moving lower for the next session. A consolidation would only be suggested by opening above this target, and holding this session’s low of 919478 intraday. However, a break of this session’s low followed by a closing below this level as well will warn that a continued sharp decline is still in motion.

Intraday Projected Crash Mode Points

Today……            907521

Previous…          907292

Tomorrow…       885724

This market has declined for 5 trading days since the last high established at 1088252 from which we have witnessed a decline of 15% qualifying this as a correction. However, the overall decline has been more pronounced falling for 13 trading days which has been a decline of 19%.

Granted, this decline has penetrated the previous key cycle low established at 1045944 and it is sharply lower by 20% from the last high made 09/19. Most importantly, this market entered Crash Mode 4 days ago. This type of pattern warns we are in the throes of a near-term correction which is rather serious at this moment.

Interestingly, this market has fallen down for 6 days from highest close closed below the previous low warning that the market is still vulnerable. The next projected target support lies at 966672 and we have already broken below one extreme projected technical support level. Naturally, any short position should include a protective intraday stop above the previous high for now.

Factually, the market remains quite bearish below all our system support indicators with resistance starting at 1031025. The broader cyclical system indicators are also in a bearish position while the long-term trend and cyclical strength are bearish. This market is also trading mostly below the bank of eight moving average indicators suggesting it remains in a mixed posture for now.

This market has technically been trading beneath our projected envelope of support at 1017578 warning this decline has been rather a spectacular crash down where emotions run high 19% from the high made 09/19. We have elected all four Bearish Reversals from that high showing weakness.


Thursday October 9, 2008

The Dow Jones Industrials made a new low penetrating the previous session’s low and then closed below that level collapsing substantially for the sixth consecutive time by 10% warning this market remains in a Panic Sell-Off. Penetrating today’s low 857919 and closing beneath it will tend to confirm that warning. Our extreme projected underlying support for tomorrow lies at 799800. This market has immediately declined for 6 trading days. This does warn that this market is in crash mode position right now. A break of today’s low of 857919 during the next trading session will warn of a potentially serious decline ahead especially if it closes below today’s low again. The last important high was formed on Monday August 11th at 1186711 which was 43 trading days ago.

Our projected support for tomorrow lies at 835591 and a break of that level can set in motion a continued panic to the downside where extreme support lies at 819531. Hence, pay close attention at this time.

We did close above the previous session’s Intraday Crash Mode technical support indicator which was 907521 settling at 925810. The current Crash Mode support for this session was 885724 which we penetrated intraday and closed below warning this market is in a panic type sell-off. The Intraday Crash indicator for the next session will be 819531. Normally, when you open back above this pivot number or closed back above it then the sell-off is subsiding. So, watch this number which is dynamic for it changes with each session.

Intraday Projected Crash Mode Points

Today……            885724

Previous…          907521

Tomorrow…       819531

This market has declined for 6 trading days since the last high established at 1088252 from which we have witnessed a decline of 21% qualifying this as a correction. However, the overall decline has been more pronounced falling for 14 trading days which has been a decline of 25%.

Granted, this decline has penetrated the previous key cycle low established at 1045944 and it is sharply lower by 26% from the last high made 09/19. This type of pattern warns we are in the throes of a near-term correction which is rather serious at this moment.

Interestingly, this market has dropped for several days and closed below the previous low warning that the market is still vulnerable. The projected extreme target support for tomorrow lies at 799800 which needs to hold on a closing basis to imply a bounce can form thereafter.

Up to now, the market remains quite bearish below all our system support indicators with resistance starting at 952532. The broader cyclical system indicators are also in a bearish position while the long-term trend and cyclical strength are bearish. This market is also trading mostly below the bank of eight moving average indicators suggesting it remains in a mixed posture for now.

This market has technically been trading beneath our projected envelope of support at 999397 warning this decline has been rather a spectacular crash down where emotions run high 25% from the high made 09/19. We have elected all four Bearish Reversals from that high showing weakness.


Friday October 10, 2008

The Dow Jones Industrials made a new low penetrating the previous session’s low after opening below it and then closed below that level collapsing substantially for the seventh consecutive time by 27% warning this market has been in a Panic Sell-Off after 7 days down. It is possible that we may have a temporary low forming. The extreme projected underlying support for today was 799800 which today’s action did penetrate intraday but we closed above that at the end of the session. Our extreme projected underlying support for tomorrow lies at 713534.

Indeed, this market has declined sharply bringing to bear the full scope of emotions in such declines. We need a higher open and a break above today’s high of 890128 while holding today’s low of 788251 to suggest a bounce is in order.

The Projected Breakout Resistance indicator resides at 865254 which we are already exceeded intraday but the market closed below it as of this session’s closing at 845119 Still, this typically implies that this market will rally to test overhead resistance if we exceed that level again intraday.

Intraday Projected Breakout Resistance

Today……            923667

Previous…          941209

Tomorrow…       865254

Clearly, this market has been in crash mode position up to now. A break of today’s low of 788251 during the next trading session will warn of a potentially serious decline ahead especially if it closes below today’s low again. The last important high was formed on Monday August 11th at 1186711 which was 44 trading days ago.

Our projected support for tomorrow lies at 760663 and a break of that level can set in motion a continued panic to the downside where extreme support lies at 745394. Hence, pay close attention at this time.

We did close below the previous session’s Intraday Crash Mode technical support indicator at 885724 settling at 857919 which alerted us to a further decline was likely going into the instant session. The immediate Crash Mode support for this current session was 819531 which we have now closed back above suggesting the crash is subsiding. The Intraday Crash indicator for the next session will be 745394. Now since we closed back above this indicator in the current trading session, then holding above this indicator for the next session will imply the decline is subsiding.

Intraday Projected Crash Mode Points

Today……            819531

Previous…          885724

Tomorrow…       745394


This market has declined for 7 trading days since the last high established at 1088252 from which we have witnessed a decline of 27% qualifying this as a correction. However, the overall decline has been more pronounced falling for 15 trading days which has been a decline of 31%.

Granted, this decline has penetrated the previous key cycle low established at 1045944 and it is sharply lower by 32% from the last high made 09/19. This type of pattern warns we are in the throes of a near-term correction which is rather serious at this moment.

Interestingly, this market has dropped for several days and closed below the previous low warning that the market is still vulnerable. The projected extreme target support for tomorrow lies at 713534 which needs to hold on a closing basis to imply a bounce can form thereafter.

Presently, the market remains quite bearish below all our system support indicators with resistance starting at 943667. The broader cyclical system indicators are also in a bearish position while the long-term trend and cyclical strength are bearish. This market is also trading mostly below the bank of eight moving average indicators suggesting it remains in a mixed posture for now.

This market has technically been trading beneath our projected envelope of support at 981467 warning this decline has been rather a spectacular crash down 31% from the high made 09/19. We have elected all four Bearish Reversals from that high showing weakness. We have not elected any Bullish Reversals from this low today.